. 2024 Jan 16;7(1):105.
doi: 10.1038/s42003-023-05662-9.

Susceptibility to acute cognitive dysfunction in aged mice is underpinned by reduced white matter integrity and microgliosis

Affiliations

Susceptibility to acute cognitive dysfunction in aged mice is underpinned by reduced white matter integrity and microgliosis

Dáire Healy et al. Commun Biol. .

Abstract

Age is a significant but heterogeneous risk factor for acute neuropsychiatric disturbances such as delirium. Neuroinflammation increases with aging but the determinants of underlying risk for acute dysfunction upon systemic inflammation are not clear. We hypothesised that, with advancing age, mice would become progressively more vulnerable to acute cognitive dysfunction and that neuroinflammation and neuronal integrity might predict heterogeneity in such vulnerability. Here we show region-dependent differential expression of microglial transcripts, but a ubiquitously observed primed signature: chronic Clec7a expression and exaggerated Il1b responses to systemic bacterial LPS. Cognitive frailty (vulnerability to acute disruption under acute stressors LPS and double stranded RNA; poly I:C) was increased in aged animals but showed heterogeneity and was significantly correlated with reduced myelin density, synaptic loss and severity of white matter microgliosis. The data indicate that white matter disruption and neuroinflammation may be key substrates of the progressive but heterogeneous risk for delirium in aged individuals.


Conflict of interest statement

The authors declare no competing interests.

Figures
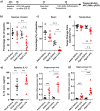
Fig. 1
Fig. 1. LPS induces exaggerated sickness responses and IL-1 responses in aged mice.
a, b Effect treatment with LPS (100 µg/kg i.p.) on sickness behaviour in adult (8 months) and aged (25 months) measured at 3-hours-post intraperitoneal LPS, measured by open field activity (b) distance covered (squares crossed) and (c) number of rears expressed as a percentage of baseline performance in adult and aged cohorts. d Effect of LPS (100 µg/kg) at 4-hours-post i.p. LPS treatment on core body temperature (°C). e Plasma IL-1β concentration at 4 hours post-LPS. f, g hippocampal Il1b and Il1a transcript expression at 4 hours post-LPS. All data are represented as mean ± SEM. All data were analysed by two-way ANOVA followed, upon significant main effects, by Bonferroni multiple comparison post-hoc tests (n = 6,7 independent animals), * denotes a statistically significant effect of treatment (p < 0.05),**(p < 0.01), ***(p < 0.001) by Bonferroni post-hoc test. + denotes significant difference between young and aged responses to LPS treatment ++(p < 0.01), +++(p < 0.001) by Bonferroni post-hoc test.
Fig. 2
Fig. 2. Microglial and complement system marker expression across the aged brain.
Effect of age (aged 8 months vs 25 months) on neuroinflammatory transcript expression (columns) in cerebellum, hypothalamus, hippocampus and prefrontal cortex (rows) under acute systemic challenge with LPS (100 µg/kg) i.p. treatment. All data are represented by mean ± SEM (n = 6,7 animals per treatment) and analysed by two-way ANOVA followed by a Bonferroni post-hoc test, # denotes a statistically significant main effect of age on transcript expression; # (p < 0.05), ## (p < 0.01), ### (p < 0.001). + denotes a statistically significant interaction between age and treatment (i.e. differential of effect of LPS in aged animals) + (p < 0.05), ++ (p < 0.01), +++ (p < 0.001).
Fig. 3
Fig. 3. Age-dependent cognitive vulnerability to systemic inflammation-induced acute cognitive deficits.
a Schematic illustrating the experimental timeline. b Impact of consecutive saline, LPS (100 µg/kg i.p.) and Poly I:C (12 mg/kg i.p.) on working memory assessed by T-Maze. All data are represented graphically by mean ± SEM (Ages: 24 months n = 13, 16-19 months n = 12, 5-7 months n = 22), analysed by repeated measures two-way ANOVA, across the full time course with multiple comparisons by Bonferroni post-hoc test, * denotes treatment is significantly different between 24-month and 5-7-month cohorts *(p < 0.05), ***(p < 0.001), # denotes that treatment is significantly different between 16-19-month and 5-7-month cohorts #(p < 0.05).
Fig. 4
Fig. 4. Relationship between cognitive status and histochemical and quantitative analysis of microglial activation.
Quantification of positively stained IBA-1+ microglia area (a) and count of IBA-1+ cells (b) in multiple areas of the hippocampal formation, categorised by age (young 5-7 months, aged includes all from 16-24 months) & cognitive frailty; quantified using Image J (NIH) at 20x. cq Immunohistochemical analysis of microglial activation and morphology of microglia labelled with IBA-1 in the CA1 (c, d, e), dentate gyrus (f, g, h), fimbriae (I, j, k), corpus callosum (l, m, n), dentate nucleus (o, p, q). All data are represented by mean ± SEM and analysed by one-way ANOVA with Bonferroni post-hoc tests to detect microglial differences between young, (n ≥ 9), old cognitively resilient (n = 6) and old cognitively frail (n = 7) Statistically significant Bonferroni post-hoc differences between aged cognitively resilient and aged cognitively frail animals after significant main effects are denoted by *p < 0.05, **p < 0.01, ***p < 0.001.
Fig. 5
Fig. 5. Integrity of white matter tracts of the hippocampal formation.
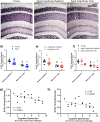
Photomicrographs of Luxol fast blue staining for myelin density in the hippocampus and corpus callosum (CC) and fimbria at 2.5X magnification. The effect of age (n = 12 young; 5-7 months, n = 12 aged/old includes all from 16-24 months) and cognitive frailty (n = 16,8) on myelin density and microgliosis were assessed by histochemical and quantitative analysis of LFB staining of the CC (ac) and fimbria (ln), and IBA-1+ immunostaining of CC (df) and fimbria (oq). Quantitative analyses of myelin density as a function of different categorisations that distinguish the groups are presented in gi for CC and in rt for fimbria. All data are represented by mean ± SEM and analysed by student’s t-test test (g, h, r, s) or one-way ANOVA with Bonferroni post-hoc tests (i, t) to detect effects of ageing and/or cognitive frailty with white matter measures (n = 10,6,6 for young, aged resilient and aged vulnerable respectively). Correlations assessed by Pearson’s linear regression analysis of myelin density vs. % of IBA-1+ area in the CC and fimbria (j, u); myelin density vs. cognitive dysfunction (k, v). All images quantified using Image J (NIH) at 20x. Statistically significant differences between groups are indicated by *p < 0.05, **p < 0.01, ***p < 0.001.
Fig. 6
Fig. 6. Quantitative and histochemical analysis of presynaptic neuronal integrity in the young and aged brain and with cognitive frailty.
ac Presynaptic neuronal terminals density in the hippocampal layers stained with SY38 at 10x. df Sy38 density, quantified using Image J, plotted in Stratum Radiatum (SR) and Molecular layer (ML). All data represented by mean ± SEM and analysed by student’s t-test test (d, e) to detect effects of age (n = 9,12; includes all from 16-24 months), cognitive frailty (n = 11,10). The statistically significant association of cognitive status with decreased density is indicated by *p < 0.05 (e). To assess association of aged cognitive frailty status (n = 9,6,6) with pre-synaptic terminal density, one-way ANOVA, followed by Bonferroni post-hoc tests were performed (f). Statistical significance is denoted by *p < 0.05 for reduced density in aged cognitively frail animals compared to aged cognitive resilient animals and #p < 0.05 for aged cognitively frail animals compared to young animals. Correlations of SY38+ terminal density in the SR and ML vs. cognitive dysfunction assessed by Pearson’s linear regression analysis (n = 21). All images quantified using Image J (NIH) at 20x, statistical significance indicated by *p < 0.05 (g, h).

Similar articles

Cited by

References

    1. Kirkwood, T. B. L. Understanding the odd science of aging. Cell 120 437–447 (2005). - PubMed
    1. Chesky, J. A. THE BIOLOGY OF AGING: OBSERVATIONS & PRINCIPLES (3rd Edition) By Robert Arking. Educational Gerontology33, 3-25 (2007).
    1. Clegg A, Young J, Iliffe S, Rikkert MO, Rockwood K. Frailty in elderly people. Lancet. 2013;381:752–762. doi: 10.1016/S0140-6736(12)62167-9. - DOI - PMC - PubMed
    1. Esiri, M. M. Ageing and the brain. J. Pathol. 211, 181–187 (2007) 10.1002/path.2089. - PubMed
    1. Dekaban AS, Sadowsky D. Changes in brain weights during the span of human life: Relation of brain weights to body heights and body weights. Ann. Neurol. 1978;4:345–356. doi: 10.1002/ana.410040410. - DOI - PubMed

Publication types

Substances