. 2024 Jan 11;14(1):1069.
doi: 10.1038/s41598-024-51619-1.

Transcription factor FoxO1 regulates myoepithelial cell diversity and growth

Affiliations

Transcription factor FoxO1 regulates myoepithelial cell diversity and growth

Rino Tokumasu et al. Sci Rep. .

Abstract

Salivary gland myoepithelial cells regulate saliva secretion and have been implicated in the histological diversity of salivary gland tumors. However, detailed functional analysis of myoepithelial cells has not been determined owing to the few of the specific marker to isolate them. We isolated myoepithelial cells from the submandibular glands of adult mice using the epithelial marker EpCAM and the cell adhesion molecule CD49f as indicators and found predominant expression of the transcription factor FoxO1 in these cells. RNA-sequence analysis revealed that the expression of cell cycle regulators was negatively regulated in FoxO1-overexpressing cells. Chromatin immunoprecipitation analysis showed that FoxO1 bound to the p21/p27 promoter DNA, indicating that FoxO1 suppresses cell proliferation through these factors. In addition, FoxO1 induced the expression of ectodysplasin A (Eda) and its receptor Eda2r, which are known to be associated with X-linked hypohidrotic ectodermal dysplasia and are involved in salivary gland development in myoepithelial cells. FoxO1 inhibitors suppressed Eda/Eda2r expression and salivary gland development in primordial organ cultures after mesenchymal removal. Although mesenchymal cells are considered a source of Eda, myoepithelial cells might be one of the resources of Eda. These results suggest that FoxO1 regulates myoepithelial cell proliferation and Eda secretion during salivary gland development in myoepithelial cells.


Conflict of interest statement

The authors declare no competing interests.

Figures
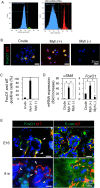
Figure 1
Figure 1
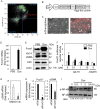
FoxO1 was predominantly expressed in ME cells. (A–D) ME cells were isolated from 8-week-old male Myh11-CreERT2/tdTomato (tdT)fl/fl mice (n = 4). Cre recombination was induced by tamoxifen injection 1 day before the assay. (A) Flow cytometry histograms. The Myh11-positive ME cells (tdT+) represented 10.6% (right) of salivary gland tissue cells without endothelial cells, hematocytes, and erythroid cells (CD31C45TER119; 96.06%, left). (B,C) tdT fluorescence and FoxO1 immunofluorescence (IF) in FACS-sorted cells [crude, Myh(+), Myh(−)] (B). Bar = 20 μm. The cell population expressing FoxO1 and tdT double positive (%) in each FACS-sorted cells [crude, Myh(+), Myh(−)] (C). Threshold intensity was 30. *P < 0.05. (D) Expression of αSMA and FoxO1 in CD31C45TER119 cells (crude), tdT-positive [Myh(+)] and -negative [Myh(−)] cells. *P < 0.05. (E) tdT fluorescence and IF of FoxO1 and E-cadherin (E-cad) in submandibular glands (SMG) of Myh11-CreERT2/tdTfl/fl on embryonic day 16 (E16, n = 4) and at 8 weeks (8w, n = 3). The arrow head showed αSMA and FoxO1 double positive cells. Bar = 20 μm. All data were representative of three independent experiments. See also Supplementary Fig. S1.
Figure 2
Figure 2
Overexpression of FoxO1 in ME cells. (A) Scatter plot of CD49f (x-axis) and EpCAM (y-axis). The cells were isolated from SMG in TP53 mutant female mice (n = 4) and analyzed by flow cytometry. EpCAMlowCD49fhigh-cells were sorted as ME cells (6.5%). (B) A schematic for integration of PiggyBac transposon vector plasmid. The Tet-On inducible gene expression system was used. FoxO1 expression was induced by doxycycline (Dox). (C) mCherry fluorescence merged with phase contrast in MEPB-FoxO1 cells treated with and without Dox (2 µg/mL) for 48 h. (D) Expression of FoxO1 mRNA in MEPB-FoxO1 cells treated with and without Dox for 24 h. *P < 0.05. n = 3. (E) Immunoblotting for FoxO1, αSMA, Krt14, Krt5, and β-actin in MEPB-FoxO1 cells treated with and without Dox for 72 h. (F) FoxO1 luciferase assay in the presence of FoxO1 inhibitor (Inh.; AS1842856) at the indicated concentrations. pGL4 luciferase reporter vector (upper) was constructed to include three FoxO1-binding elements (daf16:TTGTTTA and mdaf16:TTGCTTA). FoxO1 transcriptional activity was measured. pRL-TK was used as internal control. The Renilla luciferase normalized the firefly luciferase. #P < 0.05 vs. control (Ctrl). *P < 0.05 vs. Dox. n = 5. (G) Expression of αSMA mRNA in ME cells treated with and without FoxO1 inhibitor (Inh.; AS1842856, 1 μM) for 72 h. *P < 0.05. n = 3. (H) Expression of FoxO1 and αSMA mRNA in siRNA-mediated knockdown of FoxO1 (siFoxO1) or control (si Ctrl) in ME cells. *P < 0.05. n = 3. (I) Immunoblotting for NF-κB/p65 and phospho-NF-κB/p65 in MEPB-FoxO1 cells treated with and without Dox at the indicated time-points. The signal intensity of phospho-NF-κB/p65 was normalized to that of NF-κB/p65 (ratio). All data were representative of three independent experiments. See also Supplementary Figs. S2 and S3.
Figure 3
Figure 3
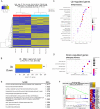
Transcriptome profiling of FoxO1-expressing ME cells. The RNA samples were prepared from MEPB-FoxO1 cells treated with and without Dox for 72 h. (A) Heatmap of differentially expressed genes (control vs. FoxO1). (B) The number of up- and down-regulated genes based on fold change of comparison pair (FoxO1/control ≥ 2, P < 0.05). (C–F) Enrichment of Gene Ontology terms for biological processes associated with up- (C) and down- (D) regulated genes. (E,F) Data from the gene set enriched analysis (GSEA). The top gene lists of normalized enrichment score (NES) are shown in (E). *P < 0.001. Enrichment plot of cyclin A B1 B2 associated events during G2 M transition are shown in (F). See also Supplementary Tables S2–S5.
Figure 4
Figure 4
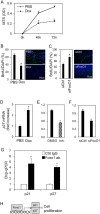
FoxO1 suppressed ME cell proliferation via cell cycle arrest. (A) Viability of MEPB-FoxO1 cells treated with and without Dox (2 µg/mL) at the indicated time-points. (B,C) Cell proliferation rates were measured by BrdU incorporation assay. BrdU positive/DAPI (%, left) with and without Dox (2 µg/mL) for 24 h (B) or with and without transfection of siRNA for FoxO1 for 48 h (C). Immunofluorescent images were showed on the right (BrdU; green, DAPI; blue). (D–F) Expression of p27(KIP1) in MEPB-FoxO1 cells. Cells were treated with and without Dox (2 µg/mL) (D), pretreated with and without FoxO1 inhibitor (Inh.; AS1842856, 1 μM) (E) and transfected with siRNA for FoxO1 (F) in the presence of Dox (2 µg/mL) for 48h. The expression data of p21(CIP/WAF1) were shown in Fig. S4. (G) Chromatin immunoprecipitation-quantitative real-time PCR (ChIP-qPCR) analysis of the DNA binding activity of FoxO1 in ME cells. DNA sample was prepared from MEPB-FoxO1 cells treated with Dox (2 µg/mL) for 72 h. The associated DNA at the promoter regions of p21CIP/WAF1 (− 1722 to − 1712) and p27KIP1 (− 1036 to − 1026), after incubation with FoxO1 antibody-conjugated protein G beads, were immunoprecipitated and analyzed by qPCR. *P < 0.05. n = 3. All data were representative of three independent experiments. (H) A schematic for FoxO1-induced cell growth inhibition. See also Supplementary Fig. S4.
Figure 5
Figure 5
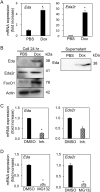
FoxO1 induced Eda/Eda2r expression in ME cells through NF-κB activation. (A,B) Gene expression (A) and immunoblotting (B) of Eda and Eda2r in MEPB-FoxO1 cells treated with and without Dox (2 µg/mL) for 24 h. (C) Expression of Eda and Eda2r in Dox-treated (2 µg/mL, 72 h) MEPB-FoxO1 cells with and without FoxO1 inhibitor (Inh.; AS1842856, 10 μM) pretreatment for 24 h. (D) Expression of Eda and Eda2r in Dox-treated (2 µg/mL, 72 h) MEPB-FoxO1 cells with and without NF-κB inhibitor (MG132, 20 μM) pretreatment for 6 h. *P < 0.05. n = 3. All data were representative of three independent experiments. See also Supplementary Fig. S5.
Figure 6
Figure 6
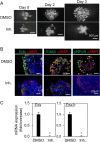
Inhibition of FoxO1 inhibited development of the primitive epithelium of SMG ex vivo. Epithelia of SMG rudiments on E14.5 (n = 4), were mounted in Matrigel drops and cultured in the presence of FGF1 and FGF7 with and without FoxO1 inhibitor (Inh.; AS1842856, 10 μM) for 3 days. (A) Phase contrast images. Bar = 500 μm. (B) The image of immnofluorescent of αSMA, Eda, Eda2r, and phospho-NF-κB after 3 days of culture. Nuclei were stained with DAPI. Bar = 20 μm. (C) Expression of Eda and Eda2r after 3 days of culture. *P < 0.05. All data were representative of three independent experiments. See also Supplementary Figs. S6 and S7.
Figure 7
Figure 7
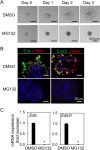
NF-κB was essential for developing the primitive epithelium of SMG with Eda/Eda2r expression ex vivo. Epithelia of SMG rudiments on E14.5 (n = 4) were mounted in Matrigel drops and cultured in the presence of FGF1 and FGF7 with and without NF-κB inhibitor (MG132, 20 μM) for 3 days. (A) Phase contrast image. Bar = 500 μm. (B) IF of αSMA, Eda, and Eda2r after 3 days of culture. Nuclei were stained with DAPI. Bar = 20 μm. (C) Expression of Eda and Eda2r after 3 days of culture. *P < 0.05. All data were representative of three independent experiments.

Similar articles

References

    1. Makarenkova HP, Dartt DA. Myoepithelial cells: Their origin and function in lacrimal gland morphogenesis, homeostasis, and repair. Curr. Mol. Biol. Rep. 2015;1:115–123. doi: 10.1007/s40610-015-0020-4. - DOI - PMC - PubMed
    1. Mattingly A, Finley JK, Knox SM. Salivary gland development and disease. Wiley Interdiscip. Rev. Dev. Biol. 2015;4:573–590. doi: 10.1002/wdev.194. - DOI - PMC - PubMed
    1. Emmerson E, Knox SM. Salivary gland stem cells: A review of development, regeneration and cancer. Genesis. 2018;56:e23211. doi: 10.1002/dvg.23211. - DOI - PMC - PubMed
    1. Giraddi RR, et al. Single-cell transcriptomes distinguish stem cell state changes and lineage specification programs in early mammary gland development. Cell Rep. 2018;24:1653–1666. doi: 10.1016/j.celrep.2018.07.025. - DOI - PMC - PubMed
    1. Ninche N, Kwak M, Ghazizadeh S. Diverse epithelial cell populations contribute to the regeneration of secretory units in injured salivary glands. Development. 2020;147:807. doi: 10.1242/dev.192807. - DOI - PMC - PubMed

MeSH terms