

Multimodal digital phenotyping of diet, physical activity, and glycemia in Hispanic/Latino adults with or at risk of type 2 diabetes
- PMID: 38212415
- PMCID: PMC10784546
- DOI: 10.1038/s41746-023-00985-7
Multimodal digital phenotyping of diet, physical activity, and glycemia in Hispanic/Latino adults with or at risk of type 2 diabetes
Abstract
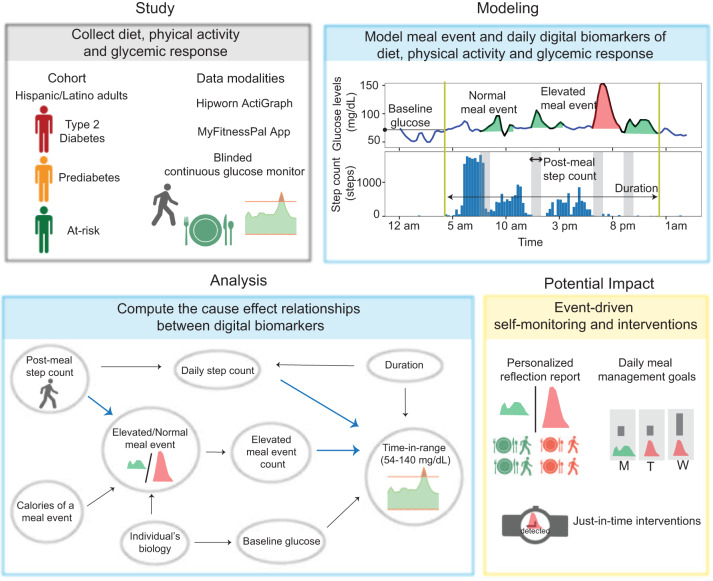
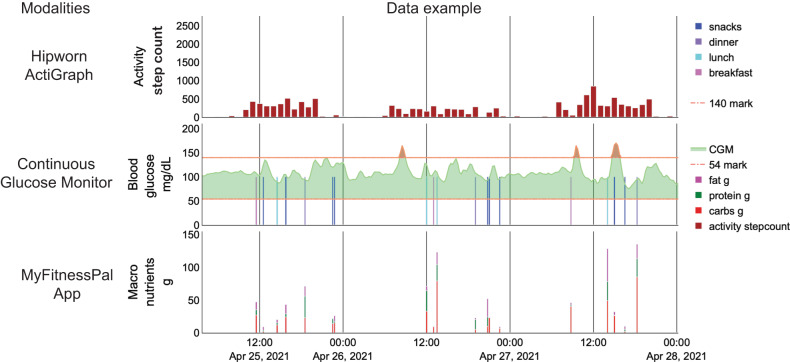
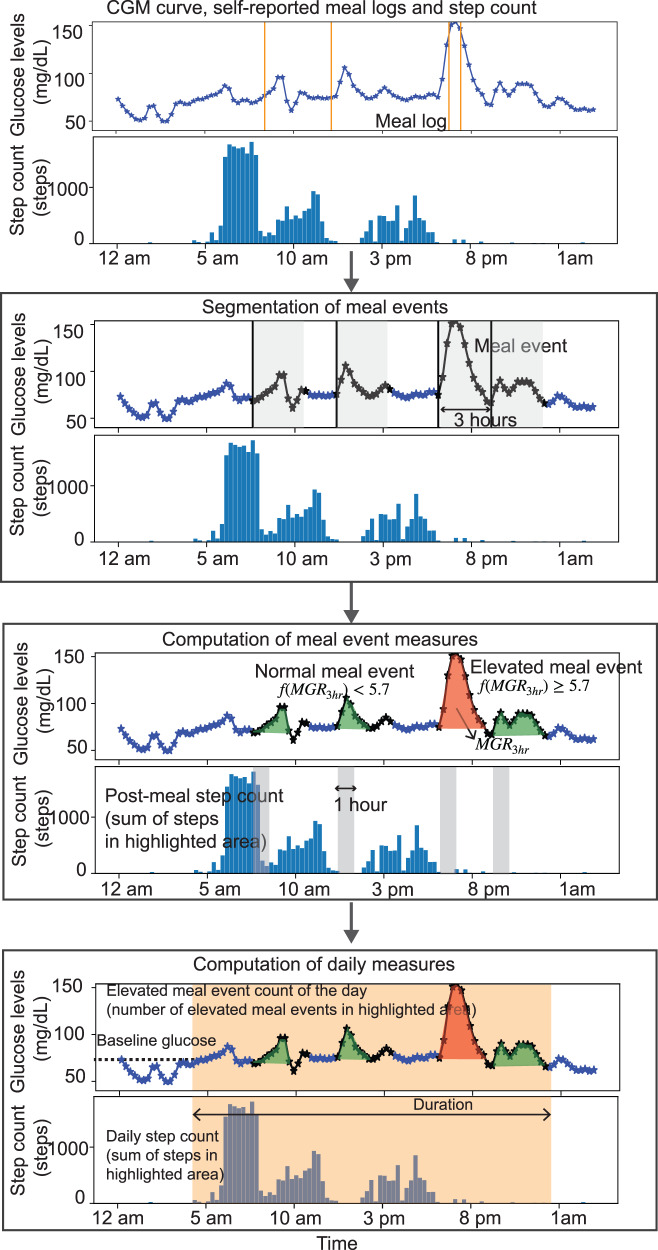
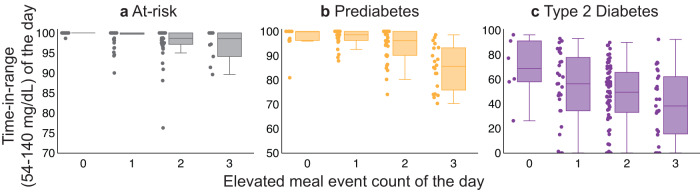
Digital phenotyping refers to characterizing human bio-behavior through wearables, personal devices, and digital health technologies. Digital phenotyping in populations facing a disproportionate burden of type 2 diabetes (T2D) and health disparities continues to lag compared to other populations. Here, we report our study demonstrating the application of multimodal digital phenotyping, i.e., the simultaneous use of CGM, physical activity monitors, and meal tracking in Hispanic/Latino individuals with or at risk of T2D. For 14 days, 36 Hispanic/Latino adults (28 female, 14 with non-insulin treated T2D) wore a continuous glucose monitor (CGM) and a physical activity monitor (Actigraph) while simultaneously logging meals using the MyFitnessPal app. We model meal events and daily digital biomarkers representing diet, physical activity choices, and corresponding glycemic response. We develop a digital biomarker for meal events that differentiates meal events into normal and elevated categories. We examine the contribution of daily digital biomarkers of elevated meal event count and step count on daily time-in-range 54-140 mg/dL (TIR54-140) and average glucose. After adjusting for step count, a change in elevated meal event count from zero to two decreases TIR54-140 by 4.0% (p = 0.003). An increase in 1000 steps in post-meal step count also reduces the meal event glucose response by 641 min mg/dL (p = 0.0006) and reduces the odds of an elevated meal event by 55% (p < 0.0001). The proposed meal event digital biomarkers may provide an opportunity for non-pharmacologic interventions for Hispanic/Latino adults facing a disproportionate burden of T2D.
© 2024. The Author(s).
Conflict of interest statement
A.P., R.S., N.G., A.L., W.B., S.B., and A.S. declare no competing interest(s). D.K. has received research support from Abbott Diabetes Care and Novo Nordisk and is an advisor to Sanofi, Glooko, SNAQ, and Hi.Health.
Figures
Similar articles
-
The northeast glucose drift: Stratification of post-breakfast dysglycemia among predominantly Hispanic/Latino adults at-risk or with type 2 diabetes.EClinicalMedicine. 2021 Dec 20;43:101241. doi: 10.1016/j.eclinm.2021.101241. eCollection 2022 Jan. EClinicalMedicine. 2021. PMID: 34988413 Free PMC article.
-
An Evaluation of Digital Health Tools for Diabetes Self-Management in Hispanic Adults: Exploratory Study.JMIR Diabetes. 2019 Jul 16;4(3):e12936. doi: 10.2196/12936. JMIR Diabetes. 2019. PMID: 31313657 Free PMC article.
-
Improvement in Glucose Regulation Using a Digital Tracker and Continuous Glucose Monitoring in Healthy Adults and Those with Type 2 Diabetes.Diabetes Ther. 2021 Jul;12(7):1871-1886. doi: 10.1007/s13300-021-01081-3. Epub 2021 May 28. Diabetes Ther. 2021. PMID: 34047962 Free PMC article.
-
Rapid-Acting Insulin Analogues Versus Regular Human Insulin: A Meta-Analysis of Effects on Glycemic Control in Patients with Diabetes.Diabetes Ther. 2020 Mar;11(3):573-584. doi: 10.1007/s13300-019-00732-w. Epub 2019 Dec 23. Diabetes Ther. 2020. PMID: 31873857 Free PMC article. Review.
-
Leveraging advances in diabetes technologies in primary care: a narrative review.Ann Med. 2021 Dec;53(1):805-816. doi: 10.1080/07853890.2021.1931427. Ann Med. 2021. PMID: 34184589 Free PMC article. Review.
Cited by
-
"Anything that would help is a positive development": feasibility, tolerability, and user experience of smartphone-based digital phenotyping for people with and without type 2 diabetes.BMC Digit Health. 2024;2(1):55. doi: 10.1186/s44247-024-00116-6. Epub 2024 Sep 12. BMC Digit Health. 2024. PMID: 39282098 Free PMC article.
-
Estimating Breakfast Characteristics Using Continuous Glucose Monitoring and Machine Learning in Adults With or at Risk of Type 2 Diabetes.J Diabetes Sci Technol. 2024 Sep 23:19322968241274800. doi: 10.1177/19322968241274800. Online ahead of print. J Diabetes Sci Technol. 2024. PMID: 39311452 Free PMC article.
-
Technology and health inequities in diabetes care: How do we widen access to underserved populations and utilize technology to improve outcomes for all?Diabetes Obes Metab. 2024 Mar;26 Suppl 1(Suppl 1):3-13. doi: 10.1111/dom.15470. Epub 2024 Jan 31. Diabetes Obes Metab. 2024. PMID: 38291977 Free PMC article.
References
LinkOut - more resources
Full Text Sources
