. 2024 Jan 11;22(1):e3002475.
doi: 10.1371/journal.pbio.3002475. eCollection 2024 Jan.

Neuronal tuning to threat exposure remains stable in the mouse prefrontal cortex over multiple days

Affiliations

Neuronal tuning to threat exposure remains stable in the mouse prefrontal cortex over multiple days

Ole Christian Sylte et al. PLoS Biol. .

Abstract

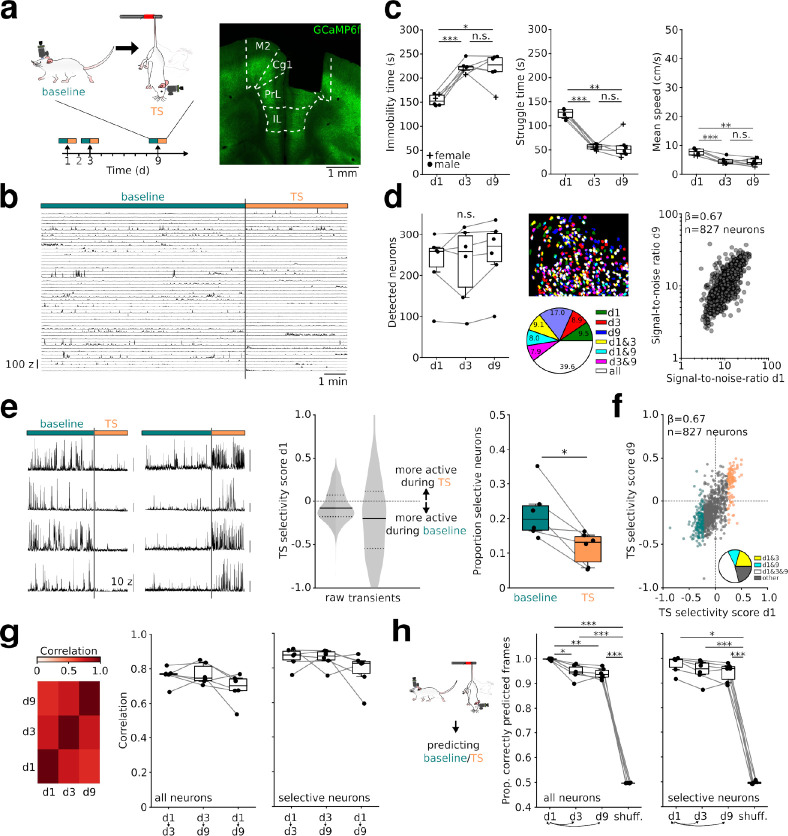
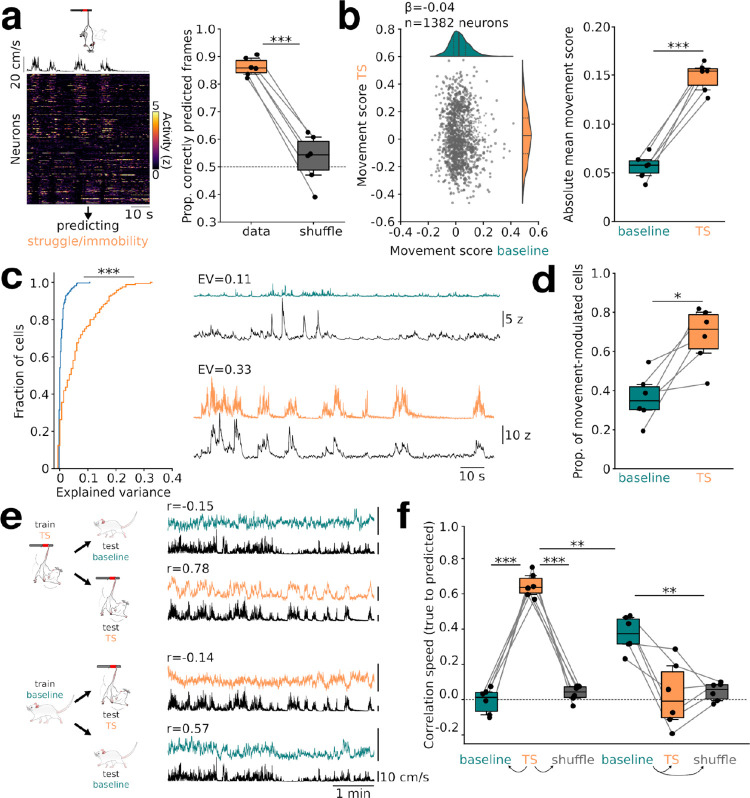
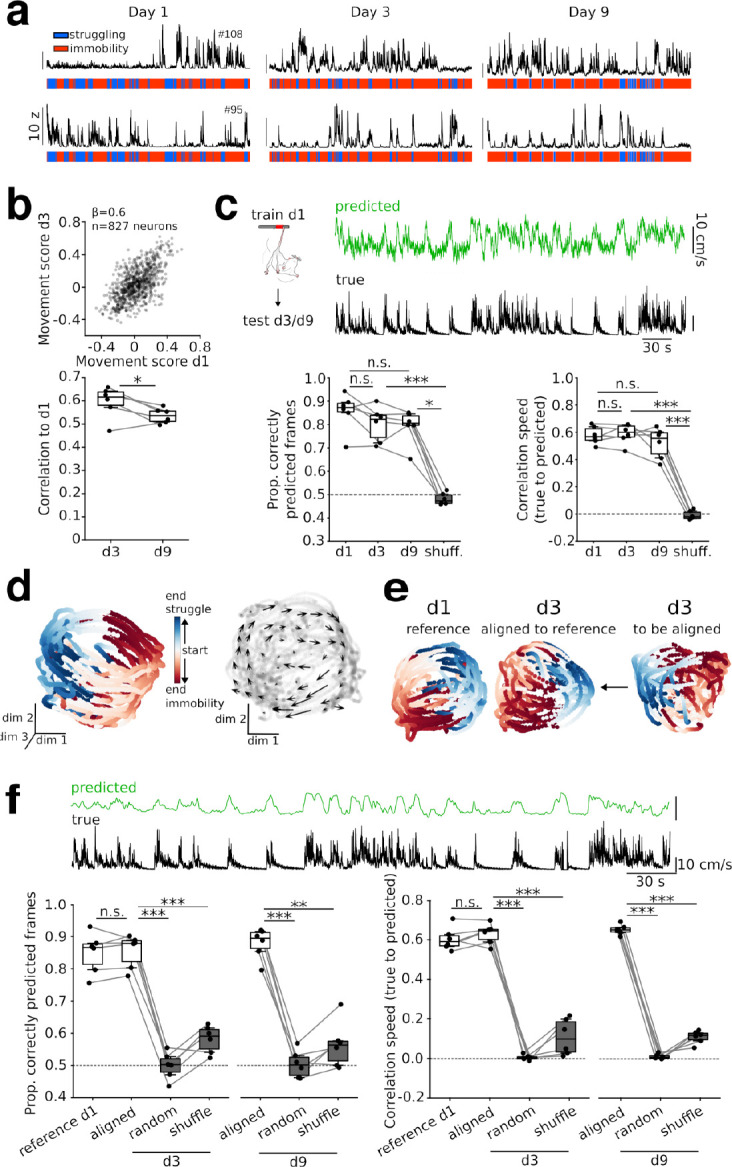
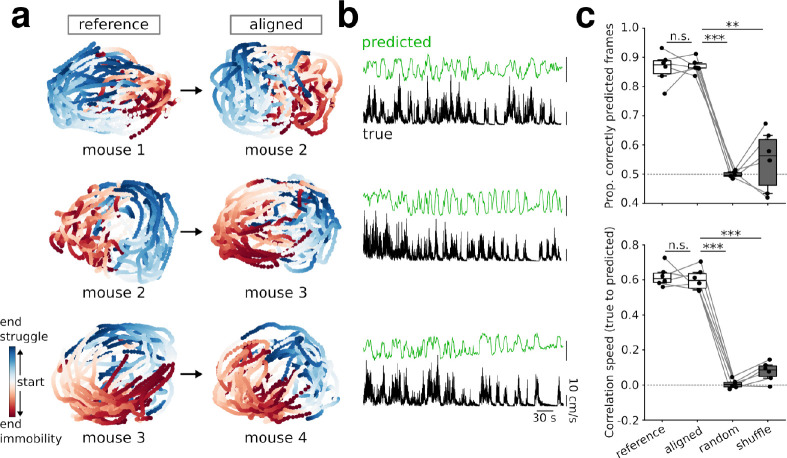
Intense threat elicits action in the form of active and passive coping. The medial prefrontal cortex (mPFC) executes top-level control over the selection of threat coping strategies, but the dynamics of mPFC activity upon continuing threat encounters remain unexplored. Here, we used 1-photon calcium imaging in mice to probe the activity of prefrontal pyramidal cells during repeated exposure to intense threat in a tail suspension (TS) paradigm. A subset of prefrontal neurons displayed selective activation during TS, which was stably maintained over days. During threat, neurons showed specific tuning to active or passive coping. These responses were unrelated to general motion tuning and persisted over days. Moreover, the neural manifold traversed by low-dimensional population activity remained stable over subsequent days of TS exposure and was preserved across individuals. These data thus reveal a specific, temporally, and interindividually conserved repertoire of prefrontal tuning to behavioral responses under threat.


Conflict of interest statement

The authors have declared that no competing interests exist.

Figures

Fig 1
Fig 1. Stable activity of prefrontal neurons upon repeated TS exposure.
(a) Schematic of 1-photon recording from mPFC pyramidal neurons during TS. A sequence of baseline and TS was recorded on 3 days (d1, d3, and d9). Right: Example of lens location in the mPFC. M2: secondary motor cortex, Cg1: cingulate cortex, PrL: prelimbic cortex, IL: infralimbic cortex. GCaMP6f (green) is predominantly expressed in deep layer pyramidal cells. (b) Z-scored calcium activity of 50 randomly selected neurons of one mouse during baseline and TS on d1. (c) Time-dependent changes in TS behavior. Compared to d1, the animals spent more time during passive coping on d3 (immobility time: t = 10.93, p = 0.0003, struggle time: t = 15.81, p = 5 * 10−5, mean speed: t = 9.8, p = 0.0006) and d9 (immobility time: t = 4.32, p = 0.023, struggle time: t = 5.4, p = 0.009, mean speed: t = 5.65, p = 0.007). The coping responses did not differ between d3 and d9 (immobility time: t = 0.31, p = 1, struggle time: t = 0.1, p = 1, mean speed: t = 0.79, p = 1). (d) Left: Comparable numbers of neurons are detected per mouse across imaging days (F = 1.87, p = 0.2). Middle: example field of view from multisession alignment with cells active on single or multiple days color-coded. Right: signal-to-noise ratio of neurons from all mice found active on all days (termed “repeatedly identified neurons”) remain correlated on d1 and d9, β = 0.67 ± 0.06, p < .001, linear mixed effects model (LME). (e) Left: Examples of baseline- and TS-selective neurons. Middle: TS selectivity score computed with raw signals and transient rates (−1: active only during baseline; 1: active only during TS) on d1 for all 1,382 neurons. Solid lines show median, dashed lines the first and third quartiles. Right: proportion of neurons with TS selectivity score <−0.2 (“baseline selective”) and >0.2 (“TS selective,” based on raw signals). More neurons were found to be baseline selective. t = 3.22, p = 0.02, paired t test, n = 6 mice. (f) Correlation of TS selectivity score of all repeatedly identified neurons on d1 and d9. β = 0.67 ± 0.09, p < .001, LME. Color code as in (e). Inset: Proportion of neurons scored as selective on day 1 that also remained selective on days 3, 9, or both. (g) Summary of correlation of TS selectivity scores across days (mouse averages) for all neurons (F = 3.22, p = 0.083) and for selective neurons only (F = 2.33, p = 0.148). (h) Prediction of baseline and TS state on a frame-by-frame basis with models trained exclusively on calcium data of d1. Accuracy across days was lower compared to within-d1 (d3: t = 4.61, p = 0.029, d9: t = 7, p = 0.005) but above chance level (vs. shuffled: d1: t = 188.76, p = 10−9, d3: t = 36.27, p = 10−6, d9: t = 51.69, p = 10−7). Chance level was determined by running the analysis with randomly time-shifted calcium traces. Similar results were obtained for models trained on selective neurons only (d1 vs. d3: z = 1.6, p = 0.547, d1 vs. d9: z = 1.6, p = 0.547, d1 vs. shuffle: z = 2.88, p = 0.02, d3 vs. shuffle: t = 23.14, p = 10−5, d9 vs. shuffle: t = 27.44, p = 6 * 10−6). (c, d, g, h): One-way repeated measures ANOVAs followed by paired t tests or Wilcoxon rank sum tests with Bonferroni correction, n = 6 mice. *p < 0.05, **p < 0.01, ***p < 0.001. The data underlying this figure can be found at https://doi.org/10.5281/zenodo.10378756.
Fig 2
Fig 2. Rate coding of passive and active coping responses.
(a) Decoding of TS struggle/immobility from calcium data. Left: Simultaneously recorded neurons (n = 301) in one mouse during the first day of TS exposure (sorted by their correlation to TS movement) along with movement speed (top). Right: Results of decoding with real vs. surrogate data created by randomly shifting calcium traces in time (t = 11.26, p = 9 * 10−5, paired t test, n = 6 mice). (b) Correlation of d1 movement scores during TS and baseline (i.e., standardized β-coefficient between the animal’s speed and each neuron’s calcium trace). Distributions of baseline and TS movement scores are shown on the top and side, respectively. Solid lines show the median, dashed lines the first and third quartiles. β = −0.04 ± 0.05, p = 0.423, LME. Right: Stronger movement tuning during TS as quantified from the average absolute movement score of each mouse. t = −15.0, p = 10−5, paired t test, n = 6 mice. (c) Linear model predicting calcium signals of individual neurons with movement. Left: Summary of explained variance (EV) during baseline (n = 277 cells) and TS (n = 160 cells, U = 9,313, p = 10−24, Mann–Whitney U test). Right: Examples of true (black) and predicted calcium signals (colored) during both states. (d) Proportion of neurons for which calcium activity could be significantly explained by movement alone (t = −3.82, p = 0.012, paired t test). (e) Decoding baseline and TS motion speed with models trained on TS (top) or baseline (bottom) population calcium data. Examples of one mouse are shown with the true speed in black and the predicted speed in color. Pearson’s correlation coefficient for each fit is shown on top. (f) Quantification of the data shown in (e) for all mice. Trained on TS: TS vs. baseline: t = 12.43, p = 0.0004, TS vs. shuffle: t = 13.77, p = 0.0003, baseline vs. shuffle: t = 2.51, p = 0.375. Trained on baseline: baseline vs: TS: t = 3.89, p = 0.08, baseline vs. shuffle: t = 8.28, p = 0.003, TS vs. shuffle: t = 0.26, p = 1.0. Trained on TS predicting TS vs. trained on baseline predicting baseline; t = 8.09, p = 0.0033, one-way repeated measures ANOVA followed by paired t tests with Bonferroni correction. Dashed lines: chance level. n = 6 mice, *p < 0.05, **p < 0.01, ***p < 0.001. The data underlying this figure can be found at https://doi.org/10.5281/zenodo.10378756.
Fig 3
Fig 3. Stable population coding of threat coping responses over time.
(a) Examples of an immobility-active (top) and struggling-active neuron (bottom) over recording days 1, 3, and 9. (b) Top: Correlation of TS movement scores on d1 and d3 (top) and mouse averages of correlations to d1, β = 0.60 ± 0.04, p < .001. Bottom: correlations between days per animal, t = 2.68, p = 0.044, paired t test. (c) Decoding TS behavior on subsequent days using models trained on calcium activity of repeatedly active neurons on d1. Top: example of predicted speed on d3. Bottom: Prediction of struggling/immobility (left, d3: vs. d1: t = 2.07, p = 0.374, vs. shuffle: t = 13.91, p = 10−4, d9: vs. d1: z = 1.92, p = 0.219, vs. shuffle: z = 2.88, p = 0.016) and correlation of speed (d3: vs. d1: t = 0.52, p = 1, vs. shuffle: t = 19.84, p = 2 * 10−5, d9: vs. d1: t = 1.49, p = 0.787, vs. shuffle: t = 14.12, p = 10−4). (d) Example 3-d manifold (left) and corresponding 2-d flow field (right). (e) Example of across-day manifold alignment. Manifolds are constructed using all available neurons of each day. (f) Across-day predictions as in (c) but using aligned manifolds (struggling/immobility: d3: vs. reference: t = 0.55, p = 1, vs. random: t = 21.53, p = 10−5, vs. shuffled: t = 12, p = 2 * 10−4, d9: vs. reference: t = 1.18, p = 0.872, vs. random: t = 18.51, p = 2 * 10−5, vs. shuffle: t = 8.43, p = 0.001; correlation of speed: d3: vs. reference: t = 1.36, p = 0.70, vs. random: t = 28.66, p = 3 * 10−6, vs. shuffle: t = 20.31, p = 2 * 10−5, d9: vs. reference: t = 2.54, p = 0.155, vs. random: t = 52.41, p = 10−7, vs. shuffle: t = 35.24, p = 10−6). (b, e) Dashed lines: chance level. One-way repeated measures ANOVAs followed by paired t tests with Bonferroni correction, n = 6 mice. *p < 0.05, **p < 0.01, ***p < 0.001. The data underlying this figure can be found at https://doi.org/10.5281/zenodo.10378756.
Fig 4
Fig 4. Manifold structure during TS is preserved across individuals.
(a) Examples of manifolds of mice aligned to the orientation of the manifold from another individual. (b) Speed during TS predicted with aligned manifolds trained on the reference subject. Same pairs of mice as shown in (a). (c) Predictions of TS struggling/immobility (vs. reference (i.e., within mice): t = 0.24, p = 1, vs. random: t = 25.83, p = 4 * 10−6, vs shuffle: t = 7.4 p = 0.002) and correlation between predicted and true speed between mice (vs. reference: t = 0.44, p = 1.0, vs. random: t = 27.96, p = 3 * 10−6, vs. shuffle: t = 16.31, p = 4 * 10−5). Dashed lines: chance level. One-way repeated measures ANOVAs followed by paired t tests with Bonferroni correction, n = 6 pairs of mice. ***p < 0.001. The data underlying this figure can be found at https://doi.org/10.5281/zenodo.10378756.

Similar articles

References

    1. Rigotti M., Barak O., Warden M.R., Wang X.-J., Daw N.D., Miller E.K., Fusi S. The importance of mixed selectivity in complex cognitive tasks. Nature (2013). 497, 585–590. doi: 10.1038/nature12160 - DOI - PMC - PubMed
    1. Vogel P., Hahn J., Duvarci S., Sigurdsson T. Prefrontal pyramidal neurons are critical for all phases of working memory. Cell Rep. (2022). 39, 110659. doi: 10.1016/j.celrep.2022.110659 - DOI - PubMed
    1. Malagon-Vina H., Ciocchi S., Passecker J., Dorffner G., Klausberger T. Fluid network dynamics in the prefrontal cortex during multiple strategy switching. Nat Commun. (2018). 9, 309. doi: 10.1038/s41467-017-02764-x - DOI - PMC - PubMed
    1. Bissière S., Plachta N., Hoyer D., McAllister K.H., Olpe H.-R., Grace A.A., Cryan J.F. The Rostral Anterior Cingulate Cortex Modulates the Efficiency of Amygdala-Dependent Fear Learning. Biol Psychiatry (2008). 63, 821–831. doi: 10.1016/j.biopsych.2007.10.022 - DOI - PMC - PubMed
    1. Arruda-Carvalho M., Clem R.L. Pathway-Selective Adjustment of Prefrontal-Amygdala Transmission during Fear Encoding. J Neurosci. (2014). 34, 15601–15609. doi: 10.1523/JNEUROSCI.2664-14.2014 - DOI - PMC - PubMed

Grants and funding

This work was supported by Else Kröner-Fresenius Stiftung (https://www.ekfs.de/, grant 2019_A173 to J.-F.S.), German Research Foundation (Deutsche Forschungsgemeinschaft, https://www.dfg.de/, grant SA3609/1-1 to J.-F.S.), German Research Foundation (Deutsche Forschungsgemeinschaft, https://www.dfg.de/, FOR5159 - TP7 to J.-F.S. (grant SA3609/2-1 to J.-F.S. and grant BA1582/16-1 to M.B.). The funders had no role in study design, data collection and analysis, decision to publish, or preparation of the manuscript.