

Heterogeneity-induced NGF-NGFR communication inefficiency promotes mitotic spindle disorganization in exhausted T cells through PREX1 suppression to impair the anti-tumor immunotherapy with PD-1 mAb in hepatocellular carcinoma
- PMID: 38204220
- PMCID: PMC10905245
- DOI: 10.1002/cam4.6736
Heterogeneity-induced NGF-NGFR communication inefficiency promotes mitotic spindle disorganization in exhausted T cells through PREX1 suppression to impair the anti-tumor immunotherapy with PD-1 mAb in hepatocellular carcinoma
Abstract
Background: The mechanism of decreased T cells infiltrating tumor tissues in hepatocellular carcinoma is poorly understood.
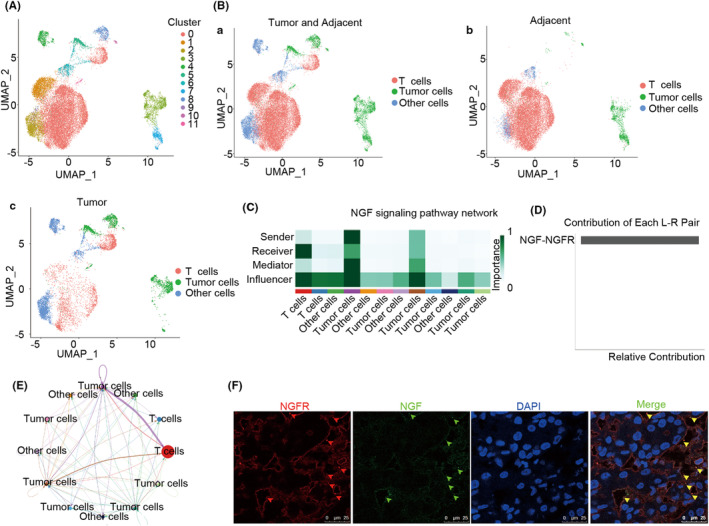
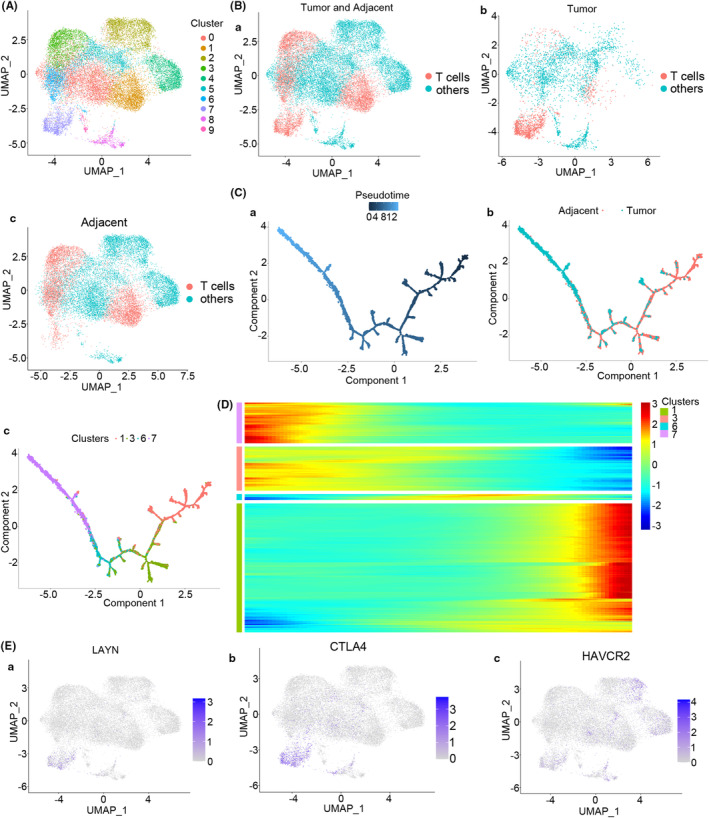
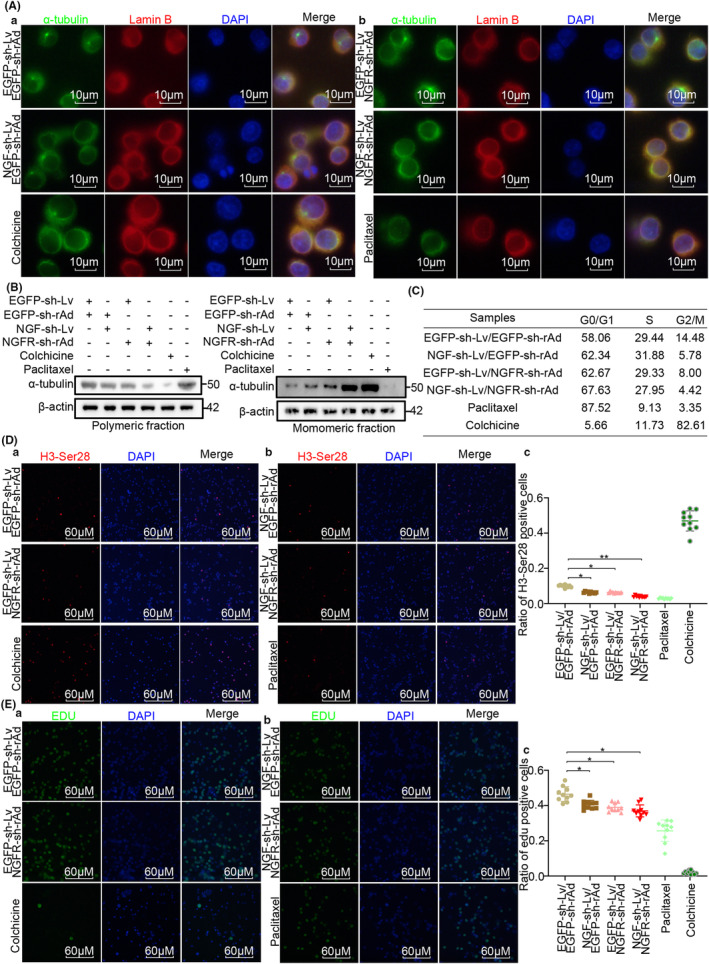
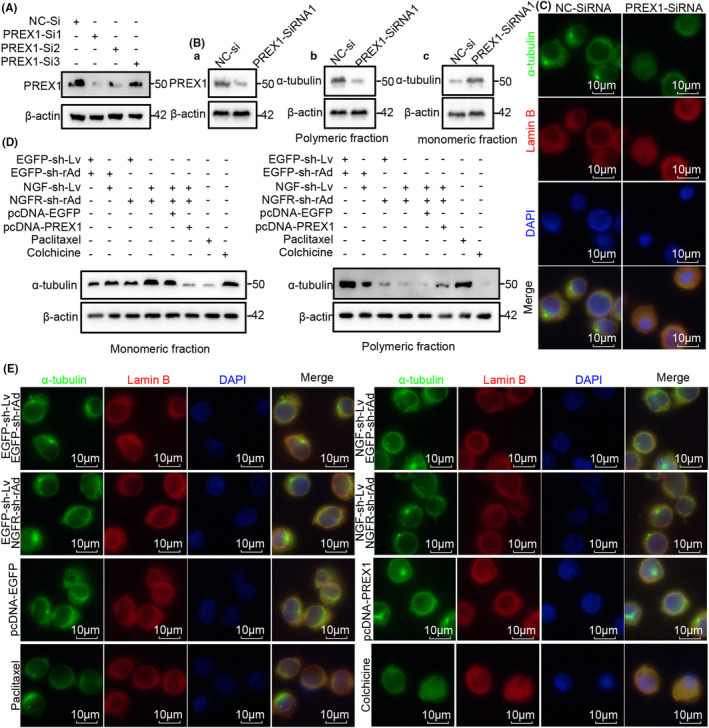
Methods: Cells were separated from the single-cell RNA-sequence dataset of hepatocellular carcinoma patients (GSE149614) for cell-cell communication. Flow cytometry, EDU staining, H3-Ser28 staining, confocal immunofluorescence staining, western blotting and naked microsubcutaneous tumors were performed for the mechanism of NGF-NGFR promoting proliferation.
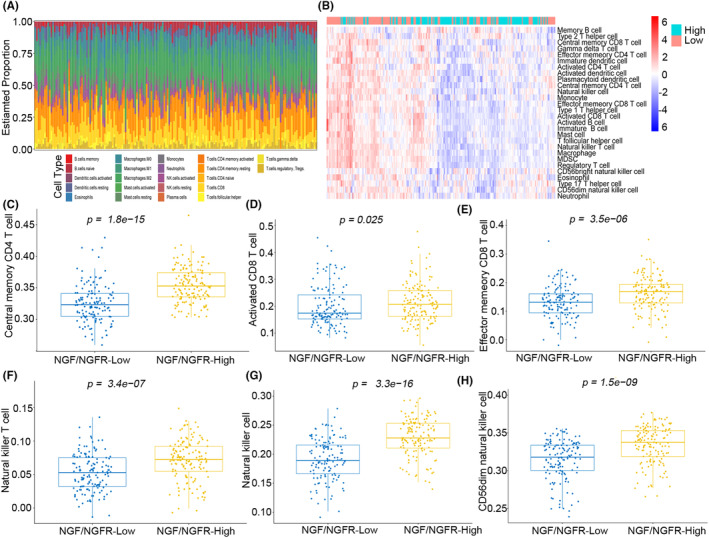
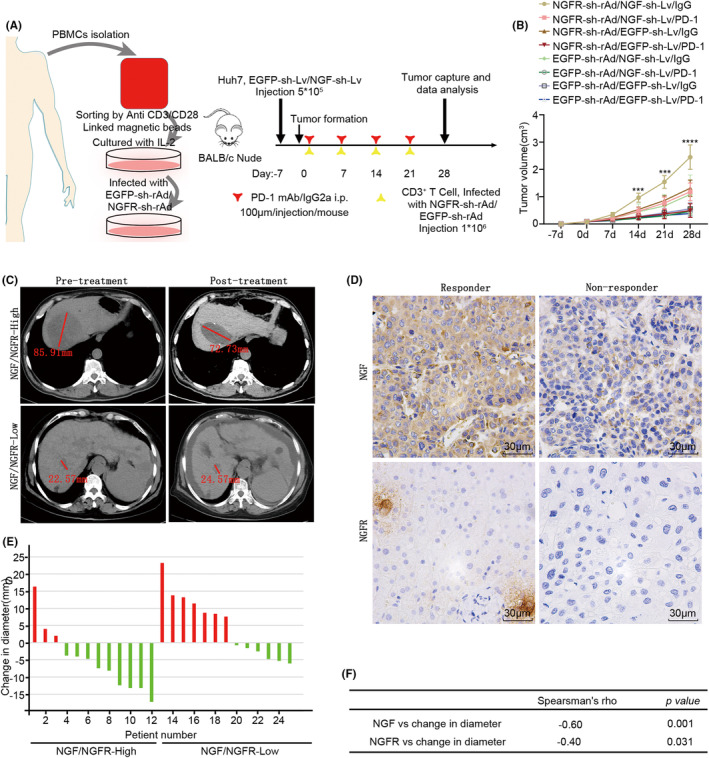
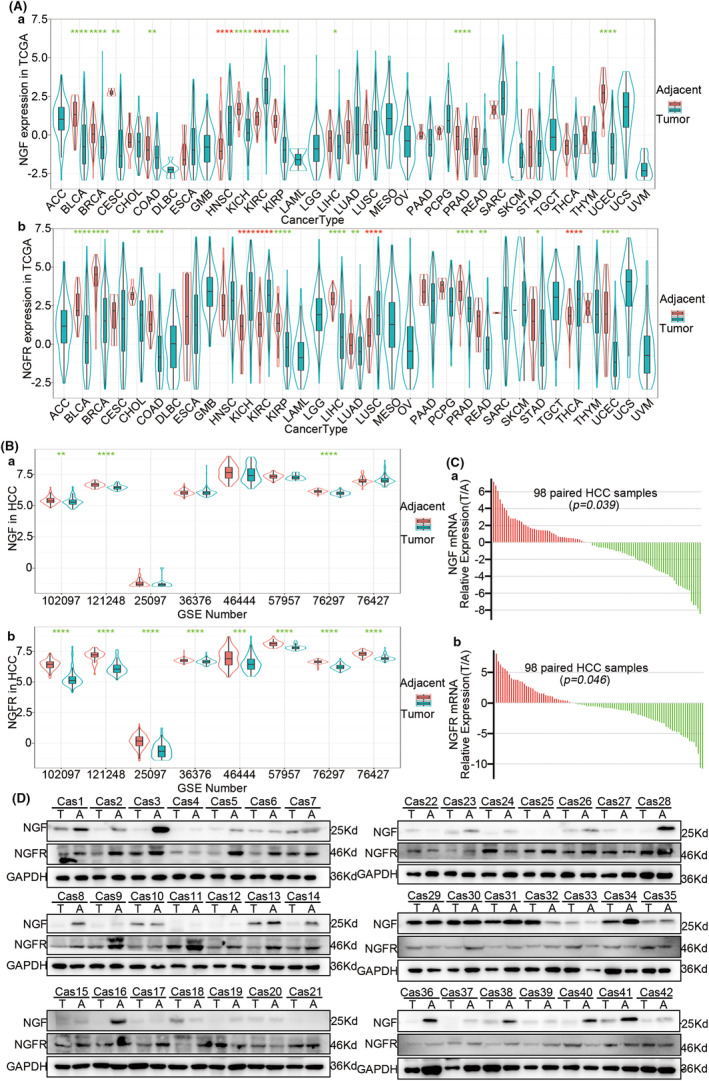
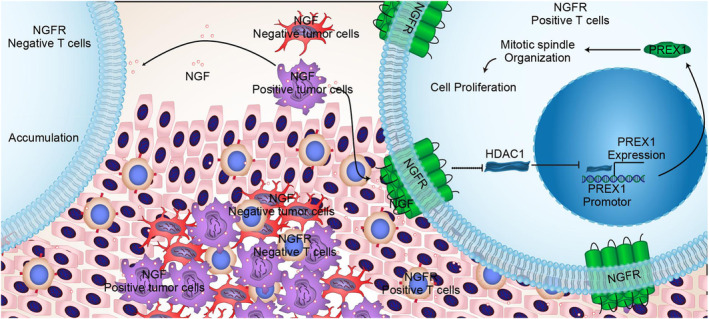
Results: The present study has revealed that during the process of T-cell infiltration from adjacent tissues to tumor tissues, an inefficiency in NGF-NGFR communication occurs in the tumor tissues. Importantly, NGF secreted by tumor cells interacts with NGFR present on the membranes of the infiltrated T cells, thereby promoting the proliferation through the activation of mitotic spindle signals. Mechanistically, the mediation of mitotic spindle signal activation promoting proliferation is executed by HDAC1-mediated inhibition of unclear trans-localization of PREX1. Furthermore, PD-1 mAb acts synergistically with the NGF-NGFR communication to suppress tumor progression in both mouse models and HCC patients. Additionally, NGF-NGFR communication was positively correlates with the PD-1/PDL-1 expression. However, expressions of NGF and NGFR are low in tumor tissues, which is responsible for the invasive clinicopathological features and the disappointing prognosis in HCC patients.
Conclusion: Inefficiency in NGF-NGFR communication impairs PD-1 mAb immunotherapy and could thus be utilized as a novel therapeutic target in the treatment of HCC patients in clinical practice.
Keywords: hepatocellular carcinoma; immunotherapy; nerve growth factor; nerve growth factor receptor; pd-1.
© 2023 The Authors. Cancer Medicine published by John Wiley & Sons Ltd.
Conflict of interest statement
The authors declare that they have no conflict of interest.
Figures

Similar articles
-
Heterogeneity induced GZMA-F2R communication inefficient impairs antitumor immunotherapy of PD-1 mAb through JAK2/STAT1 signal suppression in hepatocellular carcinoma.Cell Death Dis. 2022 Mar 7;13(3):213. doi: 10.1038/s41419-022-04654-7. Cell Death Dis. 2022. PMID: 35256589 Free PMC article.
-
Antibodies Against Immune Checkpoint Molecules Restore Functions of Tumor-Infiltrating T Cells in Hepatocellular Carcinomas.Gastroenterology. 2017 Oct;153(4):1107-1119.e10. doi: 10.1053/j.gastro.2017.06.017. Epub 2017 Jun 23. Gastroenterology. 2017. PMID: 28648905
-
Cancer cell-intrinsic STING is associated with CD8 + T-cell infiltration and might serve as a potential immunotherapeutic target in hepatocellular carcinoma.Clin Transl Oncol. 2021 Jul;23(7):1314-1324. doi: 10.1007/s12094-020-02519-z. Epub 2021 Jan 27. Clin Transl Oncol. 2021. PMID: 33502741
-
Anti-PD-1/PD-L1 Blockade Immunotherapy Employed in Treating Hepatitis B Virus Infection-Related Advanced Hepatocellular Carcinoma: A Literature Review.Front Immunol. 2020 May 28;11:1037. doi: 10.3389/fimmu.2020.01037. eCollection 2020. Front Immunol. 2020. PMID: 32547550 Free PMC article. Review.
-
Navigating through the PD-1/PDL-1 Landscape: A Systematic Review and Meta-Analysis of Clinical Outcomes in Hepatocellular Carcinoma and Their Influence on Immunotherapy and Tumor Microenvironment.Int J Mol Sci. 2023 Mar 30;24(7):6495. doi: 10.3390/ijms24076495. Int J Mol Sci. 2023. PMID: 37047482 Free PMC article. Review.
Cited by
-
Recent advancements in improving the efficacy and safety of chimeric antigen receptor (CAR)-T cell therapy for hepatocellular carcinoma.Naunyn Schmiedebergs Arch Pharmacol. 2024 Sep 24. doi: 10.1007/s00210-024-03443-7. Online ahead of print. Naunyn Schmiedebergs Arch Pharmacol. 2024. PMID: 39316087 Review.
-
1,4-Diol Hq (TBHQ) vs 1,4-dithiol (TBDT); simulation of safe antioxidant with a lower carcinogenic activity.Sci Prog. 2024 Jul-Sep;107(3):368504241280869. doi: 10.1177/00368504241280869. Sci Prog. 2024. PMID: 39314158 Free PMC article.
-
Role of LMO7 in cancer (Review).Oncol Rep. 2024 Sep;52(3):117. doi: 10.3892/or.2024.8776. Epub 2024 Jul 12. Oncol Rep. 2024. PMID: 38994754 Free PMC article. Review.
-
Robust detection of infectious disease, autoimmunity, and cancer from the paratope networks of adaptive immune receptors.Brief Bioinform. 2024 Jul 25;25(5):bbae431. doi: 10.1093/bib/bbae431. Brief Bioinform. 2024. PMID: 39226888 Free PMC article.
-
The Crosstalk between Nerves and Cancer-A Poorly Understood Phenomenon and New Possibilities.Cancers (Basel). 2024 May 15;16(10):1875. doi: 10.3390/cancers16101875. Cancers (Basel). 2024. PMID: 38791953 Free PMC article. Review.
References
MeSH terms
Substances
Grants and funding
- KZ202010025037/Beijing Municipal Natural Science Foundation and Beijing Municipal Education Commission
- 2020M672003/China Postdoctoral Science Foundation
- 2022T150341/China Postdoctoral Science Foundation
- 82272973/National Natural Science Foundation of China
- 81900575/National Natural Science Foundation of China
LinkOut - more resources
Full Text Sources
Medical
Miscellaneous
