. 2023 Dec 23;25(1):254.
doi: 10.3390/ijms25010254.

Palmitate Stimulates Expression of the von Willebrand Factor and Modulates Toll-like Receptors Level and Activity in Human Umbilical Vein Endothelial Cells (HUVECs)

Affiliations

Palmitate Stimulates Expression of the von Willebrand Factor and Modulates Toll-like Receptors Level and Activity in Human Umbilical Vein Endothelial Cells (HUVECs)

Agnieszka K Seliga et al. Int J Mol Sci. .

Abstract

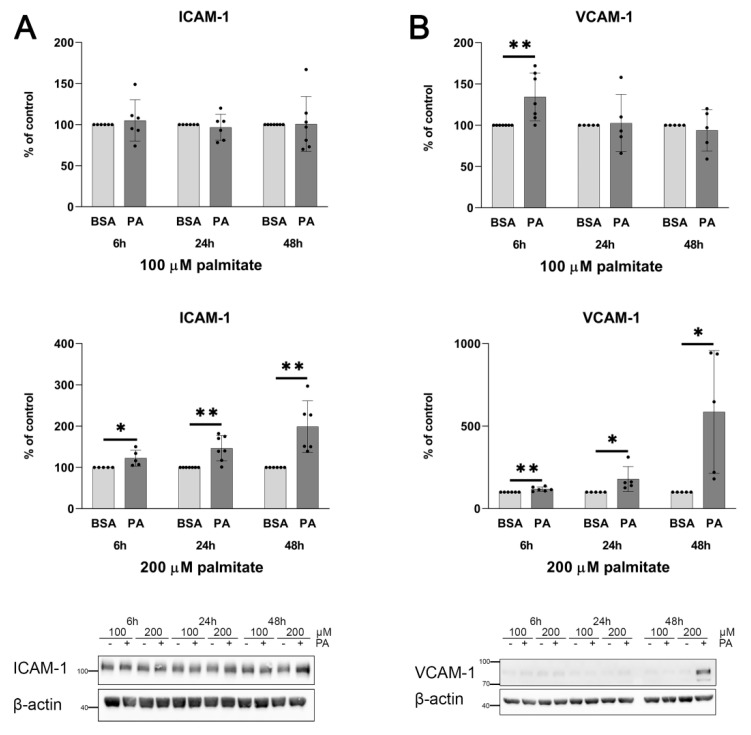
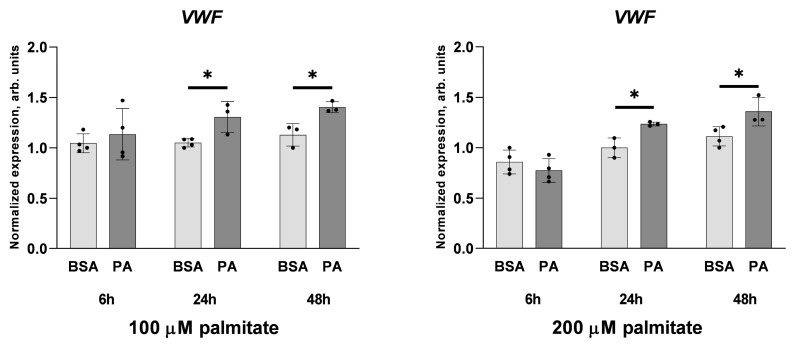
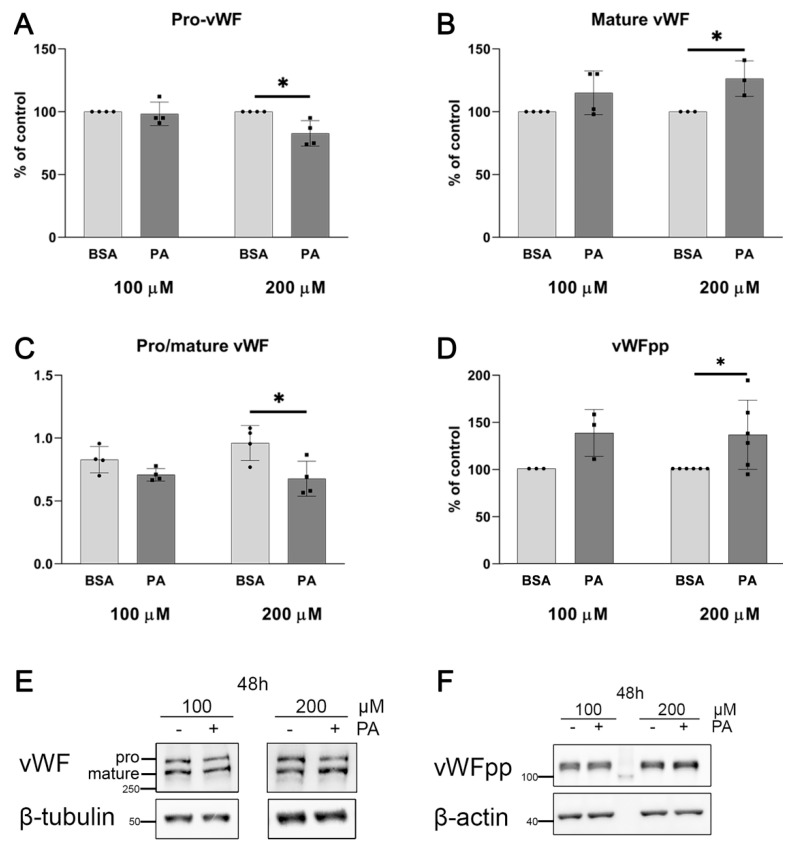
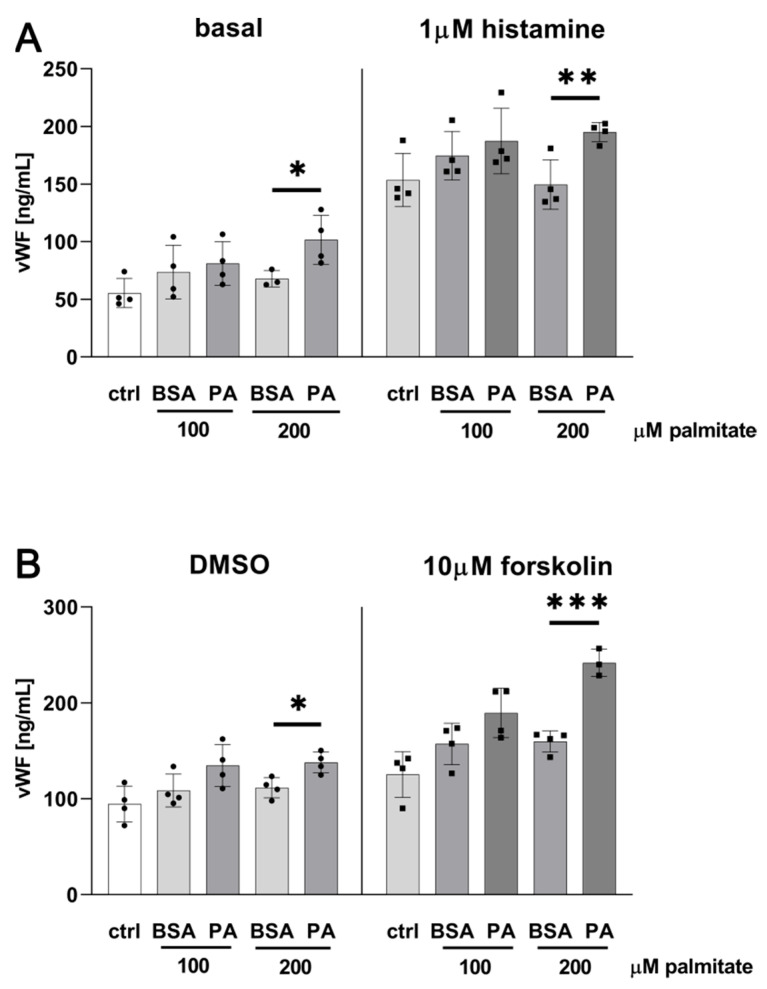
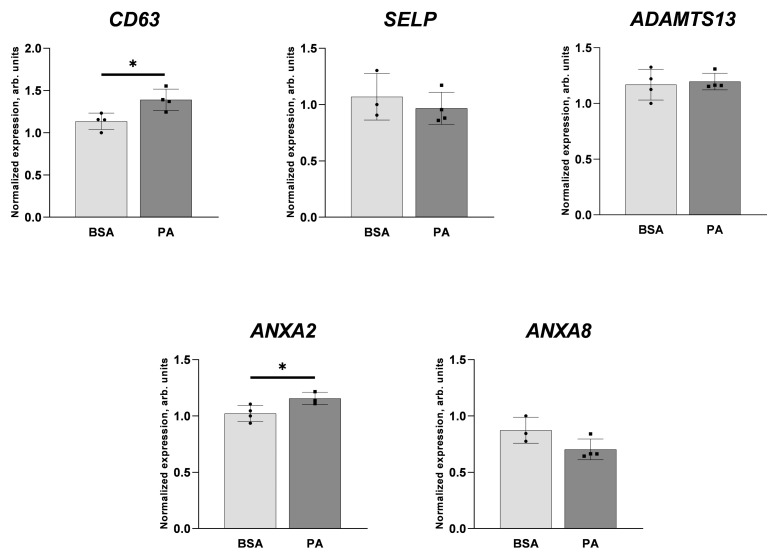
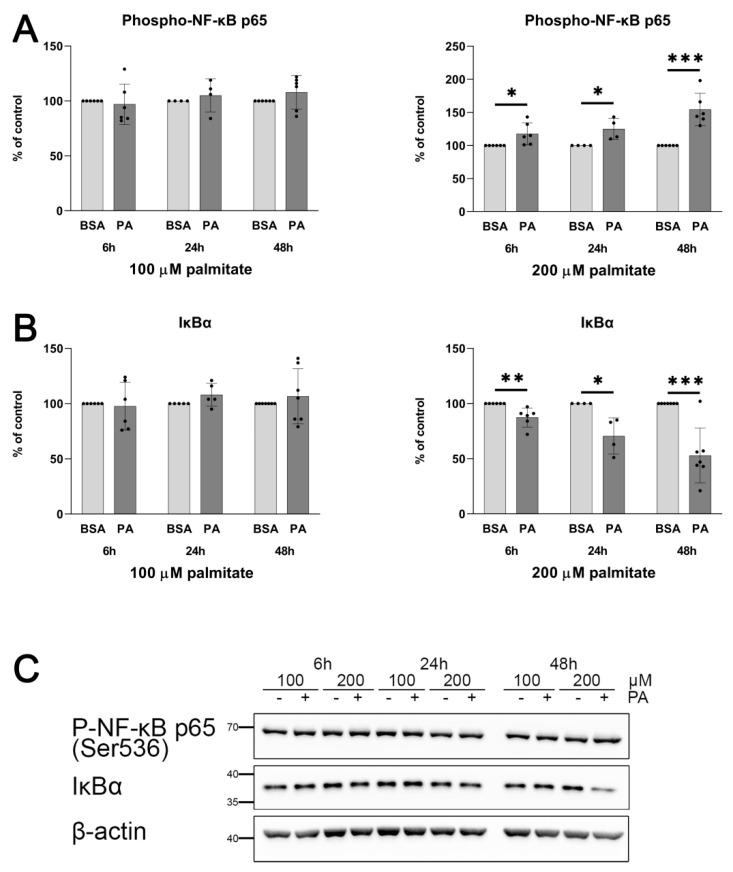
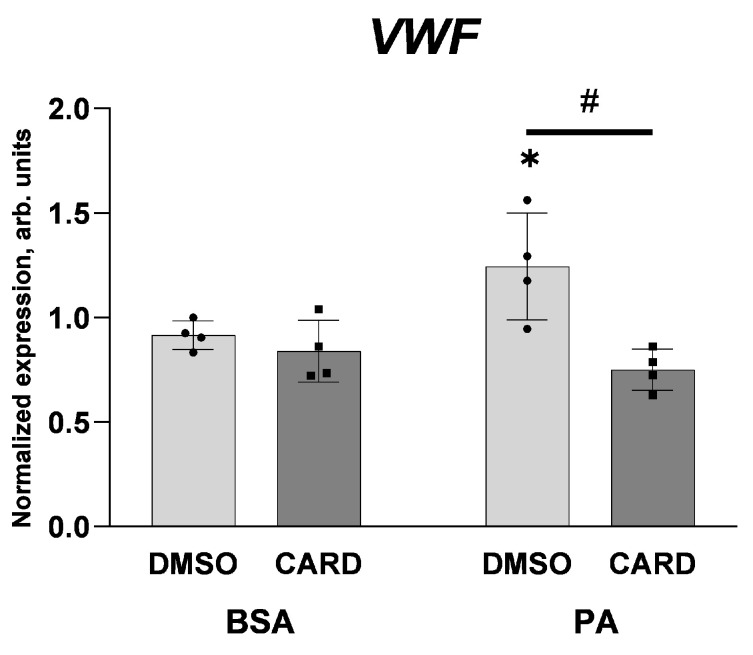
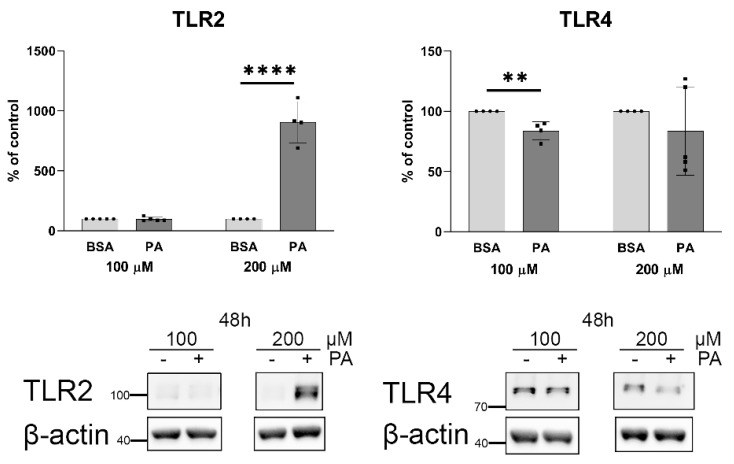
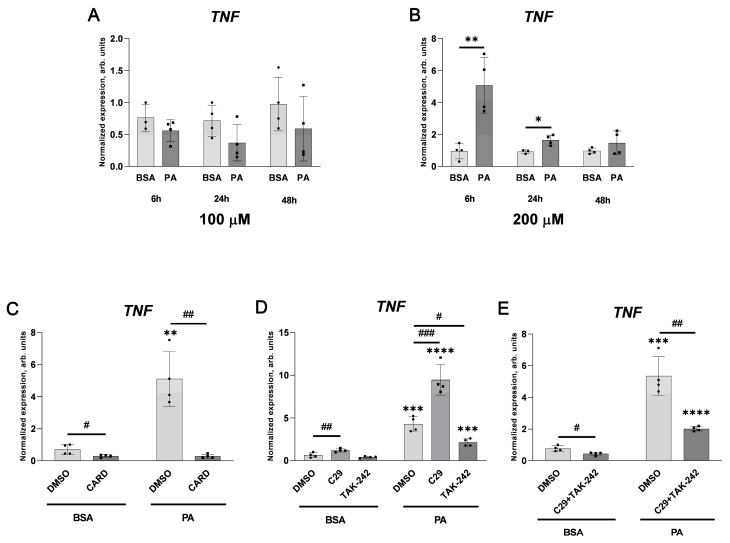
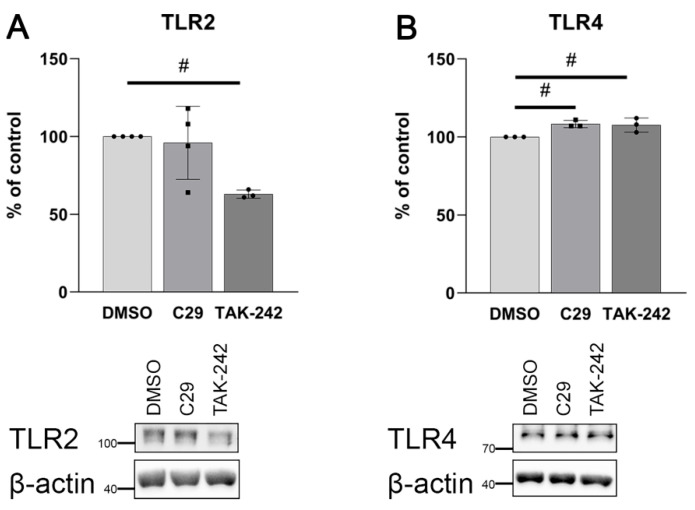
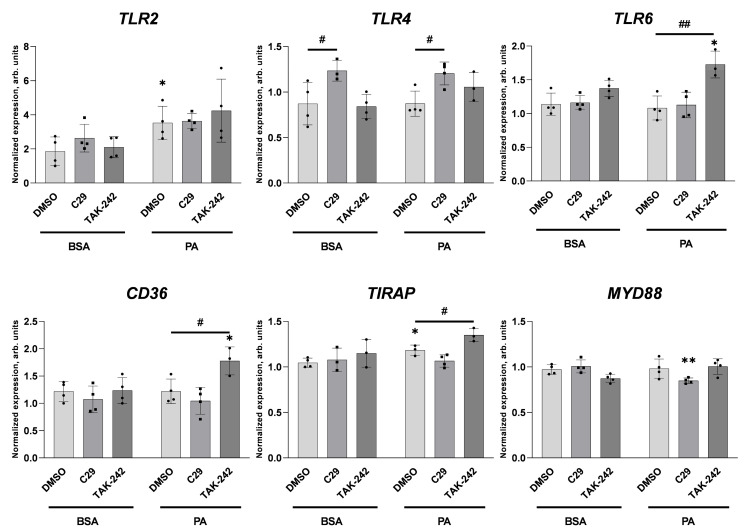
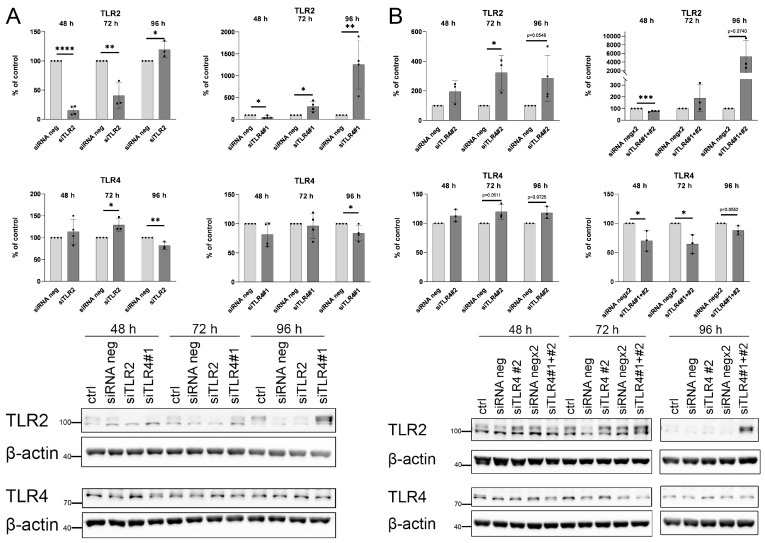
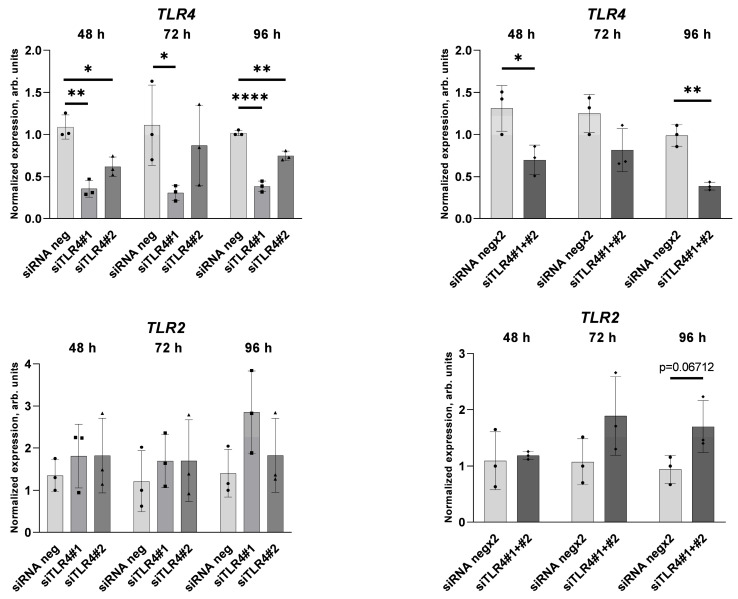
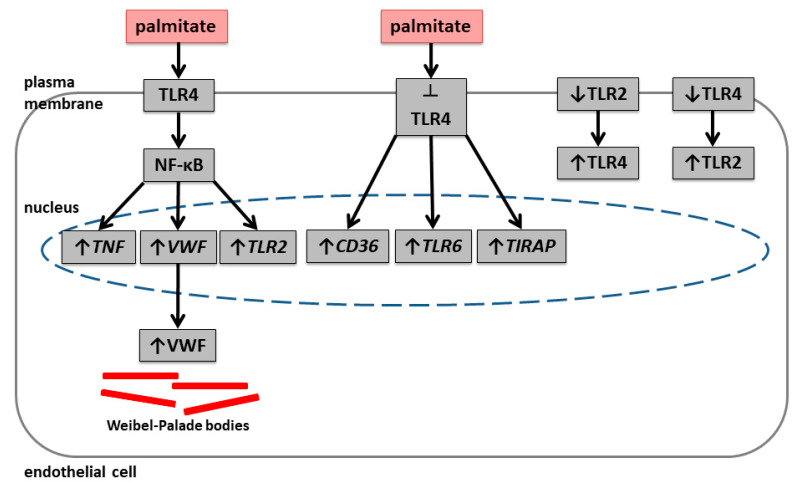
An increased concentration of palmitate in circulation is one of the most harmful factors in obesity. The von Willebrand factor (vWF), a protein involved in haemostasis, is produced and secreted by the vascular endothelium. An increased level of vWF in obese patients is associated with thrombosis and cardiovascular disease. The aim of this study was to investigate a palmitate effect on vWF in endothelial cells and understand the mechanisms of palmitate-activated signalling. Human umbilical vein endothelial cells (HUVECs) incubated in the presence of palmitate, exhibited an increased VWF gene expression, vWF protein maturation, and stimulated vWF secretion. Cardamonin, a Nuclear Factor kappa B (NF-κB) inhibitor, abolished the palmitate effect on VWF expression. The inhibition of Toll-like receptor (TLR) 2 with C29 resulted in the TLR4 overactivation in palmitate-treated cells. Palmitate, in the presence of TLR4 inhibitor TAK-242, leads to a higher expression of TLR6, CD36, and TIRAP. The silencing of TLR4 resulted in an increase in TLR2 level and vice versa. The obtained results indicate a potential mechanism of obesity-induced thrombotic complication caused by fatty acid activation of NF-κB signalling and vWF upregulation and help to identify various compensatory mechanisms related to TLR4 signal transduction.

Keywords: NF-κB; TLR2; TLR4; endothelium; palmitate; von Willebrand factor.


Conflict of interest statement

The authors declare no conflicts of interest.

Figures

Figure 1
Figure 1
Effect of palmitate on ICAM-1 or VCAM-1 relative protein levels. Quantitative analysis and representative Western blots of (A) ICAM-1 and (B) VCAM-1. Relative protein expression normalised to β-actin and compared to BSA treated as a control. Data are expressed as a percentage of appropriate BSA control and presented as mean ± SD (n = 5–7); * p ≤ 0.05, ** p ≤ 0.01.
Figure 2
Figure 2
Effect of palmitate on HUVECs’ viability. Flow cytometric analysis of apoptosis with PE Annexin V and 7-AAD staining. HUVECs were treated 48 h with 200 μM palmitate or BSA as a control. (A) Representative histogram of flow cytometric analysis. Q1, dead cells; Q2, late apoptotic cells; Q3, viable cells; Q4, early apoptotic cells. (B) Quantitative analysis. Data are presented as mean value of a percentage of gated cells ± SD (n = 4). Cells were treated for 24 or 48 h with 10 ng/mL TNF-α as a control of apoptosis induction.
Figure 3
Figure 3
Effect of palmitate on VWF gene expression. Relative VWF gene expression after incubation with 100 or 200 μM palmitate, respectively, for the indicated time. Data analysed via the 2−ΔΔCT method are presented as mean ± SD (n = 3–4); * p ≤ 0.05.
Figure 4
Figure 4
Effect of palmitate on relative von Willebrand factor (vWF) protein level. Quantitative analysis of relative protein expression: (A) pro-vWF; (B) mature vWF; (C) ratio of pro-vWF to mature vWF; (D) vWFpp normalised to β-actin or β-tubulin and compared to BSA treated as a control. Data are expressed as a percentage of appropriate BSA control and presented as mean ± SD (n = 3–6); * p ≤ 0.05. Representative Western blots of (E) pro- and mature vWF and (F) vWFpp.
Figure 5
Figure 5
Secretion of von Willebrand factor. HUVECs incubated 48 h in the presence of 100 or 200 μM palmitate were stimulated with (A) 1 μM histamine or (B) 10 μM forskolin (DMSO as control). Basal or stimulated vWF secretion was measured via ELISA. Data are presented as mean ± SD (n = 3–4); * p ≤ 0.05, ** p ≤ 0.01, *** p ≤ 0.001.
Figure 6
Figure 6
Effect of palmitate on CD63, SELP, ADAMTS13, ANXA2, and ANXA8 gene expression. Relative gene expression after incubation with 200 μM palmitate for 48 h. Data analysed using the 2−ΔΔCT method are presented as mean ± SD (n = 3–4); * p ≤ 0.05.
Figure 7
Figure 7
Effect of palmitate on relative phospho-NF-κB p65 (Ser536) and IκBα protein levels. Quantitative analysis of (A) phospho-NF-κB p65 and (B) IκBα relative protein expression normalised to β-actin and compared to BSA treated as a control. Data are expressed as a percentage of appropriate BSA control and presented as mean (n = 4–7); * p ≤ 0.05, ** p ≤ 0.01, *** p ≤ 0.001. (C) Representative Western blots.
Figure 8
Figure 8
Effect of cardamonin and palmitate of VWF gene expression. Relative VWF gene expression after 48 h co-incubation of 100 μM palmitate with 5 μM cardamonin. Data analysed via the 2−ΔΔCT method are presented as mean ± SD (n = 4); * p ≤ 0.05 PA vs. BSA; # p ≤ 0.05 inhibitors vs. DMSO.
Figure 9
Figure 9
Effect of palmitate on TLR2 and TLR4 relative protein levels. Representative Western blots and quantitative analysis of relative protein expression normalised to β-actin and compared to BSA treated as a control. Data are expressed as a percentage of appropriate BSA control and presented as mean ± SD (n = 4–5); ** p ≤ 0.01, **** p ≤ 0.0001.
Figure 10
Figure 10
Effect of palmitate, cardamonin, and TLR inhibitors on the TNF transcript level. Relative TNF gene expression after incubation with (A) 100 μM and (B) 200 μM palmitate, respectively, for the indicated time, 6 h co-incubation of 200 μM palmitate with inhibitors: (C) 20 μM cardamonin (CARD); (D) 100 μM C29, 20 μM TAK-242; (E) both 100 μM C29 and 20 μM TAK-242 simultaneously. Data analysed using the 2−ΔΔCT method are presented as mean ± SD (n = 4); * p ≤ 0.05, ** p ≤ 0.01, *** p ≤ 0.001, **** p ≤ 0.0001 PA vs. BSA; # p ≤ 0.05, ## p ≤ 0.01, ### p ≤ 0.001 inhibitors vs. DMSO.
Figure 11
Figure 11
Effect of TLR inhibitors on TLR2 and TLR4 relative protein levels. HUVECs were treated 7 h with 100 μM C29 and 20 μM TAK-242. Quantitative analysis and representative Western blots of (A) TLR2 and (B) TLR4. Relative protein expression normalised to β-actin and compared to DMSO treated as a control. Data are expressed as a percentage of DMSO control and presented as mean ± SD (n = 3–4); # p ≤ 0.05 inhibitors vs. DMSO.
Figure 12
Figure 12
Effect of C29 and TAK-242 on gene expression of TLR2, TLR4, and TLR6 and proteins participating in TLRs activity. Relative TLR2, TLR4, TLR6, CD36, TIRAP, and MYD88 gene expression after 6 h co-incubation of 200 μM palmitate with inhibitors: 100 μM C29 and 20 μM TAK-242. Data analysed using the 2−ΔΔCT method are presented as mean ± SD (n = 3–4); * p ≤ 0.05, ** p ≤ 0.01 PA vs. BSA; # p ≤ 0.05, ## p ≤ 0.01 inhibitors vs. DMSO.
Figure 13
Figure 13
Effects of TLR2 and TLR4 gene silencing on protein levels of these receptors. HUVECs transfected with siTLR2 and siTLR4 were lysed 48, 72, and 96 h post-transfection. (A) Quantitative analysis and representative Western blots of TLR2 and TLR4 in cells transfected with siTLR2 or siTLR4#1. (B) Quantitative analysis and representative Western blots of TLR2 and TLR4 in cells transfected with siTLR4#2 or siTLR4#1 and siTLR4#2. Relative protein expression normalised to β-actin and compared to siRNA negative-control (siRNA neg) transfected cells as a control or siRNA negx2 for cells transfected with two siRNA. Data analysed using the 2−ΔΔCT method are expressed as a percentage of siRNA negative control and presented as mean ± SD (n = 3–4); * p ≤ 0.05, ** p ≤ 0.01, *** p ≤ 0.001, **** p ≤ 0.0001.
Figure 14
Figure 14
Effect of the TLR4 gene silencing on TLR4 or TLR2 gene expression. Relative TLR4 or TLR2 gene expression in HUVECs transfected with siTLR4#1, siTLR4#2, or both siTLR4#1 and siTLR4#2 were analysed 48, 72, and 96 h post-transfection. Data analysed using the 2−ΔΔCT method are presented as mean ± SD (n = 3); * p ≤ 0.05, ** p ≤ 0.01, **** p ≤ 0.0001.
Figure 15
Figure 15
Schematic representation of palmitate effect on VWF gene expression and vWF maturation by NF-κB signalling, palmitate-induced upregulation of CD36, TLR6, and TIRAP as alternative signalling of inhibited TLR4, and compensatory effects between TLR2 and TLR4 in endothelial cells. TLR2 inhibition results in increased TLR4 activity and decrease of TLR2 protein level by silencing results in increased TLR4 protein level. Silencing of TLR4, even if it is only effective at the mRNA level and not the protein level, increases TLR2 protein levels.

Similar articles

References

    1. De Pablo-Moreno J.A.D., Serrano L.J., Revuelta L., Sánchez M.J., Liras A. The Vascular Endothelium and Coagulation: Homeostasis, Disease, and Treatment, with a Focus on the Von Willebrand Factor and Factors VIII and V. Int. J. Mol. Sci. 2022;23:8283. doi: 10.3390/ijms23158283. - DOI - PMC - PubMed
    1. Pi X., Xie L., Patterson C. Emerging Roles of Vascular Endothelium in Metabolic Homeostasis. Circ. Res. 2018;123:477–494. doi: 10.1161/CIRCRESAHA.118.313237. - DOI - PMC - PubMed
    1. Mathew M., Tay E., Cusi K. Elevated plasma free fatty acids increase cardiovascular risk by inducing plasma biomarkers of endothelial activation, myeloperoxidase and PAI-1 in healthy subjects. Cardiovasc. Diabetol. 2010;9:9. doi: 10.1186/1475-2840-9-9. - DOI - PMC - PubMed
    1. Fryk E., Olausson J., Mossberg K., Strindberg L., Schmelz M., Brogren H., Gan L.-M., Piazza S., Provenzani A., Becattini B., et al. Hyperinsulinemia and insulin resistance in the obese may develop as part of a homeostatic response to elevated free fatty acids: A mechanistic case-control and a population-based cohort study. EBioMedicine. 2021;65:103264. doi: 10.1016/j.ebiom.2021.103264. - DOI - PMC - PubMed
    1. Arner P., Rydén M. Fatty Acids, Obesity and Insulin Resistance. Obes. Facts. 2015;8:147–155. doi: 10.1159/000381224. - DOI - PMC - PubMed

LinkOut - more resources