. 2023 Dec 20;14(1):11.
doi: 10.3390/diagnostics14010011.

Deep Learning Model Based on You Only Look Once Algorithm for Detection and Visualization of Fracture Areas in Three-Dimensional Skeletal Images

Affiliations

Deep Learning Model Based on You Only Look Once Algorithm for Detection and Visualization of Fracture Areas in Three-Dimensional Skeletal Images

Young-Dae Jeon et al. Diagnostics (Basel). .

Abstract

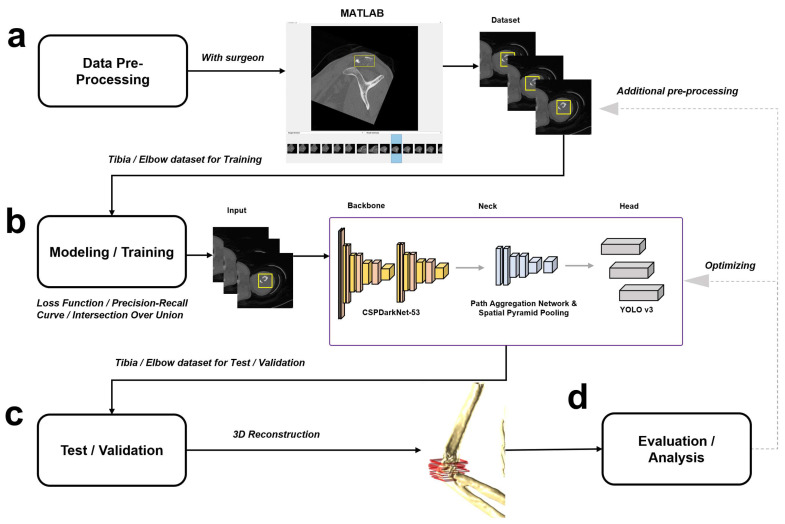
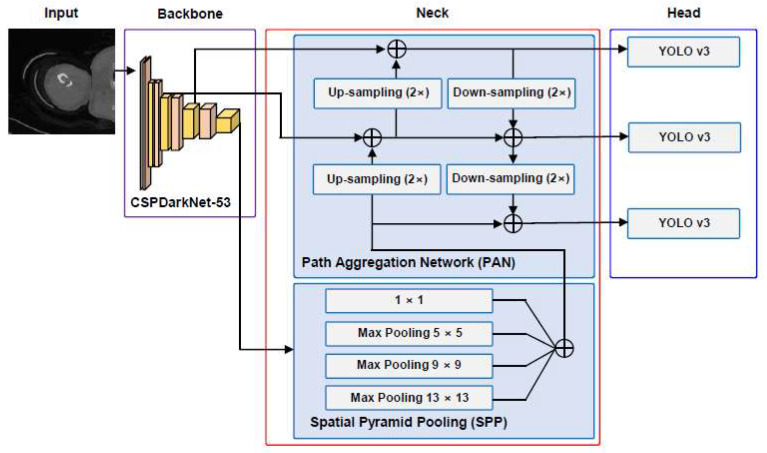
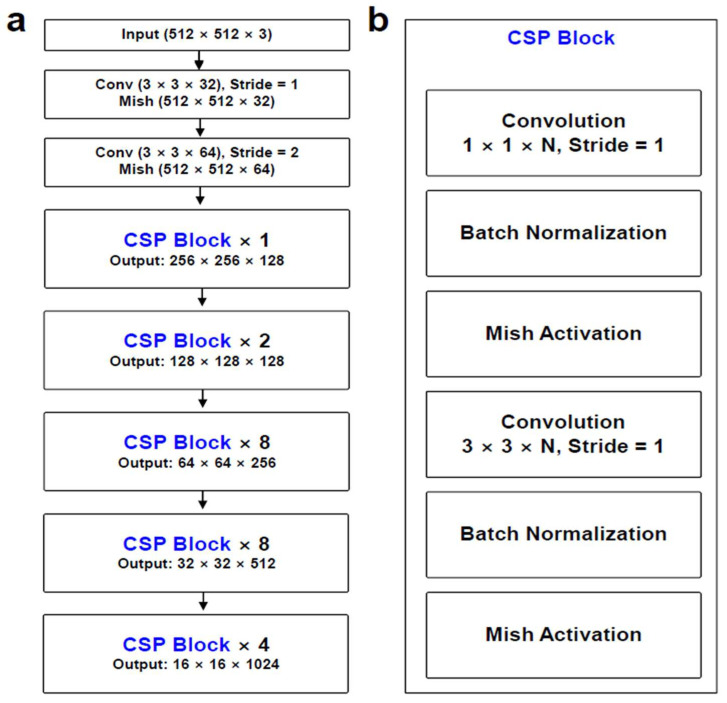
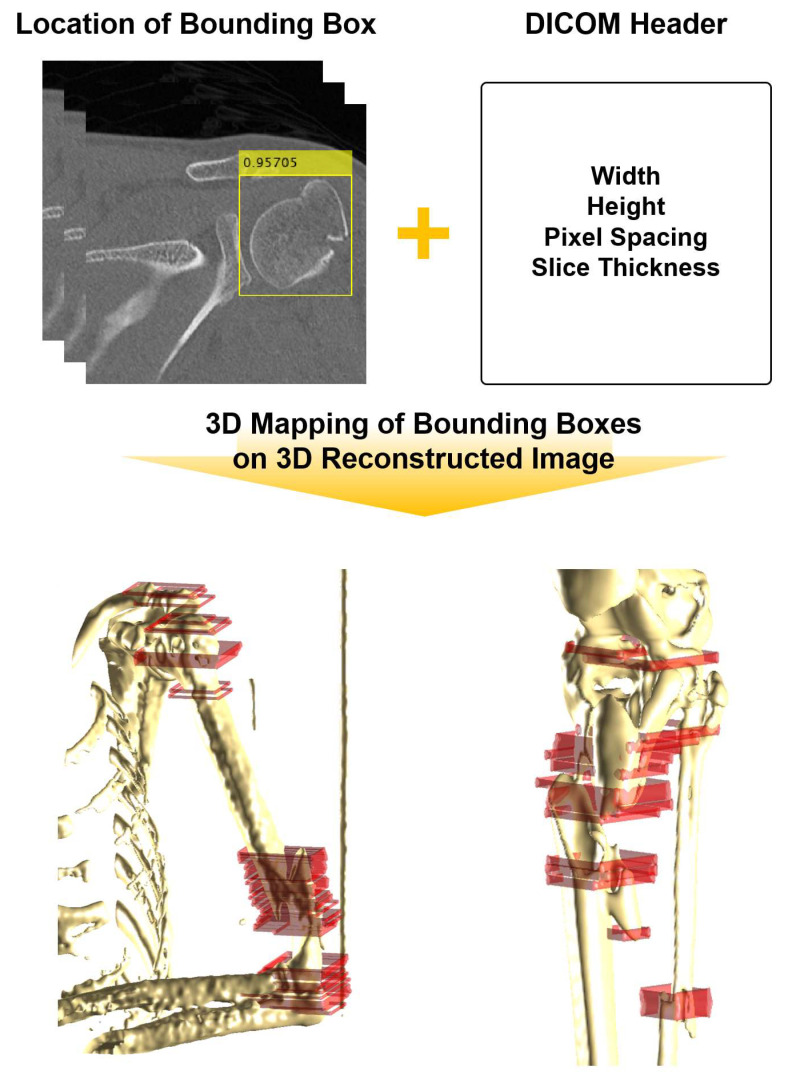
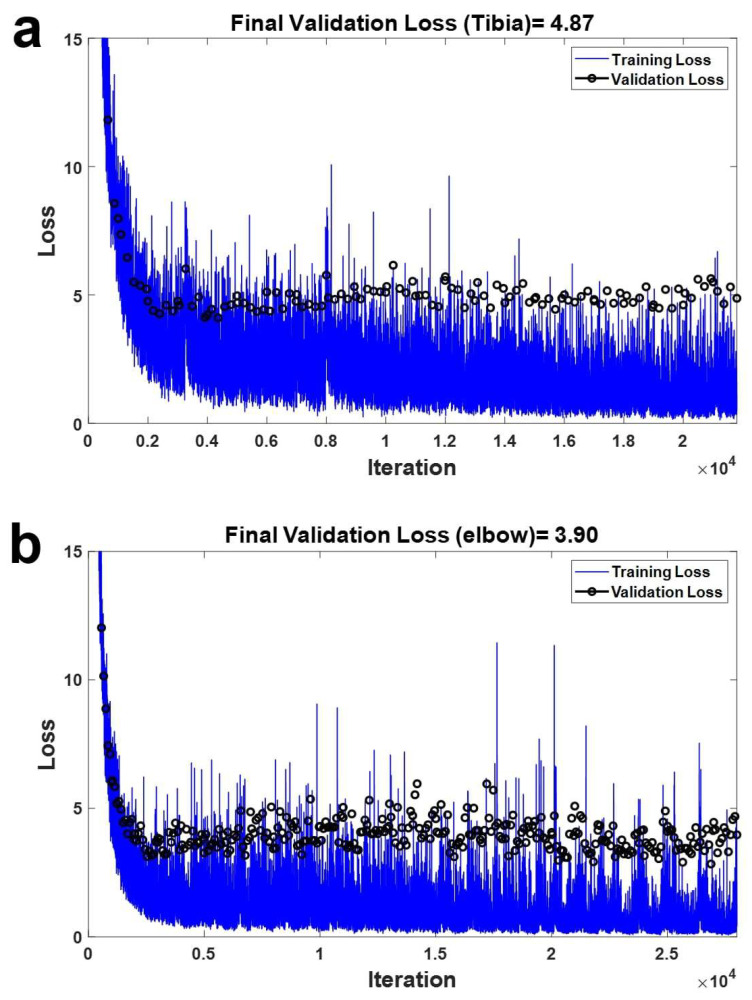
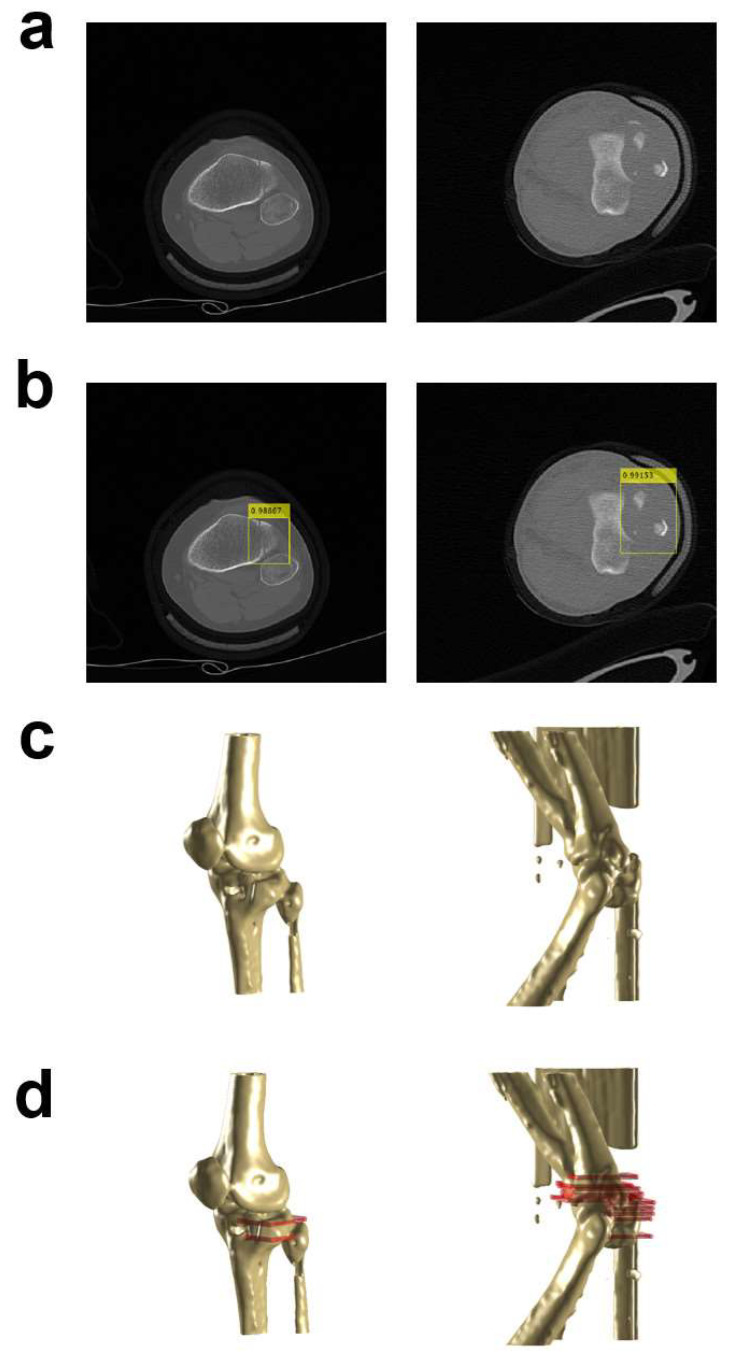
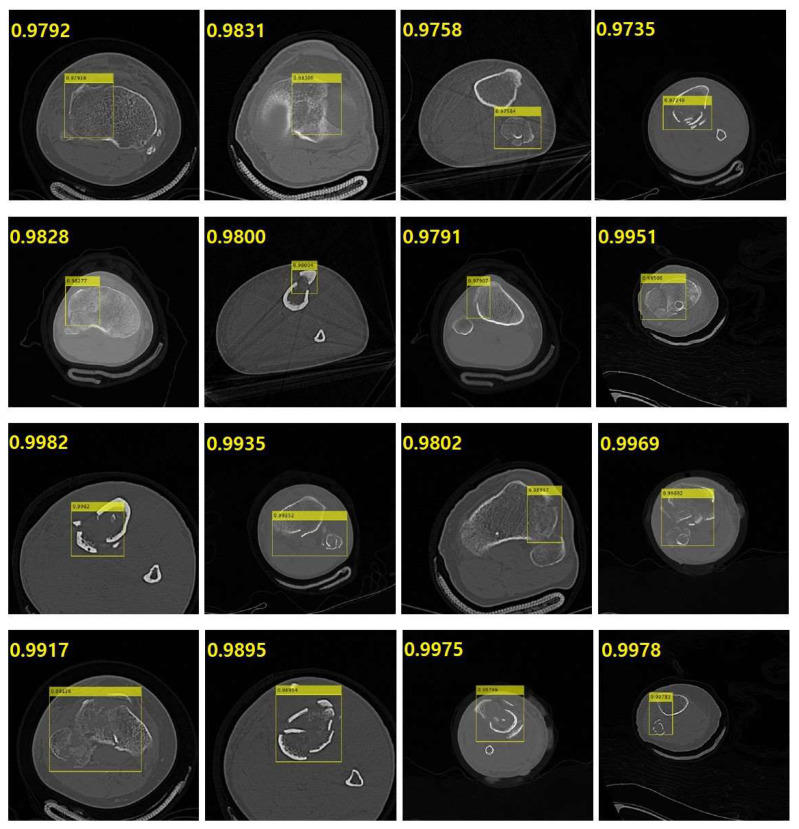
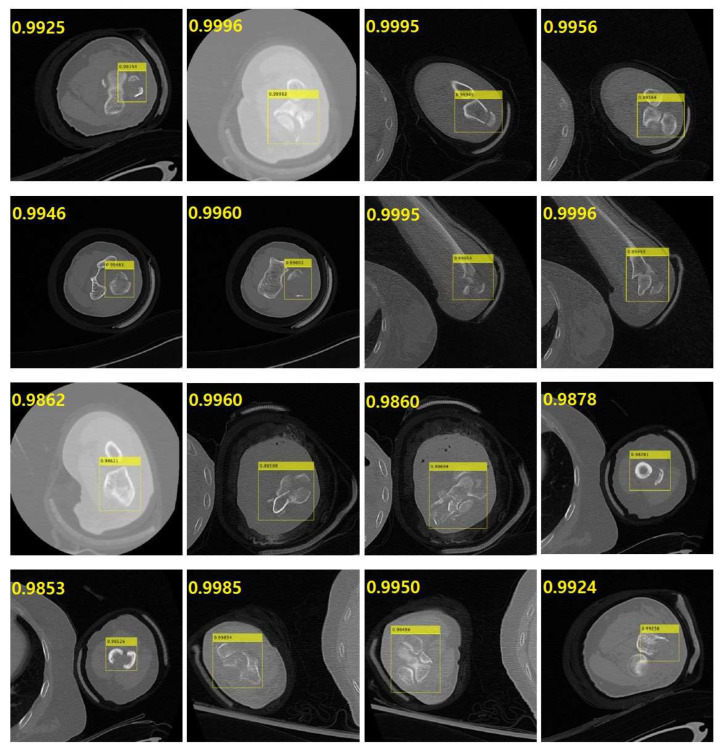
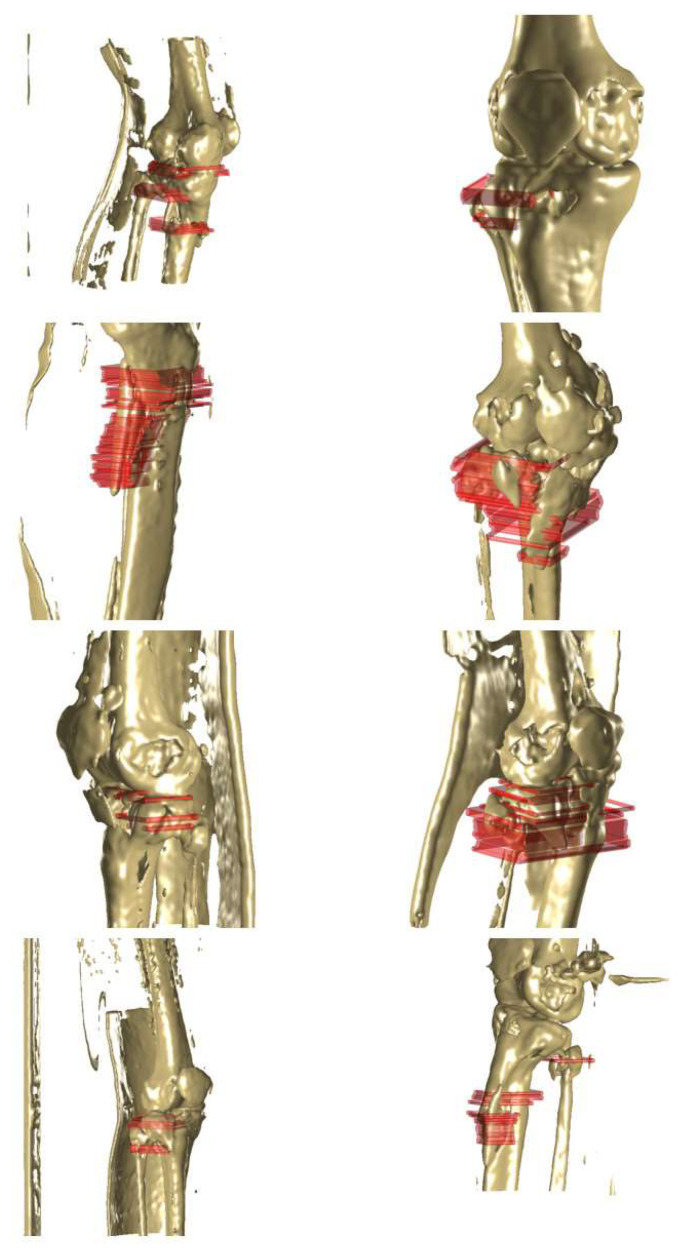
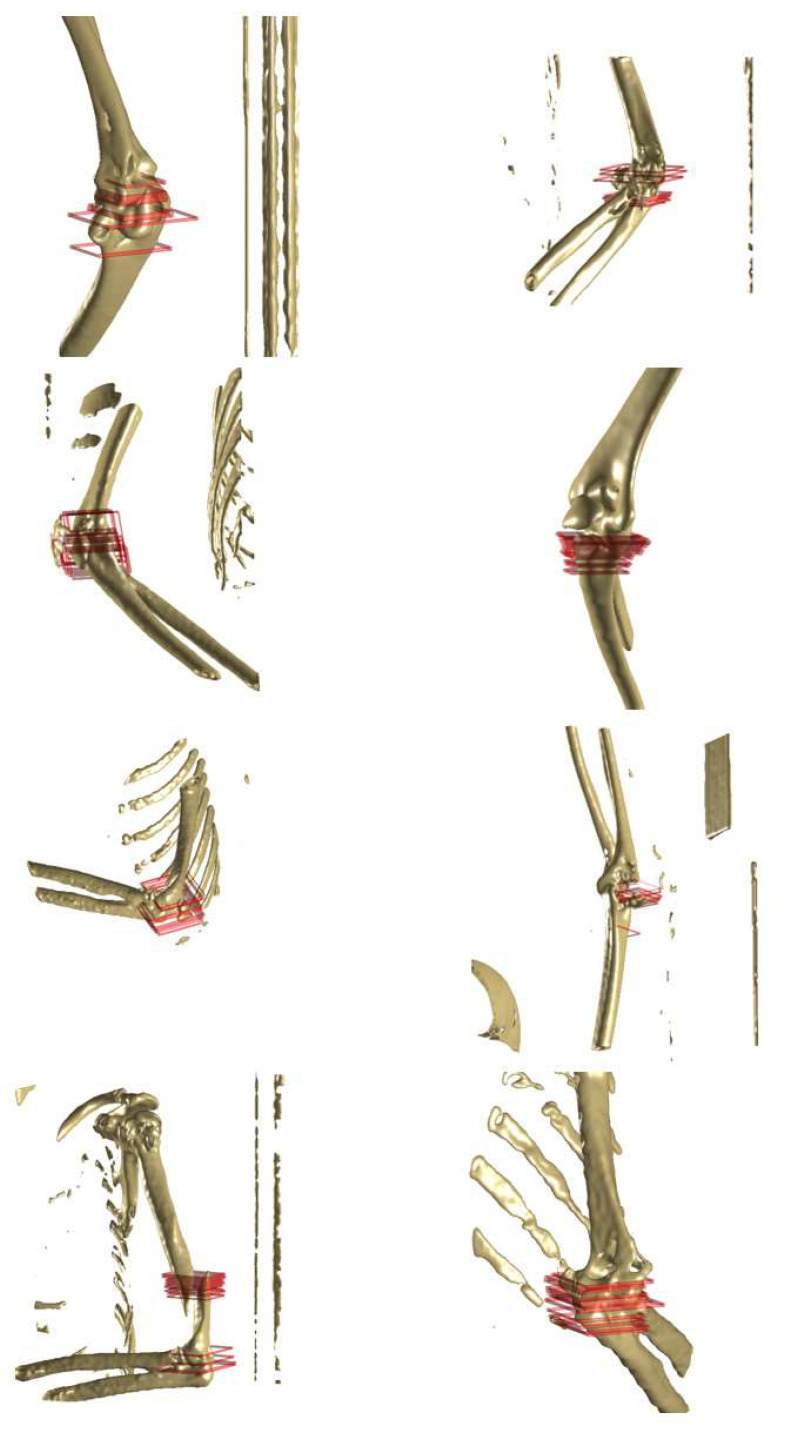
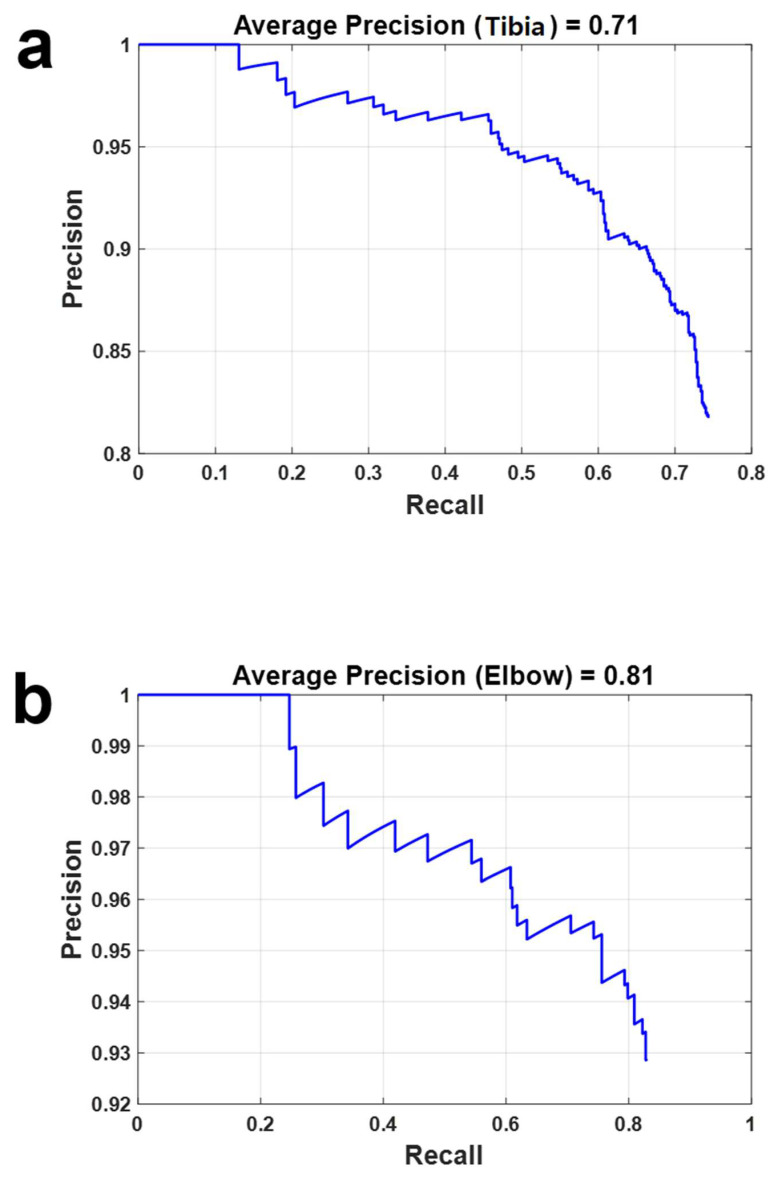
Utilizing "You only look once" (YOLO) v4 AI offers valuable support in fracture detection and diagnostic decision-making. The purpose of this study was to help doctors to detect and diagnose fractures more accurately and intuitively, with fewer errors. The data accepted into the backbone are diversified through CSPDarkNet-53. Feature maps are extracted using Spatial Pyramid Pooling and a Path Aggregation Network in the neck part. The head part aggregates and generates the final output. All bounding boxes by the YOLO v4 are mapped onto the 3D reconstructed bone images after being resized to match the same region as shown in the 2D CT images. The YOLO v4-based AI model was evaluated through precision-recall (PR) curves and the intersection over union (IoU). Our proposed system facilitated an intuitive display of the fractured area through a distinctive red mask overlaid on the 3D reconstructed bone images. The high average precision values (>0.60) were reported as 0.71 and 0.81 from the PR curves of the tibia and elbow, respectively. The IoU values were calculated as 0.6327 (tibia) and 0.6638 (elbow). When utilized by orthopedic surgeons in real clinical scenarios, this AI-powered 3D diagnosis support system could enable a quick and accurate trauma diagnosis.

Keywords: YOLO v4; deep learning; fracture detection; three dimensional (3D) reconstructed image; tibia and elbow.


Conflict of interest statement

Authors H.-Y.C., M.-S.K., J.-Y.Y., H.-J.K. and D.-K.Y. were employed by the company KAVILAB Co. Ltd. The remaining authors declare that the research was conducted in the absence of any commercial or financial relationships that could be construed as a potential conflict of interest.

Figures

Figure 1
Figure 1
Overview of overall algorithm of the working process. (a) Data preprocessing was performed with the help of a surgeon using MATLAB. After upload of the computed tomography (CT) Digital Imaging and Communications in Medicine (DICOM) file including the fracture region, each bounding box (yellow box) was added according to the fracture region in the CT image. (b) The model was built based on YOLO v4 and was trained with a dataset made through pre-processing. (c) The model that has been trained is tested and validated. (d) The results of detection obtained by test data were evaluated by confirming the loss function, precision–recall curve, and intersection over union, and additional data preprocessing or optimization of the model was performed according to the evaluation results when it needed.
Figure 2
Figure 2
Overall structure for YOLO v4. YOLO consists of four main parts: Input, Backbone, Neck, and Head. Preprocessed data are fed into the backbone from the input. The data accepted into the backbone (purple box) are diversified through cross stage partial connection DarkNet-53 (CSPDarkNet-53). Feature maps are extracted using Spatial Pyramid Pooling (SPP) and a Path Aggregation Network (PAN) in the neck part (red box). The head part (blue box) aggregates three YOLO v3 models and generates the final output.
Figure 3
Figure 3
Detailed layers for backbone. Detailed layers in the overall structure of YOLO v4 (a) and the detailed structure for cross stage partial (CSP) blocks (b). In (a), there are multiple CSP Blocks, and each CSP Block is organized so that the size of the output can be varied. The first CSP Block has one layer and produces an output size of 256 × 256 × 128, the second CSP Block has two layers and produces an output size of 128 × 128 × 128, the third CSP Block has eight layers and produces an output size of 64 × 64 × 256, the fourth CSP Block has eight layers and produces an output size of 32 × 32 × 512, and the fifth CSP Block has four layers and produces an output size of 16 × 16 × 1024. Inside the CSP block, after convolution, batch normalization and mish activation are performed to reduce the loss value.
Figure 4
Figure 4
Utilizing both the bounding box’s location and size data, along with the DICOM file’s header information, the bounding box is positioned onto the 3D reconstructed bone. By converting the pixel information from the DICOM file’s header into a distance concept based on the 3D reconstructed bone, the bounding box’s placement involves calculating its width, height, and thickness from the origin axis.
Figure 5
Figure 5
Result of validation loss after training. The Y-axis and X-axis show the loss and iteration which mean the number of validations for the minibatch. The blue line represents the variation in loss for training and the black line shows the variation in the loss in the actual validation. (a) Loss variation according to iteration using CT images including fracture cases in tibia region; the final validation loss was 4.87. (b) Variation in the loss after validation according to iteration using CT images including fracture cases in elbow region; the final validation loss was 3.90.
Figure 6
Figure 6
Example results for detection of fractured regions by YOLO v4 and 3D reconstructed images. The left side shows the results for the tibia case, and the right side shows the results for the elbow case. (a) Two dimensional (2D) images for both tibia and elbow cases including fractured regions. (b) Results of detection for fractured regions using images in (a) through YOLO v4. The yellow box is the bounding box to specify the fractured region on the image. (c) Three-dimensional reconstructed images using CT series including CT image in (a). (d) Three-dimensional 3D reconstructed images including red mask which can effectively show the fractured regions.
Figure 7
Figure 7
Representative results to show the detection performance for fractured region in the computed tomography (CT) images for tibia including fibula. The yellow bounding box which is generated by object detection network YOLO v4 is specifying the fractured region in the CT images. The yellow bounding box indicates not only the specific location of the fractured region but also the score which is based on the probability for a correct detection.
Figure 8
Figure 8
Representative results to show the detection performance for the fractured region in the computed tomography (CT) images of the elbow (humerus, radius, and ulna). The yellow bounding boxes are specifying the fractured region of the elbow in the CT images. The relatively large box is specifying the whole bone region in the CT images. In that case, the fracture type was a comminuted fracture for the whole structure which is shown in the CT image.
Figure 9
Figure 9
Representative results (tibia and fibula) to show the three dimensional (3D) reconstructed image for the fractured bone with red mask specifying the fractured region. The fractured bone was reconstructed as 3D images from the computed tomography (CT) series which included many CT image slides. Moreover, YOLO v4 detected the fractured region and the regions were specified by the bounding box. Although the bounding box is basically a 2D box on the individual CT image, the 3D expression (red mask) was possible by stacking the bounding boxes from several CT images in one series.
Figure 10
Figure 10
Representative results (elbow; humerus, radius, and ulna) to show the three dimensional (3D) reconstructed image for the fractured bone with a red mask specifying the fractured region. The red mask intuitively shows the fractured region in the 3D reconstructed image of the fractured elbow. The results show the multiple fractured regions using several red masks.
Figure 11
Figure 11
Precision–Recall (PR) curves to show the accuracy of detection of fractured regions by YOLO v4. The Y-axis and the X-axis represent the precision and the recall, respectively. The PR curves in (a) and (b) were acquired by using datasets for the tibia and elbow, respectively. The average precisions were 0.71 and 0.81 from (a) and (b), respectively.

Similar articles

Cited by

References

    1. Hsieh C.I., Zheng K., Lin C., Mei L., Lu L., Li W., Kuo C.F. Automated bone mineral density prediction and fracture risk assessment using plain radiographs via deep learning. Nat. Commun. 2021;12:5472. doi: 10.1038/s41467-021-25779-x. - DOI - PMC - PubMed
    1. Kuo R.Y., Harrison C., Curran T.A., Jones B., Freethy A., Cussons D., Stewart M., Collins G.S., Furniss D. Artificial intelligence in fracture detection: A systematic review and meta-analysis. Radiology. 2022;304:50–62. doi: 10.1148/radiol.211785. - DOI - PMC - PubMed
    1. Kolanu N., Brown A.S., Beech A., Center J.R., White C.P. Natural language processing of radiology reports for the identification of patients with fracture. Arch. Osteoporos. 2021;16:6. doi: 10.1007/s11657-020-00859-5. - DOI - PubMed
    1. Raisuddin A.M., Vaattovaara E., Nevalainen M., Nikki M., Järvenpää E., Makkonen K., Pinola P., Palsio T., Niemensivu A., Tervonen O., et al. Critical evaluation of deep neural networks for wrist fracture detection. Sci. Rep. 2021;11:6006. doi: 10.1038/s41598-021-85570-2. - DOI - PMC - PubMed
    1. Juan R., Diana M. A comprehensive review of YOLO: From YOLOv1 and beyond. arXiv. 20232304.00501