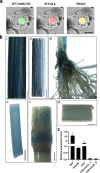
. 2024 Jan 9;259(2):35.
doi: 10.1007/s00425-023-04309-7.

OsNAC103, an NAC transcription factor negatively regulates plant height in rice

Affiliations

OsNAC103, an NAC transcription factor negatively regulates plant height in rice

Yan Li et al. Planta. .

Abstract

OsNAC103 negatively regulates rice plant height by influencing the cell cycle and crosstalk of phytohormones. Plant height is an important characteristic of rice farming and is directly related to agricultural yield. Although there has been great progress in research on plant growth regulation, numerous genes remain to be elucidated. NAC transcription factors are widespread in plants and have a vital function in plant growth. Here, we observed that the overexpression of OsNAC103 resulted in a dwarf phenotype, whereas RNA interference (RNAi) plants and osnac103 mutants showed no significant difference. Further investigation revealed that the cell length did not change, indicating that the dwarfing of plants was caused by a decrease in cell number due to cell cycle arrest. The content of the bioactive cytokinin N62-isopentenyladenine (iP) decreased as a result of the cytokinin synthesis gene being downregulated and the enhanced degradation of cytokinin oxidase. OsNAC103 overexpression also inhibited cell cycle progression and regulated the activity of the cell cyclin OsCYCP2;1 to arrest the cell cycle. We propose that OsNAC103 may further influence rice development and gibberellin-cytokinin crosstalk by regulating the Oryza sativa homeobox 71 (OSH71). Collectively, these results offer novel perspectives on the role of OsNAC103 in controlling plant architecture.

Keywords: Cell cycle; Cytokinins; Gibberellins; Phytohormones crosstalk; Plant development.


Conflict of interest statement

No competing or financial interests were declared.

Figures
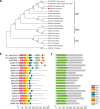
Fig. 1
Fig. 1
Phylogenetic tree and conserved sequence analysis of OsNAC103 proteins homologs. a Phylogenetic tree analysis of protein homologs of OsNAC103. The neighbor-joining (NJ) phylogenetic tree was constructed using MEGA5. b Conserved motif analysis of OsNAC103 and homologous proteins. The MEME program was used to investigate the conserved motifs. The motif width was set from 6 to 200. The motif number was set to 10. Differently colored rectangles represent different domains. c The green label shows the location of the NAM conserved domains of OsNAC103 and homologous proteins
Fig. 2
Fig. 2
OsNAC103 subcellular localization and tissue expression analysis. a The subcellular localization of OsNAC103. Bar = 10 μm. RFP-NLS was used as a nuclear marker. b GUS activity was detected in the young leaf (i), the young leaf sheath (ii), the young root (iii), the first internode (iv), the stem node (v), and the inner wall of the second internode of rice at maturity (vi). Bar = 1 mm. c Relative OsNAC103 expression levels in different tissues. Mean values ± SD, n = 3. Leaf, sheath, and root of 21-day-old seedling; internode I and internode II: the first internode and the second internode of mature plants
Fig. 3
Fig. 3
Transactivation activity of the OsNAC103 protein. The positive control: pGBKT7-53 and pGADT7-T plasmids. The negative control: pGBKT7-Lam and pGADT7-T plasmids
Fig. 4
Fig. 4
Phenotypes of OE-OsNAC103 plants. a The relative expression level of OsNAC103 of 21-day-old WT and OE-OsNAC103 plants. Mean values ± SD, n = 3. b The phenotype of 21-day-old WT and OE-OsNAC103 plants. Bar = 2 cm. c The shoot length of 21-day-old WT and OE-OsNAC103 plants. Mean ± SD, n = 20. d The leaf length of 21-day-old WT and OE-OsNAC103 plants. Mean ± SD, n = 25. e The leaf sheath length of of 21-day-old WT and OE-OsNAC103 plants. Mean ± SD, n = 28. f The plant height of mature WT and OE-OsNAC103 plants. Mean ± SD, n = 10. g The phenotype of mature-stage WT and OE-OsNAC103 plants. Bar = 5 cm. h The different internodes of mature WT and OE-OsNAC103 plants. Bar = 2 cm. i The internode lengths of mature WT and OE-OsNAC103 plants (from the top of the stem to the bottom). Mean ± SD, n = 13. The WT was used as a control for significance difference analysis. *P < 0.05; **P < 0.01; ***P < 0.001; t test
Fig. 5
Fig. 5
Phenotypes of RNAi-OsNAC103 plants. a The relative expression level of OsNAC103 of 21-day-old WT and RNAi lines. Mean values ± SD, n = 3. b The phenotype of 21-day-old WT and RNAi plants. Bar = 5 cm. c The shoot length of 21-day-old WT and RNAi plants. Mean ± SD, n = 15. d The leaf length of 21-day-old WT and RNAi plants. Mean ± SD, n = 15. e The leaf sheath length of 21-day-old WT and RNAi plants. Mean ± SD, n = 15. f The plant height of mature WT and RNAi plants. Mean ± SD, n = 8. g The phenotype of mature-stage WT. Bar = 10 cm. h The phenotype of mature-stage RNAi plants. Bar = 10 cm. i The different internodes of mature WT and RNAi lines. Bar = 3 cm. j The internode lengths of the WT and RNAi plants (from the top of the stem to the bottom). Mean ± SD, n = 8. The WT was used as a control for significance difference analysis. *P < 0.05; ns, no significant difference, t test
Fig. 6
Fig. 6
OsNAC103 regulates gibberellin metabolism and cell numbers. a The relative expression level of genes related to gibberellin synthesis in WT, RNAi, and OE-OsNAC103 plants. Mean values ± SD, n = 3. b The phenotype of WT, RNAi, and OE-OsNAC103 plants incubated in 1/2 MS medium or medium-containing PAC, GA3 for 10 days. Bar = 5 cm. c The shoot length of WT, RNAi, and OE-OsNAC103 plants incubated in 1/2 MS medium or medium-containing PAC, GA3 for 10 days. Mean ± SD, n = 10. d The epidermal cells in the second leaf sheath of 21-day-old seedlings. Bar = 50 μm. e The cell length of WT, RNAi, and OE-OsNAC103 plants. Mean ± SD. Every line has at least 300 cells. f Estimation of cell numbers in the second leaf sheath of 21-day-old seedlings
Fig. 7
Fig. 7
Overexpression of OsNAC103 decreased the cytokinin content and sensitivity to iP. a The comparison of WT and OE-OsNAC103 plants’ cytokinin content. Mean values ± SD, n = 3. b Observation of dark-induced leaf yellowing phenotypes in WT, RNAi, and OE-OsNAC103 plants. c The relative expression level of OsNAC103 under iP (100 µM) treatment in WT plants. Mean ± SD, n = 3. d Phenotypes of WT, RNAi, and OE-OsNAC103 plants treated with different concentrations of iP for 10 days. Bar = 5 cm. e The relative shoot length of WT, RNAi, and OE-OsNAC103 plants treated with different concentrations of iP for 10 days. Mean ± SD, n = 8. The WT was used as a control for significance difference analysis. **P < 0.01; ***P < 0.001; ns, no significant difference, t test
Fig. 8
Fig. 8
OsNAC103 regulates cytokinin synthesis, degradation, and signal transduction. a The relative expression level of genes related to cytokinin synthesis, degradation, and signaling response in WT, RNAi, and OE-OsNAC103 plants. Mean values ± SD, n = 3. b The relative expression level of OsNAC103 in the WT under 6-BA (100 µM) treatment. Mean ± SD, n = 3. c Phenotypes of WT, RNAi, and OE-OsNAC103 plants on 1/2 MS alone or treated with different concentrations of 6-BA for 10 days. Bar = 5 cm. d The relative shoot length of WT, RNAi, and OE-OsNAC103 plants on 1/2 MS alone or treated with different concentrations of 6-BA for 10 days. Mean ± SD, n = 8. The WT was used as a control for significance difference analysis. *P < 0.05; **P < 0.01; ***P < 0.001; t test
Fig. 9
Fig. 9
OsNAC103 affects cell cycle progression genes. a The relative expression levels of cell cycle genes in WT, RNAi, and OE-OsNAC103 plants. Mean values ± SD, n = 3. b Transactivation activity of OsNAC103 on the promoter of OsCYCP2;1 was tested by dual-luciferase assay. Mean ± SD, n = 5. c A schematic diagram of the promoter of OsCYCP2;1 and DNA-binding activities of OsNAC103 proteins on the CACG motifs of OsCYCP2;1 was tested by EMSA. The WT was used as a control for significance difference analysis. *P < 0.05; **P < 0.01; ***P < 0.001; t test
Fig. 10
Fig. 10
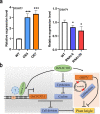
OsNAC103 is involved in the homeostasis regulation of plant hormones. a The relative expression level of OSH71 in WT, RNAi, and OE-OsNAC103 plants. Mean values ± SD, n = 3. b Working model for OsNAC103 regulating plant height. The circles and rectangles marked with question marks represent unknown proteins and promoter elements, respectively. The WT was used as a control for difference significance analysis. *P < 0.05; **P < 0.01; ***P < 0.001; t test

Similar articles

Cited by

References

    1. Bu Q, Jiang H, Li CB, Zhai Q, Zhang J, Wu X, Sun J, Xie Q, Li C. Role of the Arabidopsis thaliana NAC transcription factors ANAC019 and ANAC055 in regulating jasmonic acid-signaled defense responses. Cell Res. 2008;18(7):756–767. doi: 10.1038/cr.2008.53. - DOI - PubMed
    1. Camut L, Gallova B, Jilli L, Sirlin-Josserand M, Carrera E, Sakvarelidze-Achard L, Ruffel S, Krouk G, Thomas SG, Hedden P, Phillips AL, Daviere JM, Achard P. Nitrate signaling promotes plant growth by upregulating gibberellin biosynthesis and destabilization of DELLA proteins. Curr Biol. 2021;31(22):4971–4982, e4974. doi: 10.1016/j.cub.2021.09.024. - DOI - PubMed
    1. Chen S, Songkumarn P, Liu J, Wang GL. A versatile zero background T-vector system for gene cloning and functional genomics. Plant Physiol. 2009;150(3):1111–1121. doi: 10.1104/pp.109.137125. - DOI - PMC - PubMed
    1. Chen X, Lu S, Wang Y, Zhang X, Lv B, Luo L, Xi D, Shen J, Ma H, Ming F. OsNAC2 encoding a NAC transcription factor that affects plant height through mediating the gibberellic acid pathway in rice. Plant J. 2015;82(2):302–314. doi: 10.1111/tpj.12819. - DOI - PubMed
    1. Chen L, Zhao J, Song J, Jameson PE. Cytokinin dehydrogenase: a genetic target for yield improvement in wheat. Plant Biotechnol J. 2019;18(3):614–630. doi: 10.1111/pbi.13305. - DOI - PMC - PubMed