. 2024 Mar;115(3):847-858.
doi: 10.1111/cas.16051. Epub 2024 Jan 5.

Achaete-scute family bHLH transcription factor 2 activation promotes hepatoblastoma progression

Affiliations

Achaete-scute family bHLH transcription factor 2 activation promotes hepatoblastoma progression

Yutaka Kato et al. Cancer Sci. 2024 Mar.

Abstract

Achaete-scute family bHLH transcription factor 2 (ASCL2) is highly expressed in hepatoblastoma (HB) tissues, but its role remains unclear. Thus, biological changes in the HB cell line HepG2 in response to induced ASCL2 expression were assessed. ASCL2 expression was induced in HepG2 cells using the Tet-On 3G system, which includes doxycycline. Cell viability, proliferation activity, mobility, and stemness were evaluated using 3-(4,5-dimethylthiazol-2-yl)-2,5-diphenyltetrazolium bromide, colony-formation, migration, invasion, and sphere-formation assays. Quantitative reverse-transcription polymerase chain reaction was used to assess the expression of markers for proliferation (CCND1 and MYC), epithelial-mesenchymal transition (EMT; SNAI1, TWIST1, and ZEB1), mesenchymal-epithelial transition (CDH1), and stemness (KLF4, POU5F1, and SOX9). Compared with the non-induced HepG2 cells, cells with induced ASCL2 expression showed significant increases in viability, colony number, migration area (%), and sphere number on days 7, 14, 8, and 7, respectively, and invasion area (%) after 90 h. Furthermore, induction of ASCL2 expression significantly upregulated CCND1, MYC, POU5F1, SOX9, and KLF4 expression on days 2, 2, 3, 3, and 5, respectively, and increased the ratios of SNAI1, TWIST1, and ZEB1 to CDH1 on day 5. ASCL2 promoted the formation of malignant phenotypes in HepG2 cells, which may be correlated with the upregulation of the Wnt signaling pathway-, EMT-, and stemness-related genes. ASCL2 activation may therefore be involved in the progression of HB.

Keywords: Wnt signaling pathway; basic helix-loop-helix transcription factor; growth; hepatoblastoma; phenotype.


Conflict of interest statement

The authors have no conflicts of interest to declare.

Figures
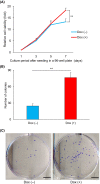
FIGURE 1
FIGURE 1
MTT and colony‐formation assays in the induced expression experiment using HepG2 Tet‐On ASCL2. (A) HepG2 Tet‐On ASCL2 cell viability was evaluated using an MTT assay. The relative cell viabilities were calculated using the absorbances at 570 and 650 nm at the indicated time points (days 3, 5, and 7), and the fold change was calculated relative to the viabilities on day 1. On day 7, cell viability was significantly higher with the Dox (+) treatment than with the Dox (−) treatment (relative cell viability [fold], mean [SD] 18.29 [0.94]‐fold vs. 13.25 [1.29]‐fold, P < 0.001, n = 4). Days 1, 3, 5, and 7 refer to the culture period after seeding in the 96‐well plate. Values shown are the means ± SD. **P < 0.01. Cells were seeded in eight wells of a 96‐well plate in four plates for each group. (B) Colony‐forming abilities were evaluated using a colony‐formation assay with the HepG2 Tet‐On ASCL2 cells. The number of colonies was greater with the Dox (+) treatment than with the Dox (−) treatment (on day 14, mean [SD] 76.5 [9.0] colonies vs. 24.5 [4.3] colonies, P < 0.001, n = 6). Seeding in a six‐well plate was also carried out on day 0 of the culture period after the Dox treatment. Values shown are the means ± SD. **P < 0.01. (C) Representative images of the Dox (−) and (+) treatments groups on day 14. Colony sizes were larger with the Dox (+) treatment than with the Dox (−) treatment. Scale bar = 5 mm. Dox, doxycycline; MTT, 3‐(4,5‐dimethylthiazol‐2‐yl)‐2,5‐diphenyltetrazolium bromide.
FIGURE 2
FIGURE 2
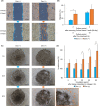
Migration and invasion assays in the induced expression experiment with HepG2 Tet‐On ASCL2. (A) Representative images of the HepG2 Tet‐On ASCL2 cells from the Dox (−) and (+) treatment groups that were analyzed using a migration assay. Image of the Dox (+) treatment group on M‐day 2 (day 8) shows invadopodia (identified using arrows). Scale bar = 200 μm. (B) Migration areas (%) on M‐days 2 and 4 (days 8 and 10). The migration areas (%) on M‐day 2 (day 8) were significantly larger with the Dox (+) treatment than with the Dox (−) treatment (mean [SD] 33.2 [7.4]% vs. 14.1 [1.6]%, respectively, P = 0.012, n = 4). M‐days 2 and 4 refer to the culture period after removing the Culture‐Insert 2 Well; days 8 and 10 refer to the culture period after the Dox (−) and (+) treatment. Values shown are the means ± SD. *P < 0.05. (C) Representative images of the HepG2 Tet‐On ASCL2 cells from the Dox (−) and (+) treatment groups that were analyzed using an invasion assay. The image of the Dox (+) treatment group at 90 h shows invadopodia, identified using arrows. Scale bar = 500 μm. (D) Invasion areas (%) at 5, 10, 30, 50, and 90 h. The invasion areas (%) at 30, 50, and 90 h were significantly larger with the Dox (+) treatment than with the Dox (−) treatment (mean [SD] 110.0 [4.9]% vs. 98.9 [6.0]%, 112.7 [5.3]% vs. 99.0 [6.71]%, and 119.0 [6.0]% vs. 101.6 [7.2]%, P = 0.028, 0.019, and 0.009, respectively). 5, 10, 30, 50, and 90 h refer to the incubation period after being embedded in collagen I. Values shown are the means ± SD (n = 4). *P < 0.05, **P < 0.01. Dox, doxycycline; M‐day, migration‐day.
FIGURE 3
FIGURE 3
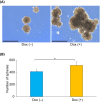
Sphere‐formation assay in the induced expression experiment with HepG2 Tet‐On ASCL2. (A) Representative images from the sphere‐formation assay using the HepG2 Tet‐On ASCL2 cells from the Dox (−) and Dox (+) treatment groups on day 7. Sphere sizes were larger with the Dox (+) treatment than with the Dox (−) treatment. Scale bar = 0.5 mm. (B) Sphere‐formation abilities of the HepG2 Tet‐On ASCL2 cells were evaluated on day 7 using the sphere‐formation assay. There were more spheres with the Dox (+) treatment than with the Dox (−) treatment (mean [SD] 515.0 [63.1] spheres vs. 412.8 [44.4] spheres, P = 0.038, n = 4). Day 7: culture period after seeding in an Asnol Petri dish. Values shown are the means ± SD. *P < 0.05. Dox, doxycycline.
FIGURE 4
FIGURE 4
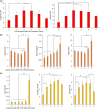
Expression of proliferation‐, EMT‐, and stemness‐related genes before and after the induction of ASCL2. (A) CCND1 and MYC (proliferation markers)/ACTB expression levels. The levels of CCND1 and MYC significantly increased on days 2–3 and 2–4 when compared with those on day 0. Their levels decreased from day 4, although the decreases were not statistically significant when compared with those on day 3. (B) SNAI1, TWIST1, and ZEB1 (EMT markers)/CDH1 (a MET marker) expression ratios. Compared with day 0, the ratios of SNAI1, TWIST1, and ZEB1 to CDH1 were not significantly different until day 4 and significantly increased on day 5. SNAI1, TWIST1, ZEB1 (EMT markers), and CDH1 (MET marker)/ACTB were also evaluated using qRT‐PCR (Figure S14). (C) KLF4, POU5F1, and SOX9 (stemness markers)/ACTB expression levels. Compared with their levels on day 0, POU5F1 and SOX9 expression levels significantly increased on days 1–5 and days 1–4, while KLF4 expression only significantly increased on day 5. For qRT‐PCR analysis of the genes of interest, the same samples as those used for ASCL2/ACTB were used (Figures S2A and S9). Day 0 before the Dox treatment and days 1, 2, 3, 4, and 5 of the culture period after the Dox treatment. Values shown are the means ± SD (n = 4). *P < 0.05, **P < 0.01. Dox, doxycycline; EMT, epithelial‐mesenchymal transition; MET, mesenchymal‐epithelial transition; qRT‐PCR, quantitative reverse‐transcription polymerase chain reaction.

Similar articles

References

    1. Little MH, Thomson DB, Hayward NK, Smith PJ. Loss of alleles on the short arm of chromosome 11 in a hepatoblastoma from a child with Beckwith‐Wiedemann syndrome. Hum Genet. 1988;79(2):186‐189. doi:10.1007/BF00280564 - DOI - PubMed
    1. Nagae G, Yamamoto S, Fujita M, et al. Genetic and epigenetic basis of hepatoblastoma diversity. Nat Commun. 2021;12(1):5423. doi:10.1038/s41467-021-25430-9 - DOI - PMC - PubMed
    1. Schuijers J, Junker JP, Mokry M, et al. Ascl2 acts as an R‐spondin/Wnt‐responsive switch to control stemness in intestinal crypts. Cell Stem Cell. 2015;16(2):158‐170. doi:10.1016/j.stem.2014.12.006 - DOI - PubMed
    1. Giakountis A, Moulos P, Zarkou V, et al. A positive regulatory loop between a wnt‐regulated non‐coding RNA and ASCL2 controls intestinal stem cell fate. Cell Rep. 2016;15(12):2588‐2596. doi:10.1016/j.celrep.2016.05.038 - DOI - PubMed
    1. Tian Y, Pan Q, Shang Y, et al. MicroRNA‐200 (miR‐200) cluster regulation by achaete scute‐like 2 (Ascl2): impact on the epithelial‐mesenchymal transition in colon cancer cells. J Biol Chem. 2014;289(52):36101‐36115. doi:10.1074/jbc.M114.598383 - DOI - PMC - PubMed

MeSH terms

Substances