. 2024 Jan 4;21(1):3.
doi: 10.1186/s12974-023-03001-7.

Cholinergic signaling via the α7 nicotinic acetylcholine receptor regulates the migration of monocyte-derived macrophages during acute inflammation

Affiliations

Cholinergic signaling via the α7 nicotinic acetylcholine receptor regulates the migration of monocyte-derived macrophages during acute inflammation

Kasey R Keever et al. J Neuroinflammation. .

Abstract

Background: The involvement of the autonomic nervous system in the regulation of inflammation is an emerging concept with significant potential for clinical applications. Recent studies demonstrate that stimulating the vagus nerve activates the cholinergic anti-inflammatory pathway that inhibits pro-inflammatory cytokines and controls inflammation. The α7 nicotinic acetylcholine receptor (α7nAChR) on macrophages plays a key role in mediating cholinergic anti-inflammatory effects through a downstream intracellular mechanism involving inhibition of NF-κB signaling, which results in suppression of pro-inflammatory cytokine production. However, the role of the α7nAChR in the regulation of other aspects of the immune response, including the recruitment of monocytes/macrophages to the site of inflammation remained poorly understood.

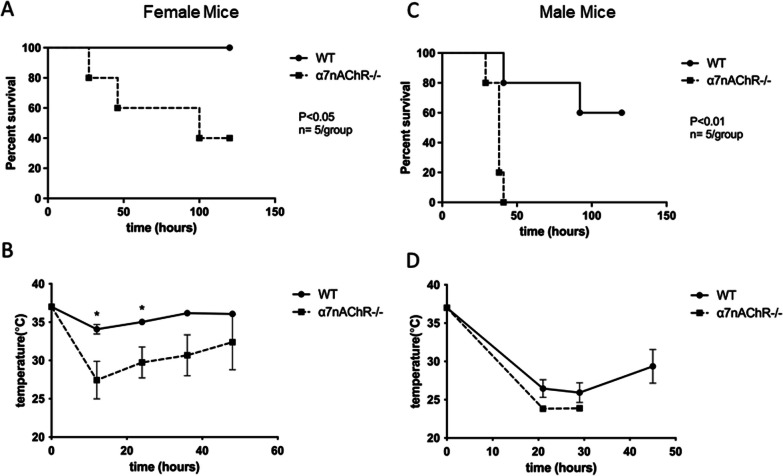
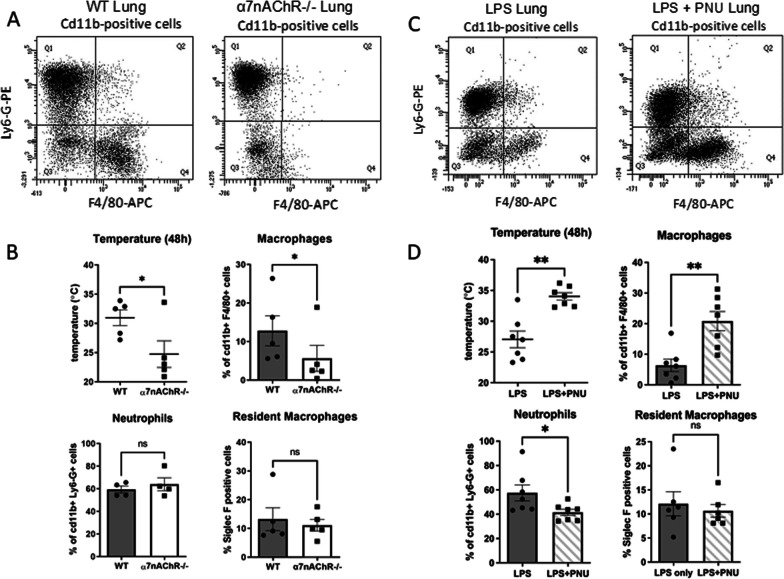
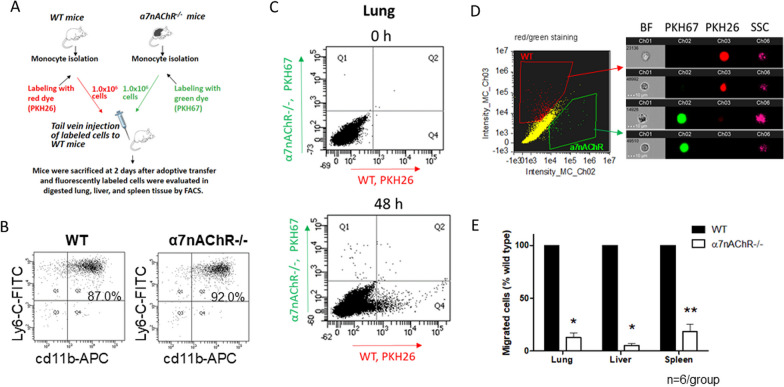
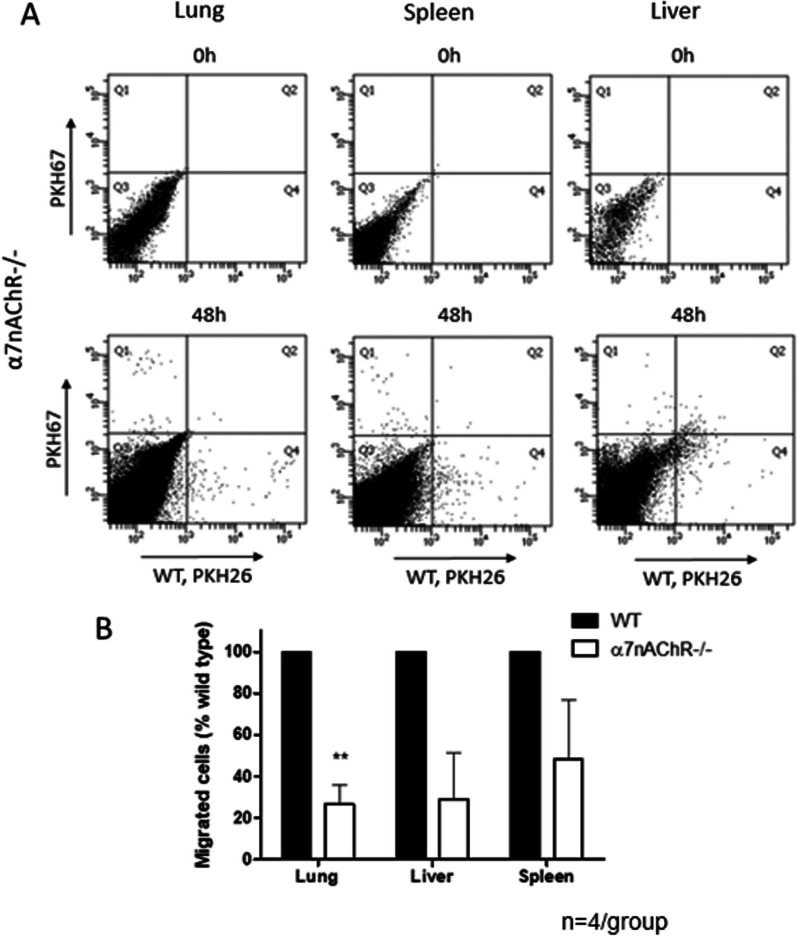
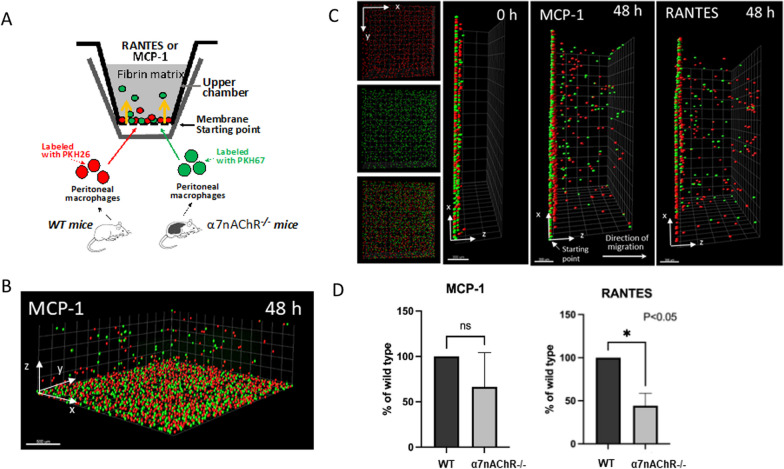
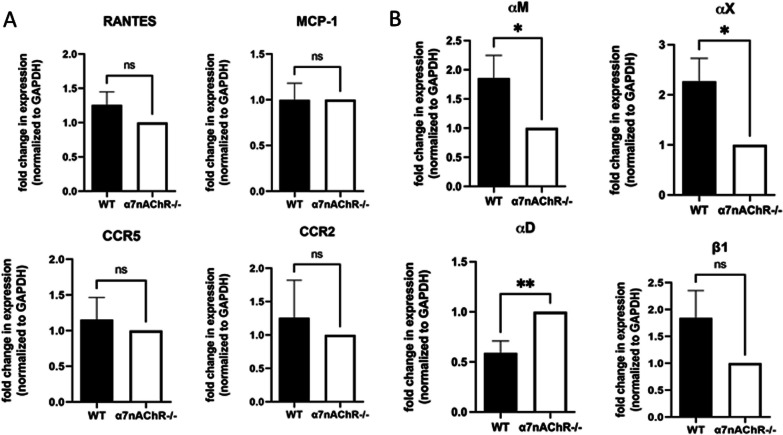
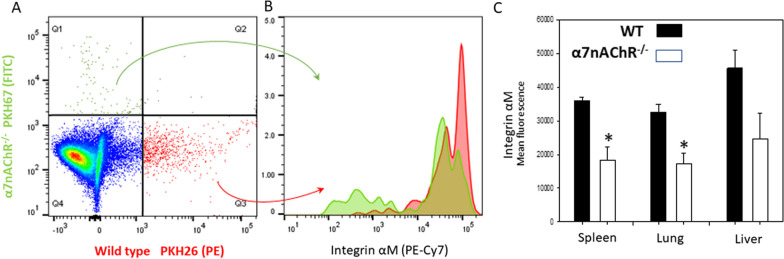
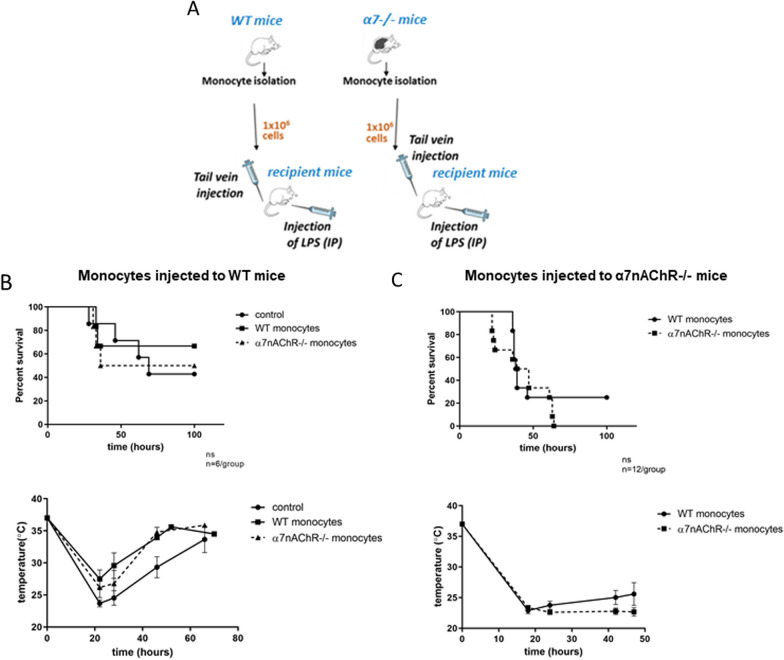
Results: We observed an increased mortality in α7nAChR-deficient mice (compared with wild-type controls) in mice with endotoxemia, which was paralleled with a significant reduction in the number of monocyte-derived macrophages in the lungs. Corroborating these results, fluorescently labeled α7nAChR-deficient monocytes adoptively transferred to WT mice showed significantly diminished recruitment to the inflamed tissue. α7nAChR deficiency did not affect monocyte 2D transmigration across an endothelial monolayer, but it significantly decreased the migration of macrophages in a 3D fibrin matrix. In vitro analysis of major adhesive receptors (L-selectin, β1 and β2 integrins) and chemokine receptors (CCR2 and CCR5) revealed reduced expression of integrin αM and αX on α7nAChR-deficient macrophages. Decreased expression of αMβ2 was confirmed on fluorescently labeled, adoptively transferred α7nAChR-deficient macrophages in the lungs of endotoxemic mice, indicating a potential mechanism for α7nAChR-mediated migration.

Conclusions: We demonstrate a novel role for the α7nAChR in mediating macrophage recruitment to inflamed tissue, which indicates an important new aspect of the cholinergic regulation of immune responses and inflammation.

Keywords: Cholinergic anti-inflammatory pathway; Endotoxemia; Macrophage; Migration; Sepsis; α7nAChR.


Conflict of interest statement

The authors declare they have no competing interests.

Figures

Fig. 1
Fig. 1
HYPERLINK "sps:id::fig1||locator::gr1||MediaObject::0"α7nAChR is protective during endotoxemia. A Survival curves after intraperitoneal administration of LPS to induce endotoxemia in female mice. (WT, n = 5; α7nAChR−/−, n = 5). B After injection of LPS, a decrease in body temperature to 21–27 oC confirmed the development of endotoxemia. C Survival curves after LPS-induced endotoxemia in male mice. WT (n = 5) and α7nAChR−/− (n = 5). D Body temperature drop in male mice. Statistical significance of survival curves was assessed by the Kaplan–Meier method. Temperature data are shown as mean±SEM, *P < 0.05
Fig. 2
Fig. 2
Macrophage accumulation in the lungs is affected by α7nAChR signaling. A WT and α7nAChR−/− mice were injected with a sublethal dose of LPS. After 48h lungs were removed, digested, and analyzed using flow cytometry. CD11b-positive cells were selected and tested with antibodies against Ly6-G and F4/80 to identify neutrophils and macrophages, respectively. Results were analyzed and calculated using FACSDiva software and GraphPad Prism. B Plots representing the number of WT and α7nAChR−/− macrophages (top right, n = 5/group), neutrophils (bottom left, n = 4/group), and resident macrophages (bottom right, n = 5/group) in digested lungs. Residents were identified as CD11b-F4/80 + Siglec F + . Body temperature at 48h is shown at top right (n = 7/group). C WT mice were injected with either a sublethal dose of LPS or 3mg/kg PNU-282987 followed by LPS 15 min later. The dose of LPS used was higher than for part A to generate more severe conditions for WT mice. After 48h lungs were removed, digested and analyzed using flow cytometry. CD11b positive cells and residents were selected and analyzed as above. Results were analyzed with FACSDiva software and calculated with GraphPad Prism. D Plots depicting the number of macrophages (top right, n = 7/group), neutrophils (bottom left, n = 7/group), and resident macrophages (bottom right, n = 6/group). Body temperature at 48h is shown at top left (n = 7/group). Statistical analysis was performed using a paired t test
Fig. 3
Fig. 3
α7nAChR deficiency impedes the migration of macrophages to organs during LPS-induced endotoxemia. A Schematic representation of the experimental design. Monocytes were isolated from bone marrow of male WT and α7nAChR−/− mice via MACS. Cells were labeled with red (WT) or green (α7nAChR−/−) fluorescent dyes, mixed in equal proportion and injected in tail vein of male WT recipient mice. After 48 h, the lung, liver and spleen were isolated, digested and analyzed using flow cytometry. B Representative dot plots of monocyte purity analysis. Isolated monocytes were labeled with anti-CD11b (APC) and anti-Ly6-G (FITC). Monocyte population is visible in Q2. C Representative results of flow cytometry analysis are shown. The leukocyte distribution in lungs before the adoptive transfer (Upper panel) and at 48 h after adoptive transfer and LPS administration (Lower panel) are presented. Data were analyzed using FACSDiva software. Migrated WT macrophages (red) were detected in Quadrant 4; α7nAChR−/− macrophages (green) were detected in Quadrant 1. D Imaging flow cytometry of labeled macrophages. (BF = bright field, SSC = side scattering). E Bar graphs representing the amount of WT and α7nAChR-deficient macrophages detected in lungs, liver, and spleen by flow cytometry, (n = 6). Statistical analysis was performed using student’s t test. *P < 0.05, **P < 0.01
Fig. 4
Fig. 4
Effect of α7nAChR deficiency on migration does not depend on other cell types. A Representative dot plots of flow cytometry showing migrated red (WT) and green (α7nAChR−/−) monocytes in male α7nAChR−/− recipient mice. The leukocyte distribution in lungs before the adoptive transfer (Upper panel) and at 48 h after adoptive transfer and LPS administration (lower panel) are presented. B Bar graphs representing the amount of WT and α7nAChR-deficient macrophages detected in organs by flow cytometry. The experimental setup is same, as depicted in Fig. 3A, using 8-week-old male and female α7nAChR−/− recipients instead of WT (n = 4). Statistical analysis was performed using a student’s t test. **P < 0.01
Fig. 5.
Fig. 5.
3-D migration of peritoneal macrophages along MCP-1 and RANTES gradients. A Schematic drawing of experimental setup within a Corning transwell insert, with yellow arrows indicating the direction of macrophage migration. WT macrophages were labeled red (PKH26) and α7nAChR−/− macrophages were labeled green (PKH67) before being added to the membrane. Migration was initiated using RANTES (12.8nM) or MCP-1 (30nM) in medium added to the top of the fibrin gel. B 3-D view of labeled macrophages migrating inside the fibrin gel after 48 h. C IMARIS 8.0 reconstruction of WT (red) and α7nAChR−/−(green) macrophages before the initiation of migration and after 48-h incubation. Left shows the top view of individual and combined channels. Center, side view showing starting point at 0h. Right, side view showing macrophages migrating along MCP-1 or RANTES gradients. D The number of macrophages migrating greater than 80μm was analyzed as a percentage of WT (MCP-1, n = 4; RANTES, n = 3). Statistical analysis was carried out using a student's t test. *P < 0.05
Fig. 6
Fig. 6
Quantitative real-time PCR of chemokines and surface receptors. A Peritoneal macrophages were isolated from WT and α7nAChR−/− mice and subsequently incubated with LPS (10ng/mL) and PNU (30μM) overnight before isolation of RNA and production of cDNA. Plots show relative mRNA levels of CCR2 and its ligand MCP-1, and CCR5 and its ligand RANTES. B Cells were prepared for qRT-PCR identically to part A. Plots showing relative mRNA levels of integrin subunits αM, αX, αD, and β1. Experiment had eight independent replicates. Data were analyzed using the Livak Method. Statistical analysis was performed with a student's t test. *P < 0.05, **P < 0.01
Fig. 7
Fig. 7
Surface expression of integrin αM on migrating WT (red) and α7nAChR−/− (green) macrophages. A Representative flow cytometry dot plot showing migrated WT (red) and α7nAChR−/− (green) macrophages, in quadrant 3 and quadrant 1, respectively. B Histogram overlay of αM fluorescence, colors correspond to cell staining in part A. Data were analyzed using FlowJo software. C Bar graphs representing the amount of WT and α7nAChR-deficient macrophages detected in organs by flow cytometry. (n = 4). Statistical analysis was performed using student’s t test. *P < 0.05
Fig. 8
Fig. 8
Survival of WT and α7nAChR−/− mice injected with monocytes during LPS-induced endotoxemia. A Graphical representation of experimental setup. Recipient mice are either WT (part B) or α7nAChR−/− (part C). Control mice were given LPS only, with no monocytes. B Survival curve and temperature graph of WT recipients receiving WT, α7nAChR−/−, or no monocytes (control) intravenously before a sub-lethal intraperitoneal dose of LPS. 8–10-week-old WT male and female mice were used as recipients (n = 6/treatment group). C Survival curve and temperature graph of α7nAChR−/− recipients receiving either WT or α7nAChR−/− monocytes intravenously before a sub-lethal intraperitoneal dose of LPS. 8–10-week-old α7nAChR−/− male and female mice were used as recipients (n = 9/treatment group). For survival curves, statistical significance was assessed by the Kaplan–Meier method. Temperature graphs report mean temperature and standard error.

Similar articles

Cited by

References

    1. Pavlov VA, Chavan SS, Tracey KJ. Molecular and functional neuroscience in immunity. Annu Rev Immunol. 2018;36:783–812. doi: 10.1146/annurev-immunol-042617-053158. - DOI - PMC - PubMed
    1. Tracey KJ. The inflammatory reflex. Nature. 2002;420(6917):853–859. doi: 10.1038/nature01321. - DOI - PubMed
    1. Chavan SS, Pavlov VA, Tracey KJ. Mechanisms and therapeutic relevance of neuro-immune communication. Immunity. 2017;46(6):927–942. doi: 10.1016/j.immuni.2017.06.008. - DOI - PMC - PubMed
    1. Pavlov VA, Tracey KJ. The vagus nerve and the inflammatory reflex–linking immunity and metabolism. Nat Rev Endocrinol. 2012;8(12):743–754. doi: 10.1038/nrendo.2012.189. - DOI - PMC - PubMed
    1. Pavlov VA, Wang H, Czura CJ, Friedman SG, Tracey KJ. The cholinergic anti-inflammatory pathway: a missing link in neuroimmunomodulation. Mol Med. 2003;9(5–8):125–134. doi: 10.1007/BF03402177. - DOI - PMC - PubMed

MeSH terms

LinkOut - more resources