. 2024 Jan;25(1):351-377.
doi: 10.1038/s44319-023-00016-2. Epub 2023 Dec 20.

An analogue of the Prolactin Releasing Peptide reduces obesity and promotes adult neurogenesis

Affiliations

An analogue of the Prolactin Releasing Peptide reduces obesity and promotes adult neurogenesis

Sara Km Jörgensen et al. EMBO Rep. 2024 Jan.

Abstract

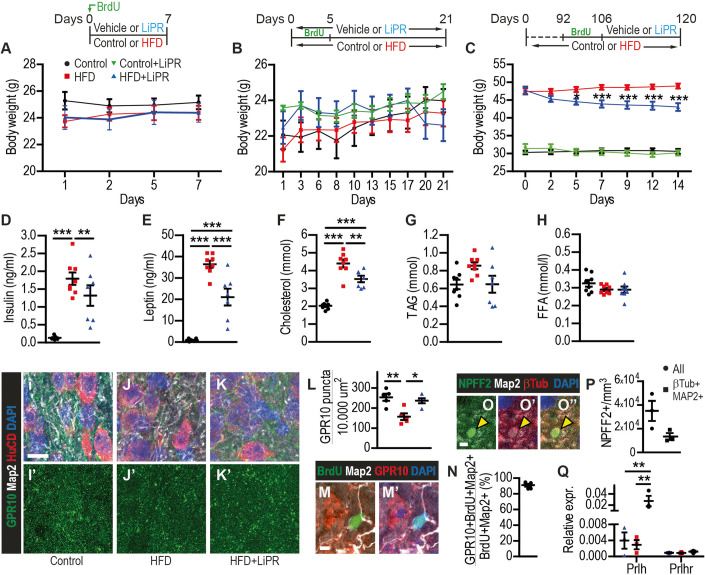
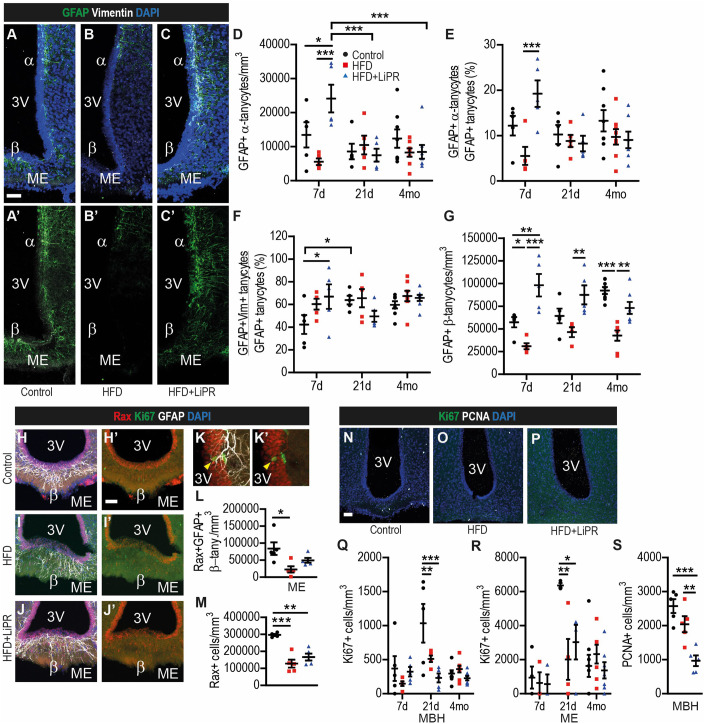
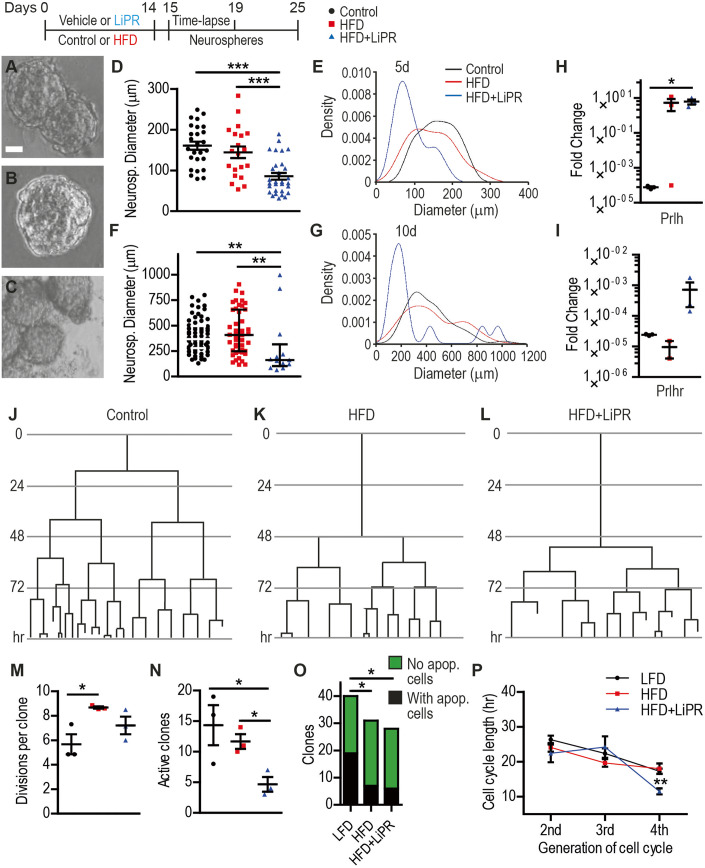
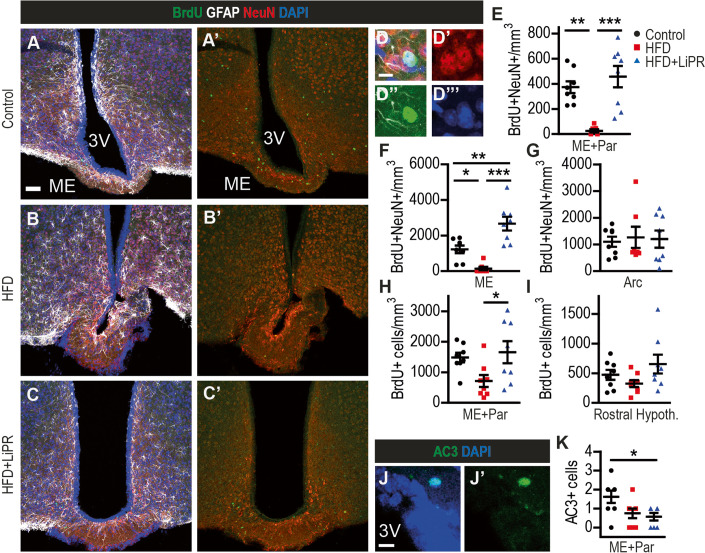
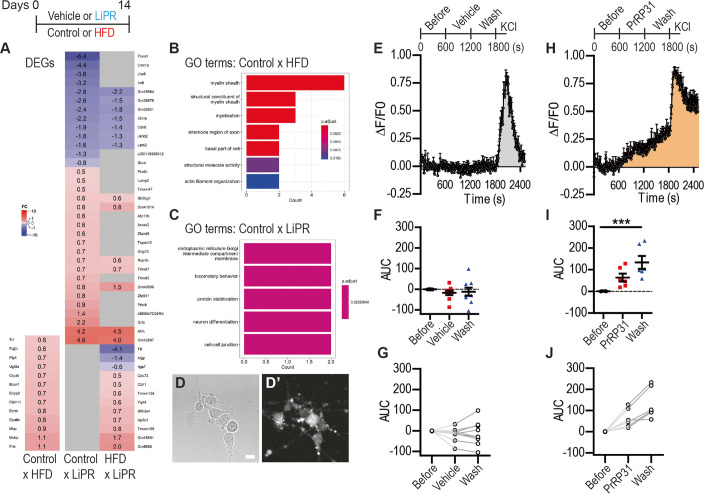
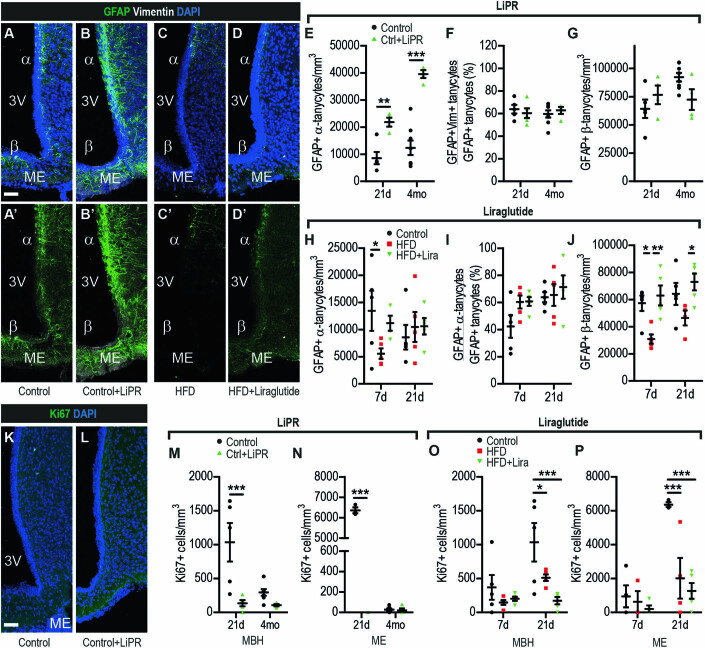
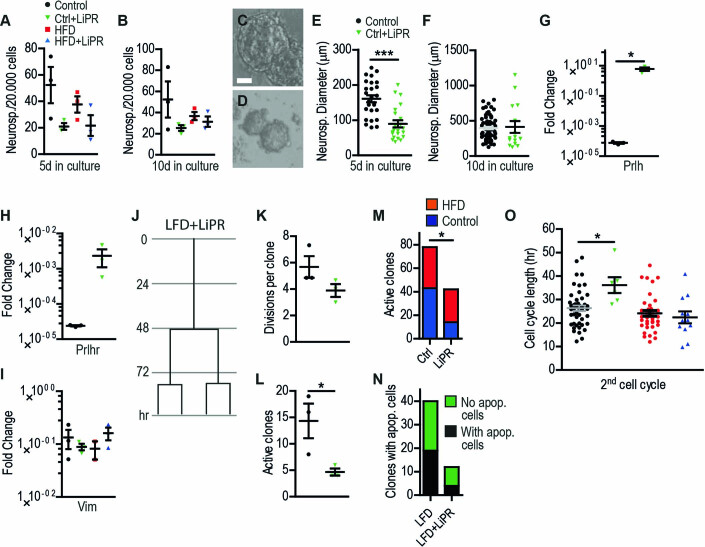
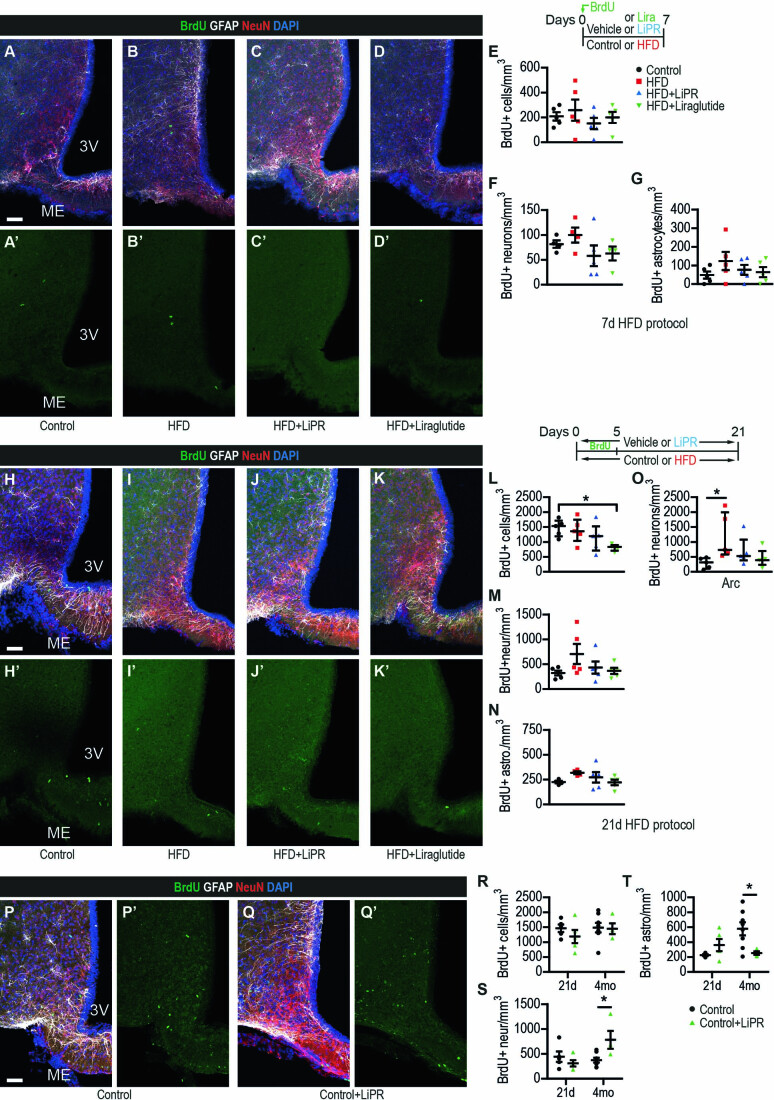
Hypothalamic Adult Neurogenesis (hAN) has been implicated in regulating energy homeostasis. Adult-generated neurons and adult Neural Stem Cells (aNSCs) in the hypothalamus control food intake and body weight. Conversely, diet-induced obesity (DIO) by high fat diets (HFD) exerts adverse influence on hAN. However, the effects of anti-obesity compounds on hAN are not known. To address this, we administered a lipidized analogue of an anti-obesity neuropeptide, Prolactin Releasing Peptide (PrRP), so-called LiPR, to mice. In the HFD context, LiPR rescued the survival of adult-born hypothalamic neurons and increased the number of aNSCs by reducing their activation. LiPR also rescued the reduction of immature hippocampal neurons and modulated calcium dynamics in iPSC-derived human neurons. In addition, some of these neurogenic effects were exerted by another anti-obesity compound, Liraglutide. These results show for the first time that anti-obesity neuropeptides influence adult neurogenesis and suggest that the neurogenic process can serve as a target of anti-obesity pharmacotherapy.

Keywords: Adult neurogenesis; Anti-obesity peptides; Hypothalamus; Neural stem cells; Prolactin Releasing Peptide.


Conflict of interest statement

The authors declare no competing interests.

Figures

Figure 1
Figure 1. Effects of LiPR on body weight, plasma metabolites and expression of PrRP and its receptors.
(AC) Mouse body weigh over time for the 7d (A), 21d (B) and 4mo (C) HFD protocols, which are summarized in the schematics above panels. (DH) Plasma concentration of selected hormones and metabolites from 4mo HFD group. (IK) Representative confocal microphotographs of MBH stained as indicated for GPR10 and neuronal markers from 21d HFD group in Control (I), HFD (J) and HFD + LiPR (K) mice. (L) Quantification of GPR10+ puncta in MBH of 21d group. (M) A representative image of GPR10+ puncta associated with Map2+ processes around a BrdU+ nucleus in ME. (N) Quantification of the proportion of BrdU+Map2 + GPR10+ cells in MBH. (O) A representative confocal image of a NPFF2 punctum (marked by arrowhead) in MBH stained as indicated from a control animal of 21d HFD group. (P) Quantification of NPFF2 puncta in MBH of 21d group. (Q) Relative mRNA fold change of Prlh and Prlhr compared to Gapdh in cDNA from MBH from mice 2 weeks on Control diet, HFD or HFD+LiPR. Data information: Scale bars (s.b.): 10 μm (IK), 5 μm (M), 2 μm (O). n = 5 mice per data set in panels A,B,L,N. n = 8 mice per data set in panels C,D, EH. n = 3 mice per data group in panels PQ. In panels AC, Repeated measure two-way ANOVA ((B): treatment F(3, 160) = 4.351, p < 0.0056; C: treatment F(3, 150) = 130.7, p < 0.0001, duration of treatment F(6, 150) = 10.42, p < 0.0001, interaction F(18, 150) = 20.70, p < 0.0001). In panels DH,L,P, One-way ANOVA. In panel Q, Two-way ANOVA (F(2, 12) = 5.95, p = 0.016). *p < 0.05, **p < 0.01, ***p < 0.001 (Bonferroni’s test). Data are presented as mean ± SEM. Source data are available online for this figure.
Figure 2
Figure 2. Effects of LiPR on tanycytes and proliferating cells in the MBH.
(AC) Representative confocal images of HVZ with 3rd Ventricle (3V) and Medial Eminence (ME) stained as indicated in Control (A), HFD (B) and HFD + LiPR (C) of 7d HFD group. (D) Quantification of GFAP+ α-tanycytes per volume of MBH. (E) Proportional analysis of GFAP+ α-tanycytes in MBH. (F) Proportional analysis of GFAP+Vimentin+ tanycytes in MBH. (G) Quantification of GFAP+ β-tanycytes per volume of ME. (HJ) Representative images of MBH stained as indicated (21d group). (K) Representative image of Rax+Ki67+GFAP+ tanycyte (yellow arrowhead). (L) Quantification of Rax+GFAP+ β-tanycytes per volume of ME (21d group). (M) Quantification of Rax+ cells per volume of the HVZ (21d group). (NP) Representative images of the MBH stained as indicated (21d group). (QS) Quantification of cells positive for Ki67 in MBH (Q) or in ME for 21d (R) and for PCNA (S). Data information: Scale bars: 10 μm (K), 50 μm (all other). In all panels but panel S, n = 5 mice per data set for 7d and 21d groups, n = 8 mice per data set for 4mo group. In panel S, n = 3–8 mice per data set. In panels DG, Two-way ANOVA (D: treatment F(2,45) = 3.28, p = 0.047, duration of treatment F(2,45) = 3.76, p = 0.031, interaction F(4,45) = 5.29, p = 0.0014; E: treatment F(2, 44) = 3.58, p = 0.036, interaction F(4, 44) = 3.88, p < 0.009; F: interaction F(4,45) = 2.61, p = 0.048; G: treatment F(2, 42) = 31.3, p < 0.0001, interaction F(4, 42) = 5.79, p = 0.0008; Q: treatment F(2,44) = 6.59, p < 0.0031, duration F(2,44) = 7.78, p = 0.0013, interaction F(4, 44) = 4.63, p = 0.0033; R: treatment F(2,34) = 2.94, p < 0.066, duration F(2,34) = 10.43, p = 0.0003, interaction F(4, 34) = 3.07, p = 0.029). In other panels (L,M,S), One-way ANOVA (L: F(2,14) = 6.04), p = 0.015; M: F(2,13) = 18.81, p = 0.0003; S: F(2,14) = 16.66, p = 0.0003). *p < 0.05, **p < 0.01, ***p < 0.001 (Bonferroni’s test). Data are presented as mean ± SEM. Source data are available online for this figure.
Figure 3
Figure 3. LiPR reduces cell activation and proliferation of htNSCs in vitro.
(AC) Representative images of HVZ-derived neurospheres 5d in culture from Control (A), HFD (B) and HFD + LiPR (C) treated mice. Schematics of the experimental protocol shown above. (D,F) Quantification of diameter of neurospheres 5d (D) and 10d (F) in culture. (E,G) Kernel density plots of neurosphere diameter frequency distribution as a function of diameter for 5d (E) and 10d (G) in culture. (H,I) Relative mRNA fold change of Prlh (H) and Prlhr (I) compared to Gapdh in cDNA from MBH-derived neurospheres (10d in culture). (JL) Example cell division trees from 4-day time-lapse imaging of aNSCs from HVZ of Control (J), HFD (K), HFD + LiPR (L) mice. (M) Quantification of the number of cell divisions per division tree clone. (N) Time-lapse quantification of active (dividing) clones per 20,000 plated cells. (O) Proportion of active clones containing at least one apoptotic cell. (P) Cell cycle length from the time-lapse imaging over observed cell divisions. Data information: Scale bars: 20 μm. In all panels, n = 3 mice for each data set. In panel D, number of neurospheres: n = 26 (Control), 20 (HFD), 30 (HFD+LiPR). In panel E, number of neurospheres: n = 66 (Control), 46 (HFD), 13 (HFD+LiPR). In panels MP, number of traced clones: n = 48 (Control), 68 (HFD), 53 (HFD+LiPR). Data information: In panel O, Chi-square test. In panel F, Kruskal–Wallis test with Dunn’s test (H = 10.30, p = 0.0058). In panels H,N,O,P, un-paired two-tailed T-Test. In other panels, One-way ANOVA with Bonferroni’s test (D: F(2,73) = 15.80, p < 0.0001; M: F(2,6) = 5.61, p = 0.042). *p < 0.05, **p < 0.01, ***p < 0.001. Data are presented as median ± IQR (F) or mean ± SEM (all other panels). Source data are available online for this figure.
Figure 4
Figure 4. LiPR improves the survival of new neurons in the MBH.
(AC) Representative confocal images of HVZ stained as indicated in Control (A), HFD (B) and HFD + LiPR (C) of 4 mo HFD group. (D) An example of BrdU+ neuron in the MBH parenchyma. (EG) Quantification of BrdU+ neurons in MBH parenchyma (E), ME (F) and Arcuate Nucleus (Arc, G). H,I Quantification of all BrdU+ cells in parenchyma of MBH (H) and rostral hypothalamus (I). (J) An example of Activated Caspase 3 (AC3) positive cell near 3 V wall. (K) Quantification of AC3+ cells in MBH. Data information: Scale bars: 50 μm (AC), 10 μm (D,J). n = 5 mice per data set for 7d and 21d groups and n = 8 mice per data set for 4mo group. Data information: In all panels, One-way ANOVA with Bonferroni’s test (E: F(2,20) = 14.21, p < 0.0001; F: F(2,20) = 21.37, p < 0.0001; H: F(2,21) = 3.87, p = 0.037; K: F(2, 22) = 2.46, p = 0.025). *p < 0.05, **p < 0.01, ***p < 0.001. Data are presented as mean ± SEM. Source data are available online for this figure.
Figure 5
Figure 5. Effects of LiPR on gene expression in the MBH and human iPSC-derived hypothalamic neurons.
(A) A table of Differentially Expressed Genes (DEGs) in three different pair-wise comparisons of bulk RNAseq data. Experimental protocol is depicted above. (B) Bulk RNAseq Gene Ontology (GO) terms for the Control Diet vs HFD comparison. (C) Bulk RNAseq GO terms for Control Diet vs Control Diet+LiPR comparison. (D) A representative image in the bright field (D) and fluorescence (D’) of hiPSC-derived hypothalamic neurons loaded with the Rhod-3 AM dye and used in calcium imaging. (E,H) A graph of the relative fluorescence change (ΔF/F0) of Rhod-3 as a function of time before and during hPrRP31 (or Vehicle) application in medium, wash-out and KCl positive control. (E) Neurons exposed to Vehicle. (H) Neurons responding to hPrRP31. (F,I) A summary of fluorescence before (0–600 s), during hPrRP31 (F) or Vehicle (I, 600–1200 s) or wash-out (1200–1800 s) in area under curve (AUC). (G,J) Individual neurons from calcium imaging in the before-after plot from the Vehicle (G) and hPrRP31-responsive (J) groups. Data information: Scale bar: 10 μm. In panels AC, n = 3–4 mice per data set. In panels EG, n = 9 recorded cells. In panels HJ, n = 6 recorded cells. Data information: One-way ANOVA (I: F(2,15) = 10.90, p = 0.0012). ***p < 0.001 (Bonferroni’s test). Data are presented as mean ± SEM. Source data are available online for this figure.
Figure EV1
Figure EV1. Effects of LiPR in Control Diet and Liraglutide on tanycytes and proliferating cells in the MBH.
(AD) Representative confocal images of HVZ stained as indicated in Control (A), Control+LiPR (B), HFD (C) and HFD + Liraglutide (Lira) (D) of 21d HFD group. Images in panels A and C are identical with representative confocal images in Fig. 2A and B and are shown for direct comparison with the control in both figures. (EG) Effects of LiPR on number of GFAP+ α-tanycytes per volume of MBH (E), the proportion of GFAP+Vimentin+ tanycytes (F) and the number of GFAP+ β-tanycytes in MBH (G). (HJ) Effects of Liraglutide on GFAP+ α-tanycytes (H), the proportion of GFAP+Vimentin+ tanycytes (I) and the number of GFAP+ β-tanycytes in MBH (J). (K,L) Representative confocal images of MBH stained for Ki67 in Control (K) and Control+LiPR (L) of 4mo treatment group. (M,N) Quantification of Ki67+ cells in the MBH (M) and in the ME (N) from Control+LiPR mice. (O,P) Quantification of Ki67+ (O) and PCNA+ cells (P) in the MBH of Liraglutide-treated mice. Data information: Scale bars: 50 μm. n = 5 mice (7d and 21d), n = 8 mice (4mo Control), n = 4 mice (4mo Control + LiPR). In panel P, One-Way ANOVA. In all other panels, Two-Way ANOVA (E: treatment F(1,17) = 59.74, p < 0.0001, duration F(1,17) = 16.87, p = 0.0007, interaction F(1,17) = 7.04, p = 0.017; J: treatment F(2,23) = 11.36, p = 0.0004, duration F(1,23) = 4.42, p = 0.047; M: treatment F(1,17) = 14.52, p = 0.0014, duration F(1,17) = 7.24, p = 0.016, interaction F(1,17) = 6.2, p = 0.023; N: treatment F(1,14) = 4481, p < 0.0001, duration F(1,14) = 4404, p < 0.0001, interaction F(1,14) = 6.2, p < 0.0001; O: treatment F(2,24) = 7.04, p < 0.0039, duration F(1,24) = 8.35, p < 0.0081, interaction F(2,24) = 3.01, p < 0.068; P: treatment F(2,17) = 10.11, p < 0.0013, duration F(1,17) = 21.99, p < 0.0002, interaction F(2,17) = 6.1, p < 0.01). *p < 0.05, **p < 0.01, ***p < 0.001 (Bonferroni’s test). Data are presented as mean ± SEM.
Figure EV2
Figure EV2. LiPR promotes neurogenesis in the SGZ.
(AD) Representative confocal images of the Dentate Gyrus (DG) of the hippocampus showing the Subgranular Zone (SGZ) stained as indicated in Control (A), HFD (B), HFD + LiPR (C) and HFD + Lira of 21d HFD group. (EH) Quantification of Ki67+ (E), PCNA+ cells (F), DCX+ neuroblasts (G) and DCX+ neurons (H) in SGZ for Control, HFD and HFD + LiPR. (IK) Cell quantification in SGZ as described for Control, HFD and HFD + Liraglutide. Data information: Scale bars: 50 μm. n = 5 mice per data set for 7d and 21d groups, n = 8 mice per data set for 4mo group. All panels, Two-Way ANOVA (E: treatment F(2,44) = 9.88, p = 0.0003, duration F(2,44) = 6.86, p = 0.0002, interaction F(4,44) = 9.88, p = 0.0003; F: treatment F(2,45) = 21.19, p < 0.0001, duration F(2,45) = 374.3, interaction F(4,45) = 9.88, p < 0.0001; G: treatment F(2,45) = 11.38, p < 0.0001, duration F(2,45) = 463.03, p < 0.0001; interaction F(4,45) = 6.25, p = 0.0004; H: treatment F(2,45) = 8.77, p = 0.0006, duration F(2,54) = 552.73, p < 0.0001, interaction F(4,45) = 3.78, p = 0.011; I: treatment F(2,24) = 4.3, p = 0.025,duration F(1,24) = 4.22, p = 0.05; J: treatment F(2,24) = 7.21, p = 0.0035, duration F(1,24) = 95.86, p < 0.0001; K treatment F(2,24) = 12.29, p = 0.0002, duration F(1,24) = 161.57, p < 0.0001, interaction F(2,24) = 5.96, p = 0.0079). *p < 0.05, **p < 0.01, ***p < 0.001 (Bonferroni’s test). Data are presented as mean ± SEM.
Figure EV3
Figure EV3. LiPR reduces proliferation of naïve neurospheres.
(A,B) Quantification of number of HVZ-derived neurospheres per 20.000 plated cells after 5d (A) and 10d (B) in culture. (C,D) Representative images of HVZ-derived neurospheres 5d in culture from Control (C) and Control + LiPR (D) treated mice. The Image in panel C is identical with the image in Fig. 3A and is shown for direct comparison with the control in both figures. (E,F) Quantification of diameter of neurospheres 5d (E) and 10d (F) in culture. (G-I) Relative mRNA fold change of Prlh (G), Prlhr (H) and Vimentin (I) compared to Gapdh in cDNA from MBH-derived neurospheres (10d in culture). (J) An example cell division tree from 4-day time-lapse imaging of aNSCs from HVZ of Control + LiPR treated mouse. (K) Quantification of the number of cell divisions per division tree. (L) Time-lapse quantification of active (dividing) clones per 20.000 plated cells. (M) Number of all active clones of HVZ aNSCs from Control or LiPR-treated mice exposed to Control or HFD. Active clones pooled from all observed time-lapse imaging regions of interests per given treatment group. (N) Proportion of active clones containing at least one apoptotic cell. (O) Cell cycle length from the time-lapse imaging in the 2nd observed cell division. Data information: Scale bar: 20 μm. In all panels, n = 3 mice per data set. In panel E, number of neurospheres: n = 26 (Control), 22 (Control+LiPR). In panel F, number of neurospheres: n = 66 (Control), 15 (Control+LiPR). For panel K,L, number of traced cells: n = 25 per data set. In panel O, number of traced cells: n = 47 (Control), 6 (Control+LiPR), 35 (HFD), 12 (HFD+LiPR). Fisher’s exact test (M,N), Un-paired two-tailed T-Test (EH,K,L,O) and Two-Way ANOVA with Bonferroni’s test (A,B,I). *p < 0.05, ***p < 0.001. Data are presented as mean ± SEM.
Figure EV4
Figure EV4. LiPR reduces proliferation of naïve htNSCs.
(A,B) Example cell division trees from 4-day time-lapse imaging of aNSCs from HVZ of Control (A) and hPrRP31-treated (B) cells. A schematic of the experimental protocol shown above. (C,D) Quantification of cells per clone (C) and divisions per clone (D). Data information: In all panels, n = 3 mice per data set. In panels C,D, number of traced clones: n = 10 (Control), 12 (Control+LiPR). Un-paired two-tailed T-Test. **p < 0.01. Data are presented as mean ± SEM.
Figure EV5
Figure EV5. Effects of LiPR on new adult-generated cells in shorter HFD protocols and in the context of Control Diet.
(AD, HK) Representative confocal images of HVZ and MBH stained as indicated in Control (A,H,P), HFD (B,I), HFD + LiPR (C,J), HFD + Liraglutide (Lira) (D,K) and Control Diet + LiPR (Q) of 7d (AD), 21d (HK) and 4mo (P,Q) groups. (EG) Quantification of BrdU+ cells (E), BrdU+ neurons (F) and BrdU+ astrocytes (G) in the MBH of 7d HFD group. (LN) Quantification of BrdU+ cells (L), BrdU+ neurons (M) and BrdU+ astrocytes (N) in the MBH parenchyma and BrdU+ neurons in the Arc (O) of 21d HFD group. (RT) Quantification of BrdU+ cells (R), BrdU+ neurons (S) and BrdU+ astrocytes (T) in MBH parenchyma of Control and Control Diet + LiPR treated mice of 21d and 4mo groups. Data information: Scale bars: 50 μm. n = 5 mice per data set (7d, 21d), n = 8 mice (Control 4mo), n = 4 mice (Control + LiPR 4mo) per data set. In panel O, Kruskal–Wallis test with Dunn’s test (H = 9.88, p = 0.02). In panels E–G and L–N, One-Way ANOVA with Tukey’s test (L: F(3,19) = 3.58, p = 0.038) or Bonferroni’s test (N: F(3,19) = 4.3, p = 0.021). In panels RT, Two-Way ANOVA with Bonferroni’s test (S: treatment F(1,18) = 5.71, p = 0.021; duration F(1,18) = 9.9, p = 0.0056; interaction F(1,18) = 6.43, p = 0.02; T: treatment F(1,17) = 1.32, p = 0.27; duration F(1,17) = 2.2, p = 0.15; interaction F(1,17) = 7.75, p = 0.013). *p < 0.05, ***p < 0.001. Data are presented as median ± SEM (O) or mean ± SEM (all other).

Similar articles

Cited by

References

    1. Adhikari A, Mainali P, Davie JK. JARID2 and the PRC2 complex regulate the cell cycle in skeletal muscle. J Biol Chem. 2019;294:19451–19464. doi: 10.1074/jbc.RA119.010060. - DOI - PMC - PubMed
    1. Alarcon C, Zaromytidou AI, Xi Q, Gao S, Yu J, Fujisawa S, Barlas A, Miller AN, Manova-Todorova K, Macias MJ, et al. Nuclear CDKs drive Smad transcriptional activation and turnover in BMP and TGF-beta pathways. Cell. 2009;139:757–769. doi: 10.1016/j.cell.2009.09.035. - DOI - PMC - PubMed
    1. Andrews S (2010). FastQC: a quality control tool for high throughput sequence data., Babraham Bioinformatics Institute
    1. Arai I, Tsuji M, Takeda H, Akiyama N, Saito S. Capsaicin suppresses interleukin-31-induced itching partially involved in inhibiting the expression of dorsal root ganglion interleukin-31 receptor A in male mice. Neurobiol Pain. 2022;11:100088. doi: 10.1016/j.ynpai.2022.100088. - DOI - PMC - PubMed
    1. Ard J, Fitch A, Fruh S, Herman L. Weight loss and maintenance related to the mechanism of action of glucagon-like peptide 1 receptor agonists. Adv Ther. 2021;38:2821–2839. doi: 10.1007/s12325-021-01710-0. - DOI - PMC - PubMed