

Identification of clinical prognostic factors and analysis of ferroptosis-related gene signatures in the bladder cancer immune microenvironment
- PMID: 38172792
- PMCID: PMC10765654
- DOI: 10.1186/s12894-023-01354-y
Identification of clinical prognostic factors and analysis of ferroptosis-related gene signatures in the bladder cancer immune microenvironment
Abstract
Background: Bladder cancer (BLCA) is a prevalent malignancy affecting the urinary system and poses a significant burden in terms of both incidence and mortality rates on a global scale. Among all BLCA cases, non-muscle invasive bladder cancer constitutes approximately 75% of the total. In recent years, the concept of ferroptosis, an iron-dependent form of regulated cell death marked by the accumulation of lipid peroxides, has captured the attention of researchers worldwide. Nevertheless, the precise involvement of ferroptosis-related genes (FRGs) in the anti-BLCA response remains inadequately elucidated.
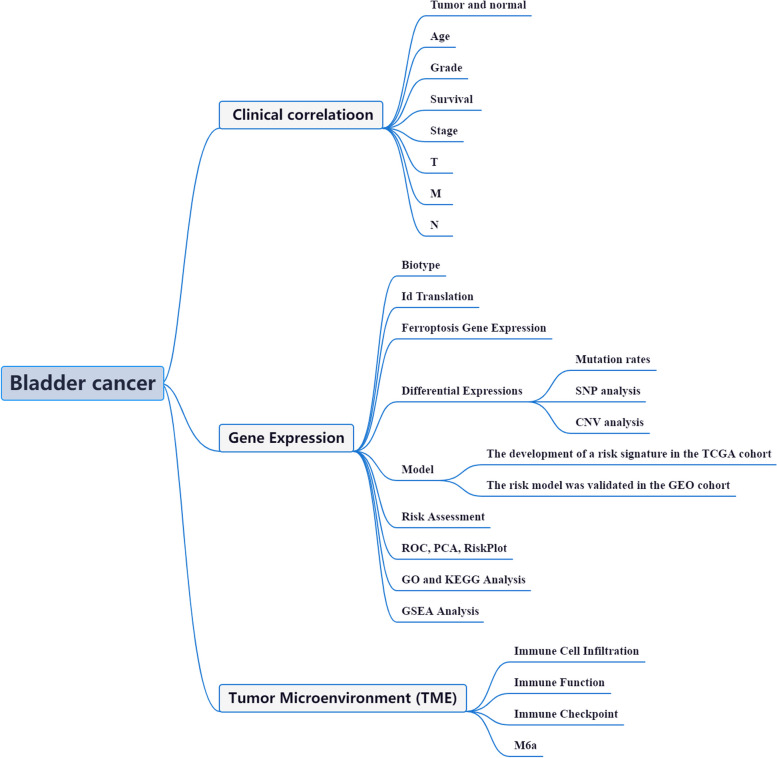
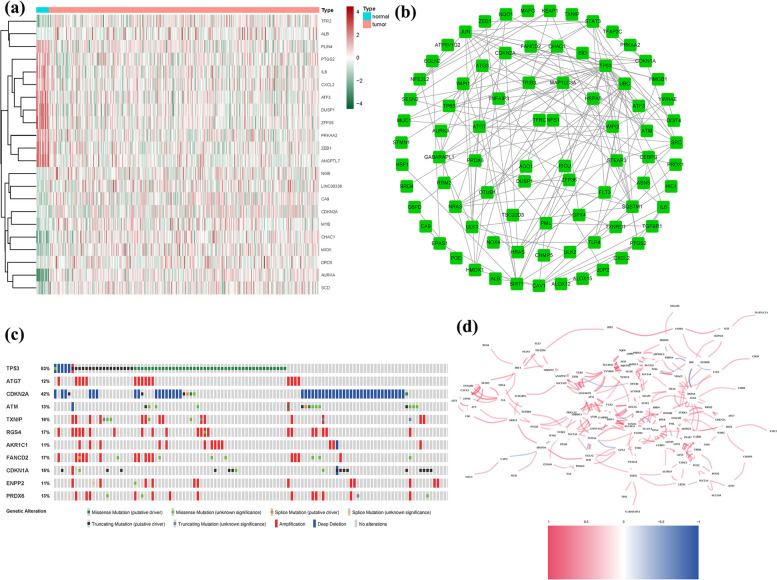
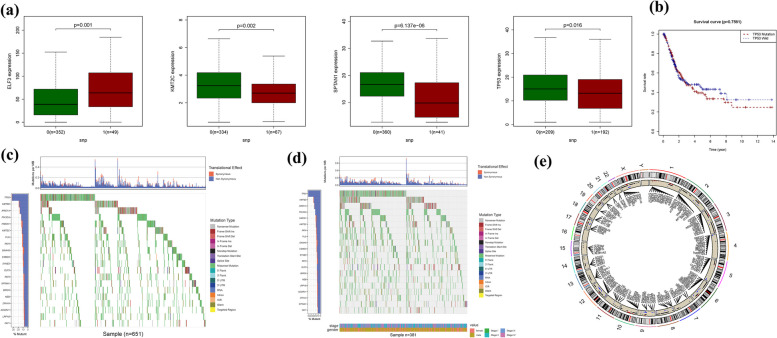
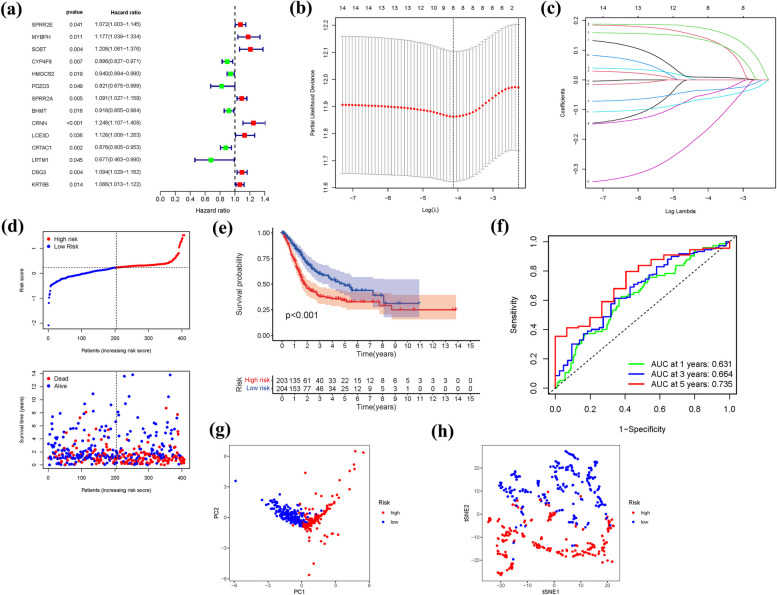
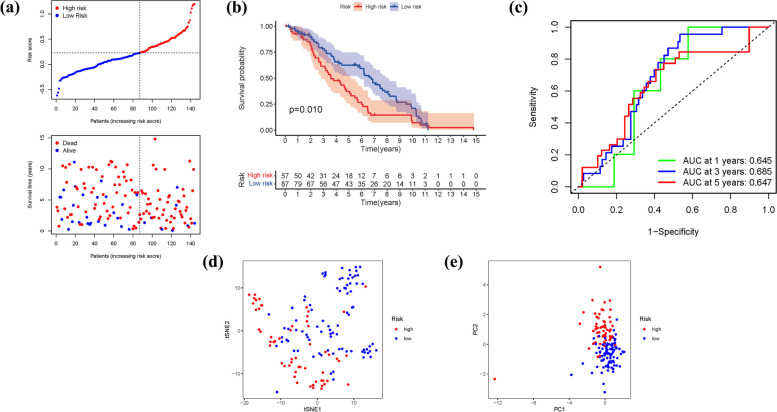
Methods: The integration of BLCA samples from the TCGA and GEO datasets facilitated the quantitative evaluation of FRGs, offering potential insights into their predictive capabilities. Leveraging the wealth of information encompassing mRNAsi, gene mutations, CNV, TMB, and clinical features within these datasets further enriched the analysis, augmenting its robustness and reliability. Through the utilization of Lasso regression, a prediction model was developed, enabling accurate prognostic assessments within the context of BLCA. Additionally, co-expression analysis shed light on the complex relationship between gene expression patterns and FRGs, unraveling their functional relevance and potential implications in BLCA.
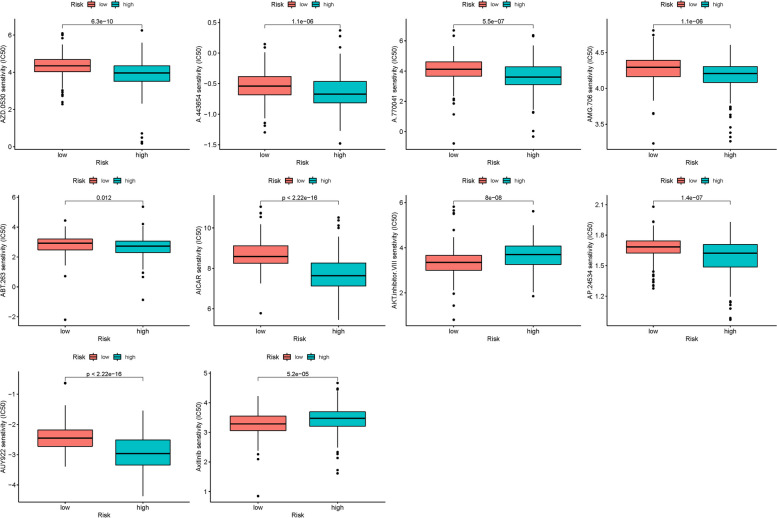
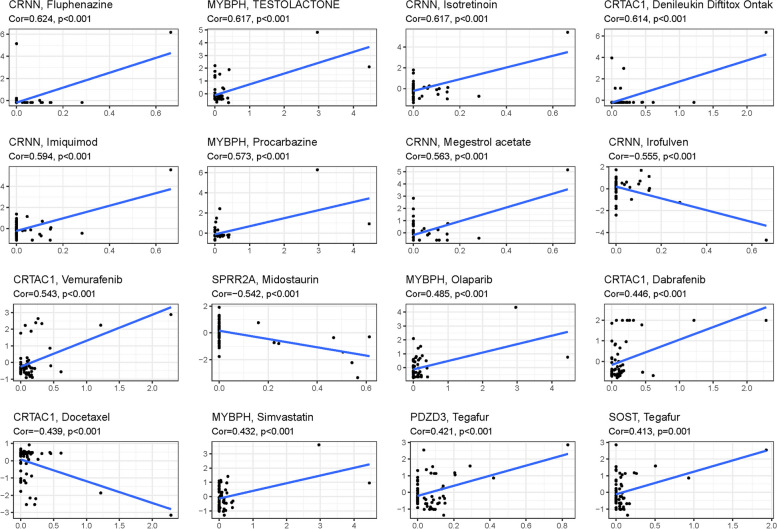
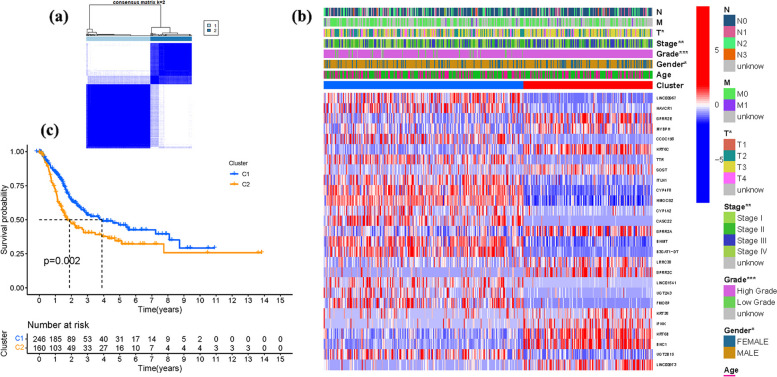
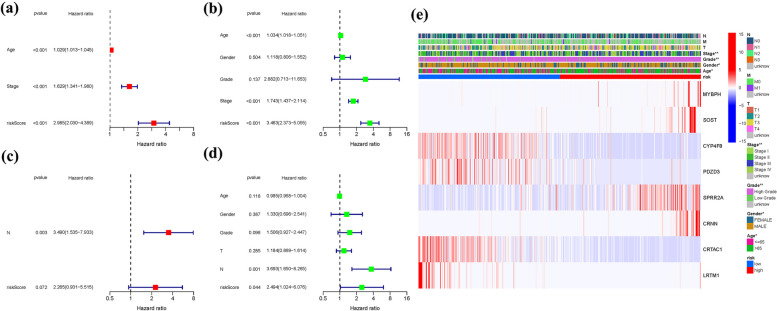
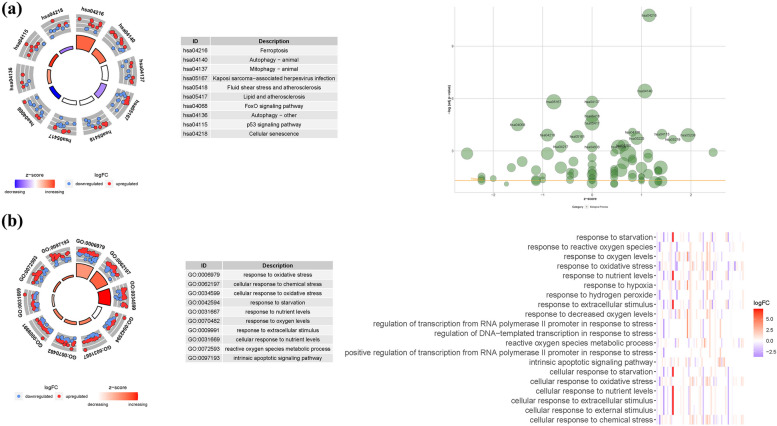
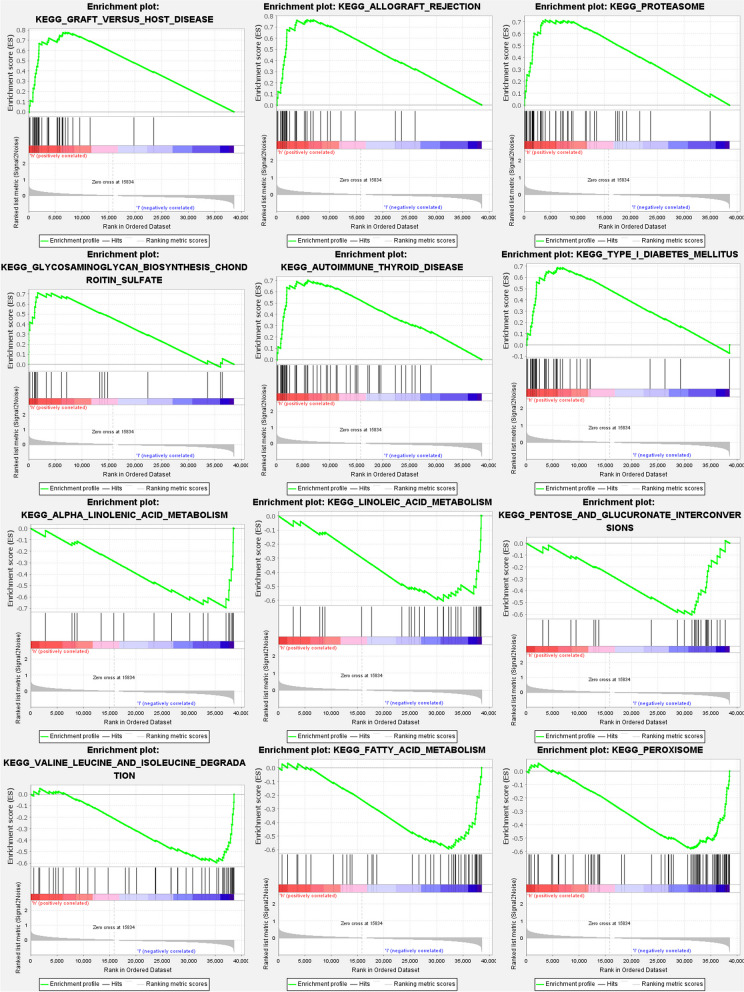
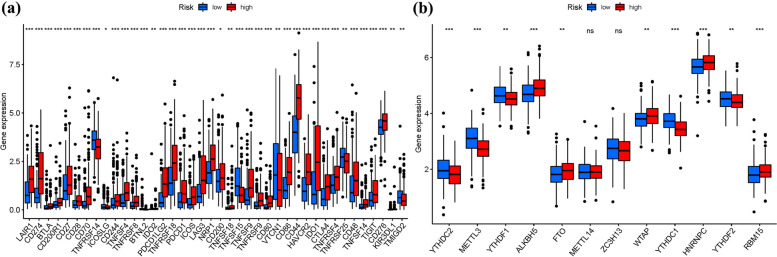
Results: FRGs exhibited increased expression levels in the high-risk cohort of BLCA patients, even in the absence of other clinical indicators, suggesting their potential as prognostic markers. GSEA revealed enrichment of immunological and tumor-related pathways specifically in the high-risk group. Furthermore, notable differences were observed in immune function and m6a gene expression between the low- and high-risk groups. Several genes, including MYBPH, SOST, SPRR2A, and CRNN, were found to potentially participate in the oncogenic processes underlying BLCA. Additionally, CYP4F8, PDZD3, CRTAC1, and LRTM1 were identified as potential tumor suppressor genes. Significant discrepancies in immunological function and m6a gene expression were observed between the two risk groups, further highlighting the distinct molecular characteristics associated with different prognostic outcomes. Notably, strong correlations were observed among the prognostic model, CNVs, SNPs, and drug sensitivity profiles.
Conclusions: FRGs are associated with the onset and progression of BLCA. A FRGs signature offers a viable alternative to predict BLCA, and these FRGs show a prospective research area for BLCA targeted treatment in the future.
Keywords: BLCA; CNV; Drug prediction; FRGs; Immunity; SNP; m6a and immune checkpoint.
© 2023. The Author(s).
Conflict of interest statement
The authors declare no competing interests.
Figures

Similar articles
-
Development and validation of prognostic index based on purine metabolism genes in patients with bladder cancer.Front Med (Lausanne). 2023 Sep 14;10:1193133. doi: 10.3389/fmed.2023.1193133. eCollection 2023. Front Med (Lausanne). 2023. PMID: 37780567 Free PMC article.
-
Ferroptosis-related genes prognostic signature for pancreatic cancer and immune infiltration: potential biomarkers for predicting overall survival.J Cancer Res Clin Oncol. 2023 Dec;149(20):18119-18134. doi: 10.1007/s00432-023-05478-4. Epub 2023 Nov 25. J Cancer Res Clin Oncol. 2023. PMID: 38007403
-
A novel survival model based on a Ferroptosis-related gene signature for predicting overall survival in bladder cancer.BMC Cancer. 2021 Aug 21;21(1):943. doi: 10.1186/s12885-021-08687-7. BMC Cancer. 2021. PMID: 34418989 Free PMC article.
-
Generalized machine learning based on multi-omics data to profile the effect of ferroptosis pathway on prognosis and immunotherapy response in patients with bladder cancer.Environ Toxicol. 2024 Feb;39(2):680-694. doi: 10.1002/tox.23949. Epub 2023 Aug 30. Environ Toxicol. 2024. PMID: 37647346
-
Pyrimidine metabolism regulator-mediated molecular subtypes display tumor microenvironmental hallmarks and assist precision treatment in bladder cancer.Front Oncol. 2023 Aug 17;13:1102518. doi: 10.3389/fonc.2023.1102518. eCollection 2023. Front Oncol. 2023. PMID: 37664033 Free PMC article.
Cited by
-
Development of a propionate metabolism-related gene-based molecular subtypes and scoring system for predicting prognosis in bladder cancer.Eur J Med Res. 2024 Jul 29;29(1):393. doi: 10.1186/s40001-024-01982-6. Eur J Med Res. 2024. PMID: 39075554 Free PMC article.
-
Prognostic Significance and Immune Landscape of an Efferocytosis-Related Gene Signature in Bladder Cancer.Biochem Genet. 2024 Sep 23. doi: 10.1007/s10528-024-10924-0. Online ahead of print. Biochem Genet. 2024. PMID: 39313721
References
-
- Buisan O, Orsola A, Oliveira M, Martinez R, Etxaniz O, Areal J, Ibarz L. Role of Inflammation in the Perioperative Management of Urothelial Bladder Cancer With Squamous-Cell Features: Impact of Neutrophil-to-Lymphocyte Ratio on Outcomes and Response to Neoadjuvant Chemotherapy. Clin Genitourin Cancer. 2017;15(4):e697–e706. doi: 10.1016/j.clgc.2017.01.024. - DOI - PubMed
-
- DeGeorge KC, Holt HR, Hodges SC. Bladder cancer: diagnosis and treatment. Am Fam Physician. 2017;96(8):507–514. - PubMed
MeSH terms
Substances
Grants and funding
LinkOut - more resources
Full Text Sources
Medical
Miscellaneous
