. 2024 Jan 3;14(1):329.
doi: 10.1038/s41598-023-51028-w.

Colorectal cancer with low SLC35A3 is associated with immune infiltrates and poor prognosis

Affiliations

Colorectal cancer with low SLC35A3 is associated with immune infiltrates and poor prognosis

Shuai Lu et al. Sci Rep. .

Abstract

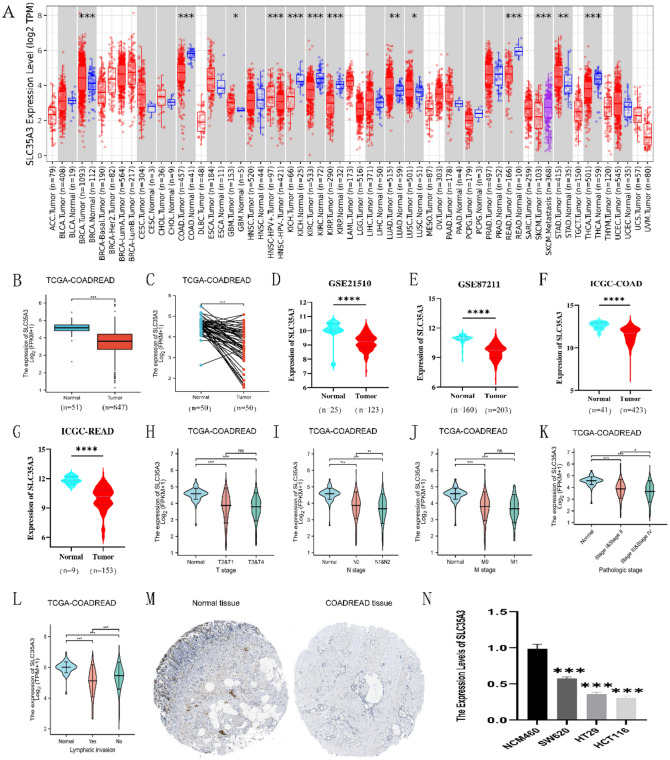
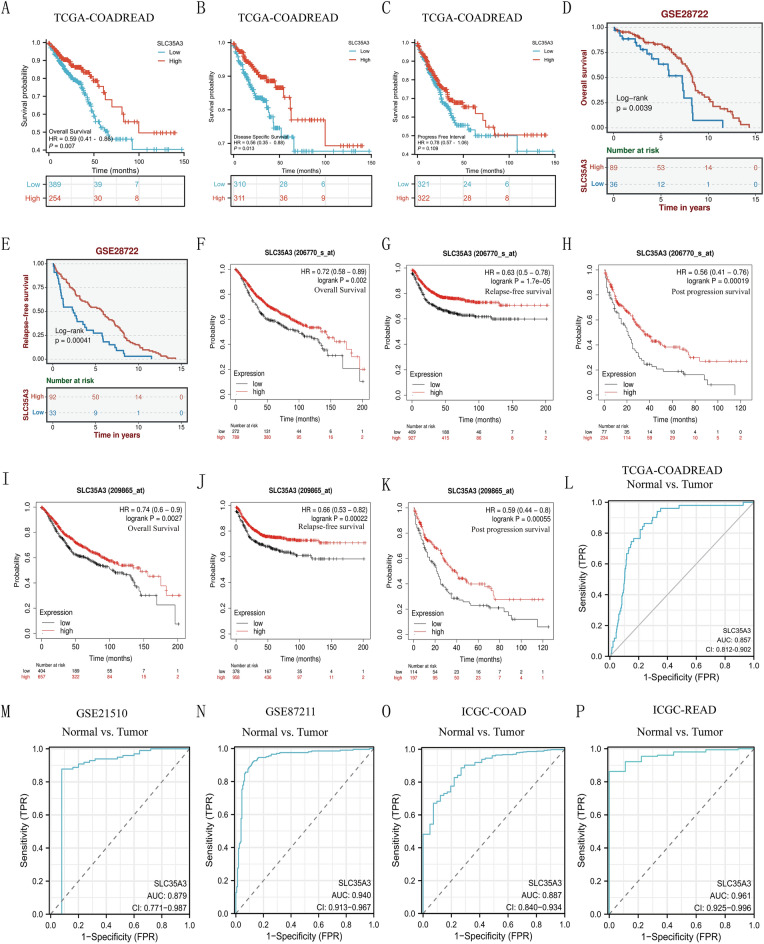
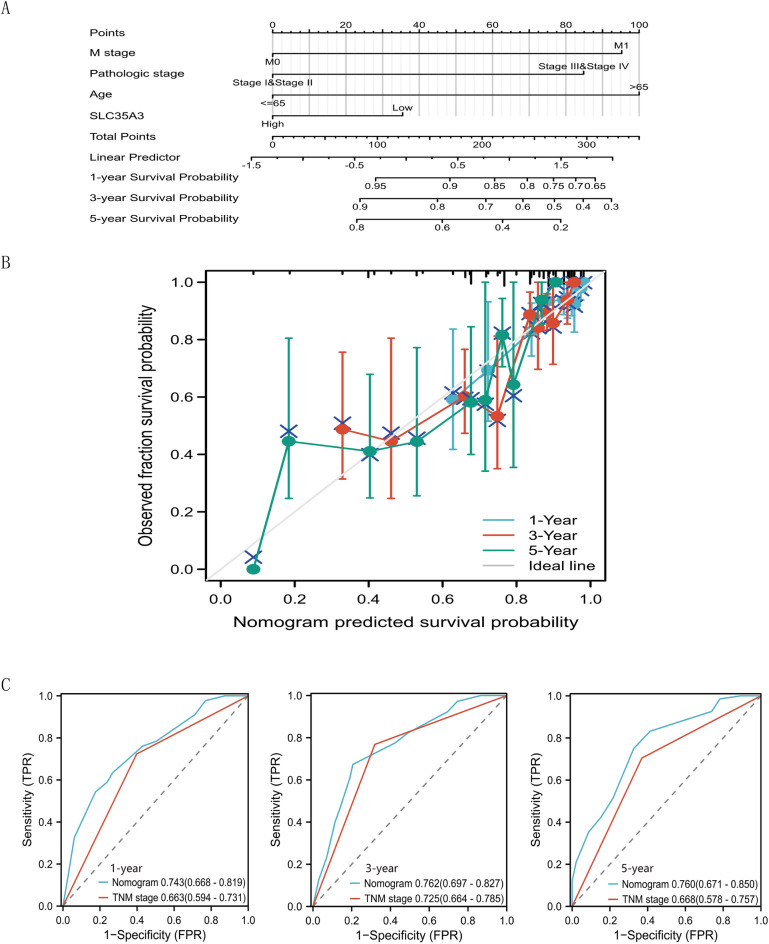
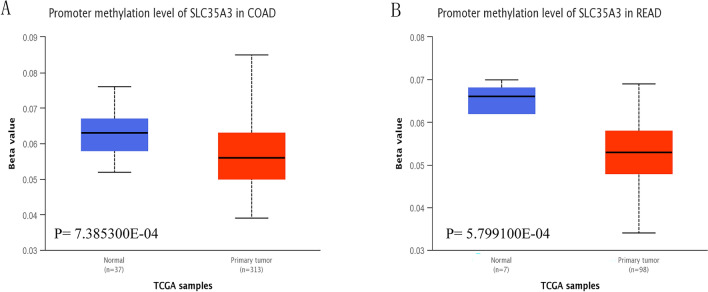
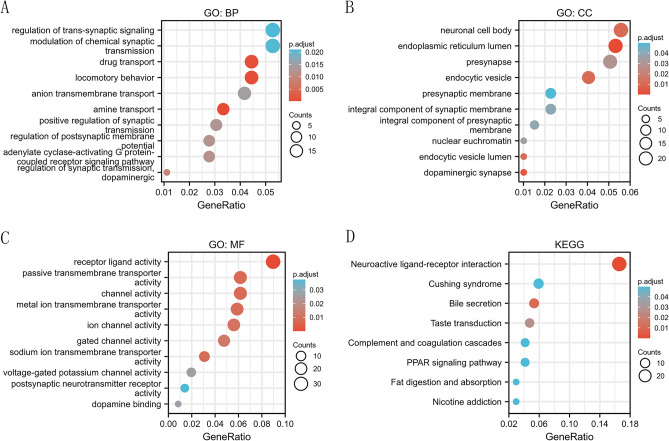
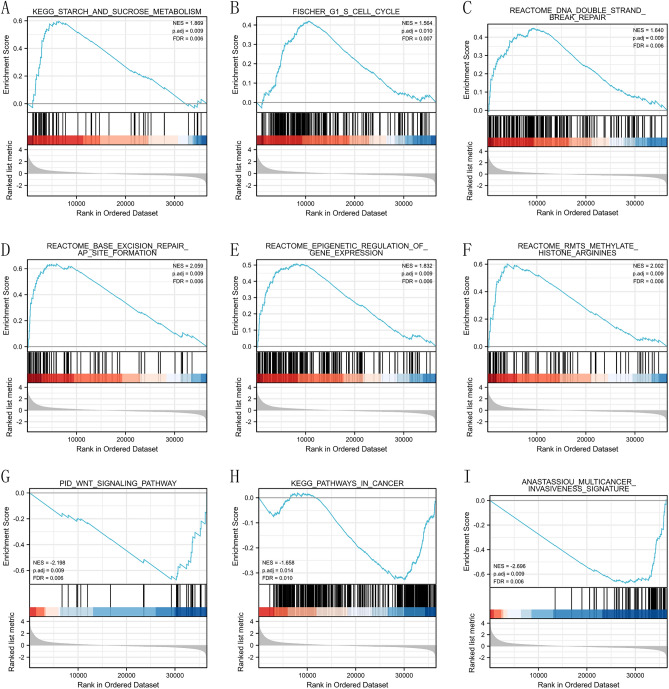
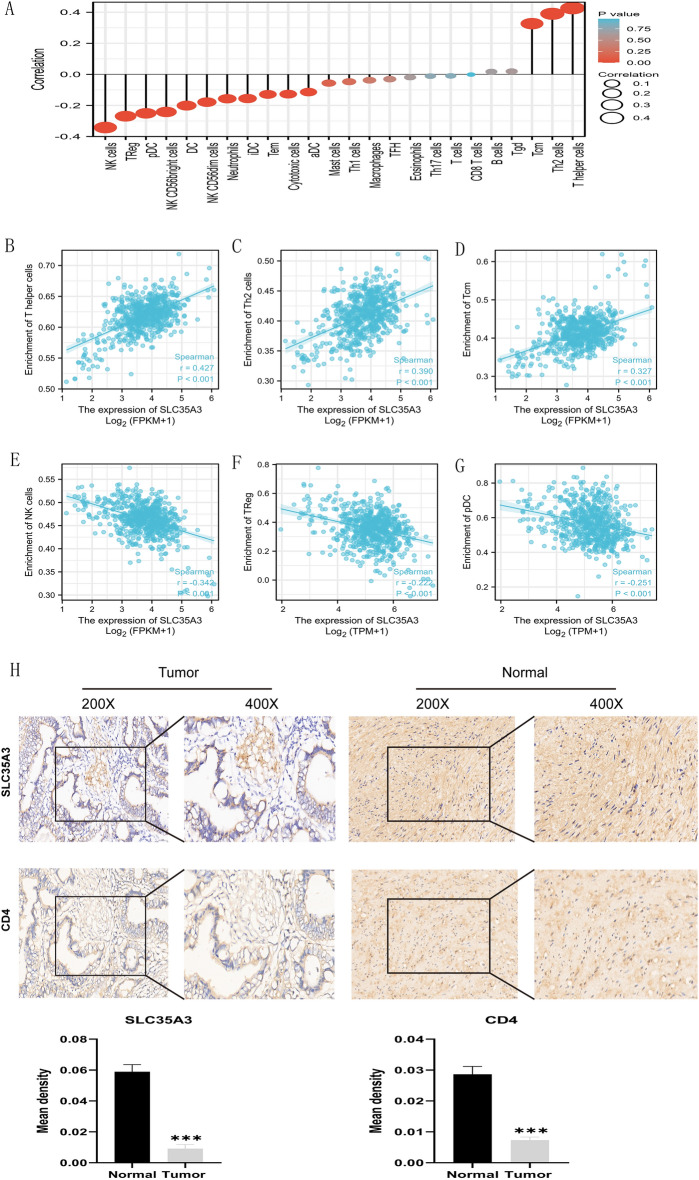
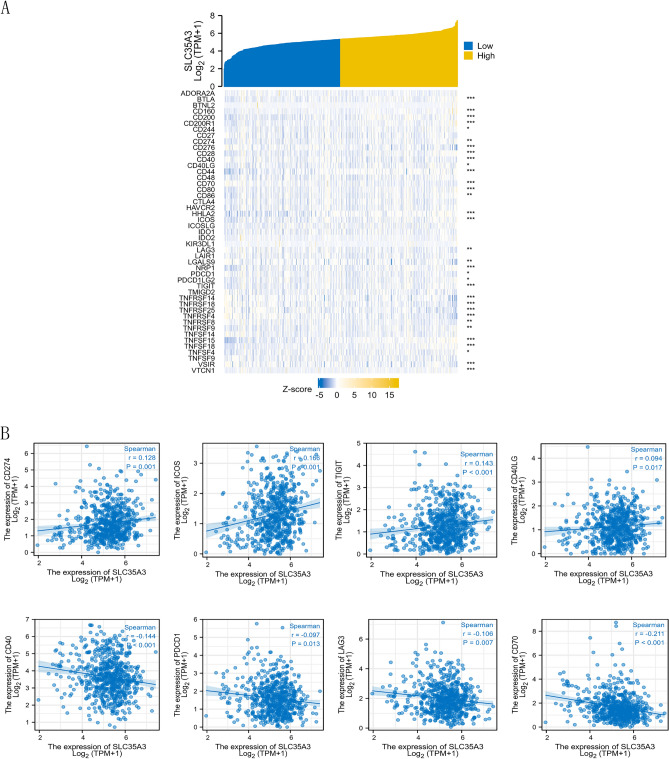
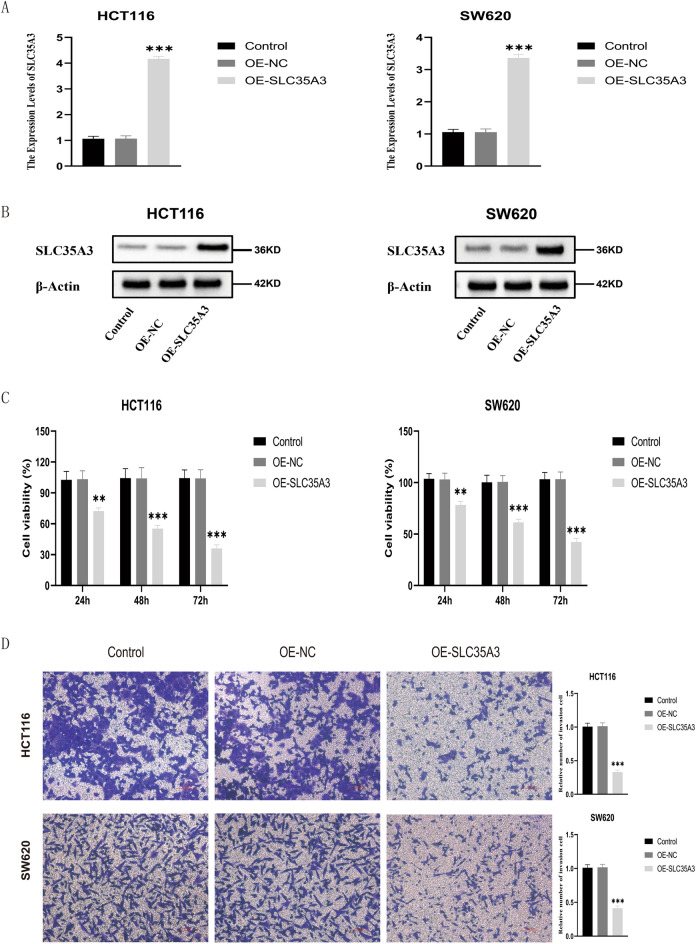
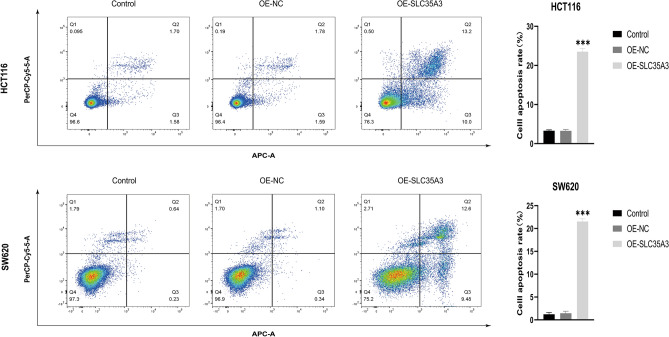
The expression level of SLC35A3 is associated with the prognosis of many cancers, but its role in colorectal cancer (CRC) is unclear. The purpose of our study was to elucidate the role of SLC35A3 in CRC. The expression levels of SLC35A3 in CRC were evaluated through tumor immune resource assessment (TIMER), The Cancer Genome Atlas (TCGA), Gene Expression Omnibus (GEO), International Cancer Genome Consortium (ICGC), Human Protein Atlas (HPA), qRT-PCR, and immunohistochemical evaluation. TCGA, GEO, and ICGC databases were used to analyze the diagnostic and prognostic value of SLC35A3 in CRC. A overall survival (OS) model was constructed and validated based on the expression level of SLC35A3 and multivariable analysis results. The cBioPortal tool was used to analyze SLC35A3 mutation in CRC. The UALCAN tool was used to analyze the promoter methylation level of SLC35A3 in colorectal cancer. In addition, the role of SLC35A3 in CRC was determined through GO analysis, KEGG analysis, gene set enrichment analysis (GSEA), immune infiltration analysis, and immune checkpoint correlation analysis. In vitro experiments validated the function of SLC35A3 in colorectal cancer cells. Compared with adjacent normal tissues and colonic epithelial cells, the expression of SLC35A3 was decreased in CRC tissues and CRC cell lines. Low expression of SLC35A3 was associated with N stage, pathological stage, and lymphatic infiltration, and it was unfavorable for OS, disease-specific survival (DSS), recurrence-free survival (RFS), and post-progression survival (PPS). According to the Receiver Operating Characteristic (ROC) analysis, SLC35A3 is a potential important diagnostic biomarker for CRC patients. The nomograph based on the expression level of SLC35A3 showed a better predictive model for OS than single prognostic factors and TNM staging. SLC35A3 has multiple types of mutations in CRC, and its promoter methylation level is significantly decreased. GO and KEGG analysis indicated that SLC35A3 may be involved in transmembrane transport protein activity, cell communication, and interaction with neurotransmitter receptors. GSEA revealed that SLC35A3 may be involved in energy metabolism, DNA repair, and cancer pathways. In addition, SLC35A3 was closely related to immune cell infiltration and immune checkpoint expression. Immunohistochemistry confirmed the positive correlation between SLC35A3 and helper T cell infiltration. In vitro experiments showed that overexpression of SLC35A3 inhibited the proliferation and invasion capability of colorectal cancer cells and promoted apoptosis. The results of this study indicate that decreased expression of SLC35A3 is closely associated with poor prognosis and immune cell infiltration in colorectal cancer, and it can serve as a promising independent prognostic biomarker and potential therapeutic target.


Conflict of interest statement

The authors declare no competing interests.

Figures

Figure 1
Figure 1
Expression of SLC35A3 in CRC analyzed from TIMER, TCGA, GEO, ICGC, HPA databases, and cell experiments. (A) Expression of SLC35A3 in different cancer types from TIMER database. (B) Significant decrease in SLC35A3 mRNA expression in CRC tumor tissue compared to normal tissue in TCGA-COADREAD dataset. (C) Significant decrease in expression of SLC35A3 mRNA in paired CRC tumor tissue compared to adjacent normal tissue in TCGA-COADREAD dataset. (D, E) Significantly lower expression of SLC35A3 mRNA in CRC tumor tissue compared to normal tissue in GSE21510 and GSE87211 datasets. (F, G) Significant decrease in expression of SLC35A3 mRNA in CRC tumor tissue compared to normal tissue in ICGC database. (HL) Analysis of SLC35A3 mRNA expression based on T (H), N (I), M (J), pathological staging (K), and lymph node infiltration (L) in TCGA-COADREAD dataset. (M) Protein expression of SLC35A3 in normal colon tissue and colon cancer tissue based on HPA database. (N) Compared with normal colon epithelial cells NCM460, the expression level of SLC35A3 in colorectal cancer cells (including SW620, HT-29, HCT116) is reduced. Analysis was performed using the Wilcoxon rank sum test (A, B, DL), the paired t test (C) and the ANOVA (N). ns denotes p > 0.05, *p < 0.05, **p < 0.01, ***p < 0.001 and ****p < 0.0001.
Figure 2
Figure 2
Decreased expression of SLC35A3 in clinical CRC tissue. (A) qRT-PCR analysis of cancer tissue and adjacent normal tissue samples from CRC patients. (B) Representative images showing protein expression of SLC35A3 in paraffin-embedded CRC tissue and adjacent normal tissue. Analysis was performed using the paired t test and ***p < 0.001.
Figure 3
Figure 3
Prognostic and Diagnostic value of SLC35A3 in CRC. (AC) Survival curves from TCGA-CADREAD dataset showing OS, PFI and DSS of patients with low or high expression of SLC35A3. (D, E) Analysis of GSE28782 dataset showing better OS and RFS in patients with high expression of SLC35A3 compared to those with low expression. (FK) Further validation of clinical data from CRC patients in Kaplan–Meier Plotter database, demonstrating significantly better OS, RFS, and PPS in patients with high expression of SLC35A3 compared to those with low expression. (LP) ROC analysis based on CRC datasets from TCGA, GEO, and ICGC databases, indicating accurate discrimination between CRC tumor tissue and normal tissue based on SLC35A3 expression; AUC area under the curve, OS overall survival, DSS disease-specific survival, PFI progression-free interval, RFS relapse-free survival, PPS post-progression survival, CRC colorectal cancer, T tumor distribution, N lymph node metastasis, M distant metastasis. CI 95% confidence interval. Analysis was performed using the Cox regression analysis (AC) and the Log-rank test (DK).
Figure 4
Figure 4
Construction and validation of column charts based on SLC35A3 expression levels. (A) The nomograph for predicting OS probability of CRC patients at 1, 3, and 5 years. (B) A nomograph calibration map that predicts OS possibilities. (C) Nomogram demonstrating the prognostic value of SLC35A3 in CRC, which exceeds that of TNM staging. OS: overall survival.
Figure 5
Figure 5
SLC35A3 mutations in CRC. (A, B) The cBioPortal tool was used to displays the mutation frequency (A) and mutation sites (B) of SLC35A3 in CRC. (C) Three-dimensional protein structure of SLC35A3.
Figure 6
Figure 6
The promoter methylation level of SLC35A3 in colorectal cancer tissues and adjacent normal tissues. UALCAN tool was used to analyze the promoter methylation level of SLC35A3 gene in colon cancer and its adjacent normal tissues (A) and rectal cancer and its adjacent normal tissues (B).
Figure 7
Figure 7
Go and KEGG enrichment analysis of differential genes in CRC tissues of low SLC35A3 group and high SLC35A3 group. (AC) GO enrichment analysis showed that BP (biological process), CC (cellular component) and MF (molecular function) of differential genes in low SLC35A3 group and high SLC35A3 group. (D) KEGG metabolic pathway enriched by different genes in low SLC35A3 group and high SLC35A3 group.
Figure 8
Figure 8
Enrichment results of gene set enrichment analysis (GSEA). (A) Starch and sucrose metabolism pathway, (B) G1, S cell cycle, (C) DNA double strand break repair, (D) base excision repair, (E) epigenetic regulation of gene expression, (F) histone arginine methylation, (G) WNT signal pathway, (H) cancer pathway, and (I) multiple cancer invasive characteristics were significantly enriched in SLC35A3-related CRC. NES, normalized enrichment fraction; FDR, false discovery rate.
Figure 9
Figure 9
Correlation analysis between SLC35A3 expression and immune infiltration. (A) Relationship between SLC35A3 expression and infiltration of tumor-infiltrating lymphocytes in 24 cases. (BG) Correlation between SLC35A3 expression and immune infiltration levels of T helper cells (B), Th2 cells (C), Tcm cells (D), NK cells (E), Treg cells (F), and pDC cells (G). (H) Immunohistochemistry results showing downregulation of SLC35A3 and CD4 expression in colon cancer tissue compared to adjacent normal tissue. Spearman correlation analysis (AG) and the paired t test (H) was conducted, *** p < 0.001.
Figure 10
Figure 10
Correlation analysis between SLC35A3 and immune checkpoints based on the TCGA-COADREAD dataset. (A) Correlation heatmap between SLC35A3 expression and immune checkpoint. (B) The expression of SLC35A3 is associated with 8 immune checkpoints (CD274, ICOS, TIGIT, CD40LG, CD40, PDCD1, LAG3, CD70). Spearman correlation analysis was conducted.
Figure 11
Figure 11
Overexpression of SLC35A3 significantly inhibits proliferation and invasion of colorectal cancer cells (HCT116 and SW620). (A, B) After plasmid transfection, significant upregulation of SLC35A3 mRNA (A) and protein (B) levels in HCT116 and SW620 cells of OE-SLC35A3 group. (C, D) Overexpression of SLC35A3 significantly suppresses the proliferation (C) and invasion (D) abilities of HCT116 and SW620 cells. Three biological replicates were performed, and the results were subjected to statistical analysis. Analysis was performed using the ANOVA (A, C, D), **p < 0.01, ***p < 0.001.
Figure 12
Figure 12
Overexpression of SLC35A3 significantly promotes apoptosis of colorectal cancer cells (HCT116 and SW620). Three biological replicates were performed, and the results were subjected to statistical analysis. Analysis was performed using the ANOVA, ***p < 0.001.

Similar articles

Cited by

References

    1. Sung H, Ferlay J, Siegel RL, Laversanne M, Soerjomataram I, Jemal A, Bray F. Global cancer statistics 2020: GLOBOCAN estimates of incidence and mortality worldwide for 36 cancers in 185 countries. CA Cancer J. Clin. 2021;71(3):209–249. doi: 10.3322/caac.21660. - DOI - PubMed
    1. Jemal A, Bray F, Center MM, Ferlay J, Ward E, Forman D. Global cancer statistics. CA A Cancer J. Clin. 2011;61(2):69–90. doi: 10.3322/caac.20107. - DOI - PubMed
    1. Simon K. Colorectal cancer development and advances in screening. Clin. Interv. Aging. 2016;11:967–976. doi: 10.2147/CIA.S109285. - DOI - PMC - PubMed
    1. Kuipers EJ, Grady WM, Lieberman D, Seufferlein T, Sung JJ, Boelens PG, et al. Colorectal Cancer. Nat. Rev. Dis. Prim. 2015;1:15065. doi: 10.1038/nrdp.2015.65. - DOI - PMC - PubMed
    1. Brown KGM, Solomon MJ. Progress and future direction in the management of advanced colorectal cancer. Br. J. Surg. 2018;105(6):615–617. doi: 10.1002/bjs.10759. - DOI - PubMed