. 2024 Jan 5;10(1):eadj4686.
doi: 10.1126/sciadv.adj4686. Epub 2024 Jan 3.

S100A9 exerts insulin-independent antidiabetic and anti-inflammatory effects

Affiliations

S100A9 exerts insulin-independent antidiabetic and anti-inflammatory effects

Gloria Ursino et al. Sci Adv. .

Abstract

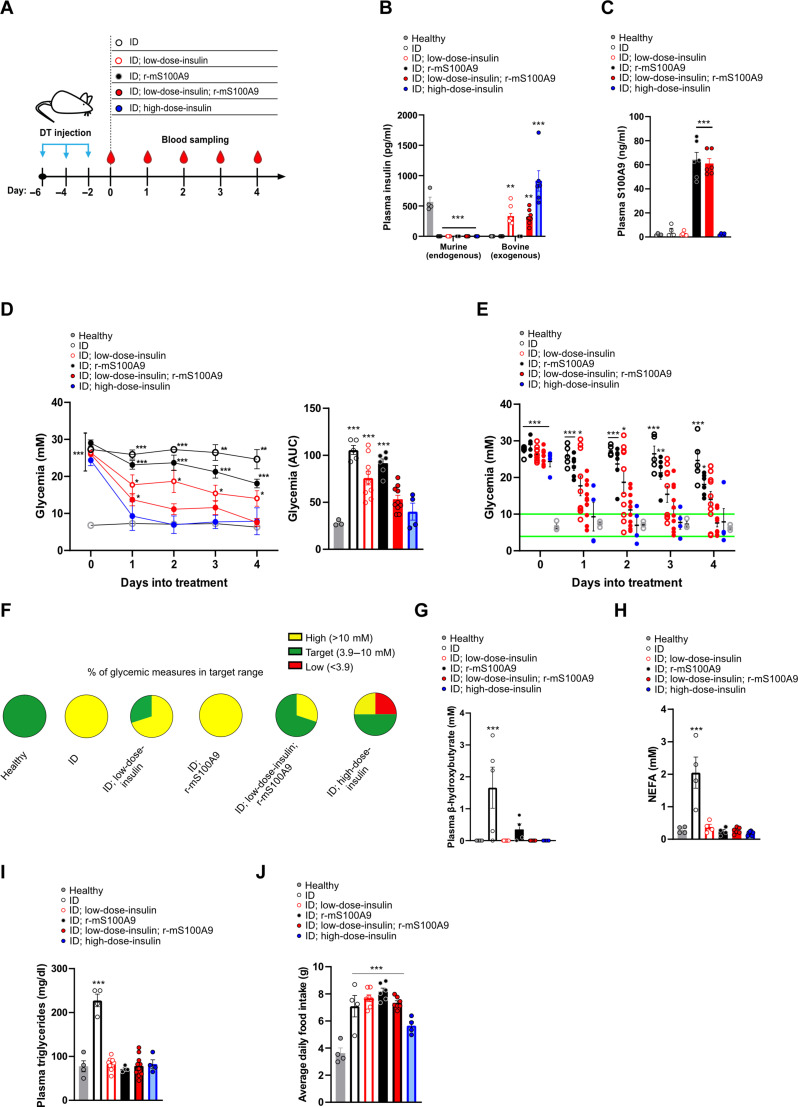
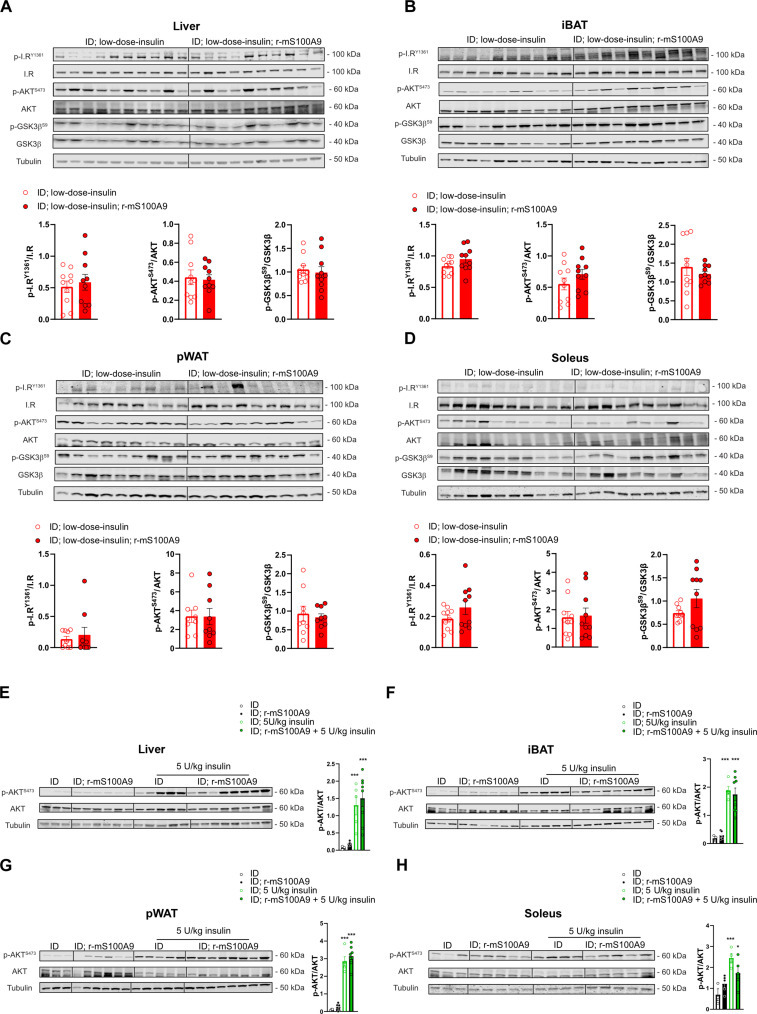
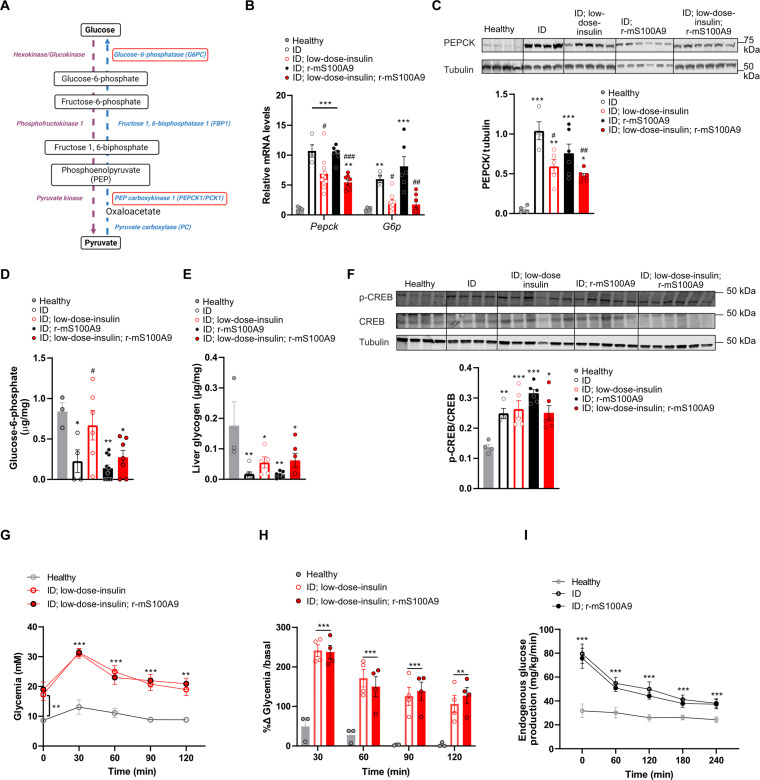
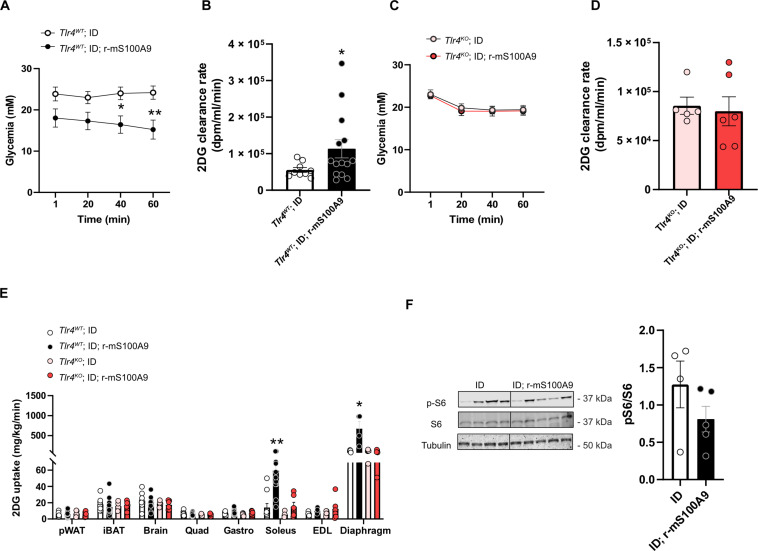
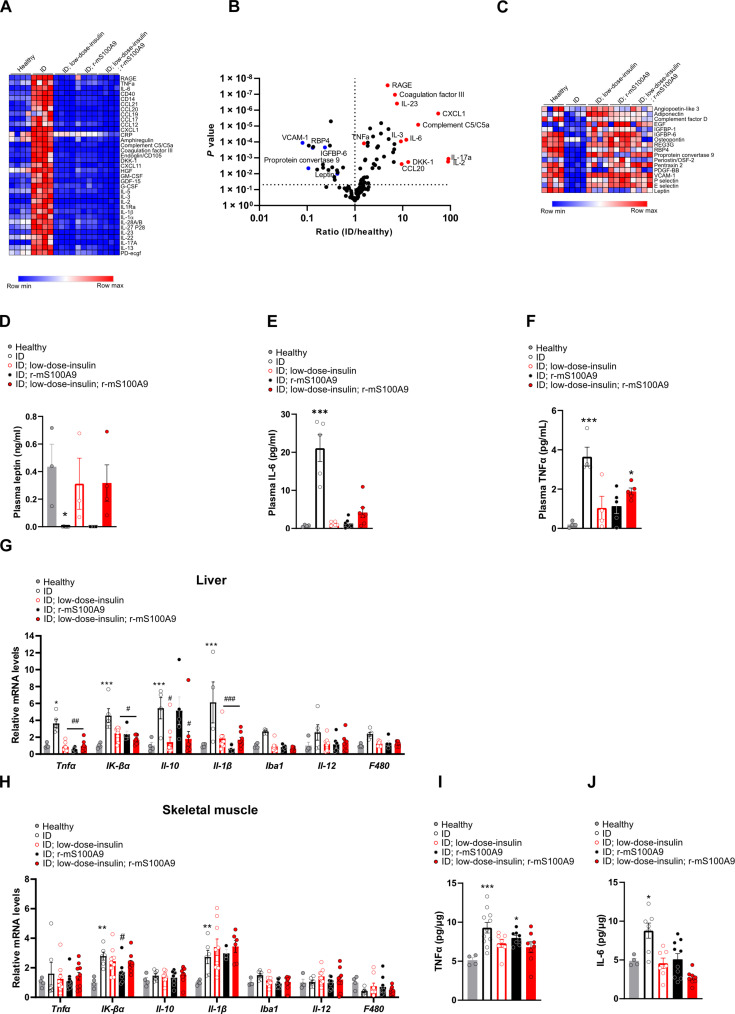
Type 1 diabetes mellitus (T1DM) is characterized by insulin deficiency leading to hyperglycemia and several metabolic defects. Insulin therapy remains the cornerstone of T1DM management, yet it increases the risk of life-threatening hypoglycemia and the development of major comorbidities. Here, we report an insulin signaling-independent pathway able to improve glycemic control in T1DM rodents. Co-treatment with recombinant S100 calcium-binding protein A9 (S100A9) enabled increased adherence to glycemic targets with half as much insulin and without causing hypoglycemia. Mechanistically, we demonstrate that the hyperglycemia-suppressing action of S100A9 is due to a Toll-like receptor 4-dependent increase in glucose uptake in specific skeletal muscles (i.e., soleus and diaphragm). In addition, we found that T1DM mice have abnormal systemic inflammation, which is resolved by S100A9 therapy alone (or in combination with low insulin), hence uncovering a potent anti-inflammatory action of S100A9 in T1DM. In summary, our findings reveal the S100A9-TLR4 skeletal muscle axis as a promising therapeutic target for improving T1DM treatment.


Figures

Fig. 1.
Fig. 1.. r-mS100A9 improves metabolic control with reduced insulin needs and risk of hypoglycemia in ID.
(A) Scheme indicating the generation and treatment of the indicated experimental groups (n = 4 to 10 per group). ID was achieved by three intraperitoneal DT administrations (at days −6, −4, and −2) in RIP-DTR mice. At day 0, mice were implanted with either half a bovine insulin pellet (ID; low-dose-insulin and ID; low-dose-insulin; r-mS100A9 mice), a full bovine insulin pellet (ID; high-dose-insulin mice), or sham pellet (ID and ID; r-mS100A9 mice). Starting from day 1, mice were subcutaneously injected twice daily with either 100 μl of saline (ID, ID; low-dose insulin and ID; high-dose-insulin mice) or recombinant murine S100A9 (r-mS100A9; 1.2 mg/kg per injection in 100 μl of saline. ID; r-mS100A9 and ID; low-dose-insulin; r-mS100A9 mice). Metabolic parameters were followed over 4 consecutive days of treatment. (B) Plasma levels of endogenous (murine) and exogenous (bovine) insulin in indicated groups at day 4. (C) Plasma S100A9 levels in indicated groups at day 4. (D) Average daily glycemia and corresponding area under the curve (AUC) of indicated treatment groups. (E) Individual glycemic values of indicated treatment groups. Green lines represent the lower and upper limits of the target glycemic range (3.9 to 10 mM). (F) Percent of glycemic measures in the target range over a treatment period of the indicated groups. (G) Plasma β-hydroxybutyrate, (H) non-esterified fatty acids, (I) triglycerides, and (J) average daily food intake of the same groups indicated in (A) (n = 4 to 10 per group). Error bars represent SEM, and statistical analyses were done using one-way ANOVA or two-way ANOVA (Tukey’s post hoc test) when more than two groups and more than one experimental condition/time point were compared. * indicates comparison to healthy controls. *P < 0.05, **P < 0.01, and ***P < 0.001.
Fig. 2.
Fig. 2.. r-mS100A9 does not enhance insulin signaling.
Immunoblots and densitometry analysis of represented proteins from liver (A), interscapular brown adipose tissue (iBAT) (B), perigonadal white adipose tissue (pWAT) (C), and soleus muscle (D) of ID; low-dose-insulin and ID; low-dose-insulin; r-mS100A9 (n = 9 to 10 per group) as in Fig. 1A. Immunoblots and densitometry analysis of represented proteins in the (E) liver, (F) iBAT, (G) pWAT, and (H) soleus in ID and ID; r-mS100A9 mice treated either with saline or with of human insulin (5 U/kg; Humalog). Error bars represent SEM, and statistical analyses were done using one-way ANOVA (Tukey’s post hoc test). * indicates a comparison to the ID group, *P ≤ 0.05, **P ≤ 0.01, and ***P ≤ 0.001.
Fig. 3.
Fig. 3.. r-mS100A9 does not affect endogenous glucose production in ID.
(A) Schematic representation of glycolysis/gluconeogenesis pathway. Measured enzymes are circled in red. (B) Hepatic mRNA content of phosphoenolpyruvate carboxykinase 1 (Pepck) and glucose-6-phosphatase (G6p) in indicated groups (n = 4 to 10 per group). (C) Immunoblot of PEPCK and tubulin and relative densitometry quantification of PEPCK/tubulin in hepatic lysates from indicated cohorts (n = 4 to 6 per group). (D) Hepatic glucose-6-phosphate and (E) glycogen levels in indicated groups (n = 3 to 10 per group). (F) Immunoblot and relative densitometry quantification of indicated protein in hepatic lysates from indicated cohorts (n = 4 to 6 per group). (G) Blood glucose levels after an intraperitoneal pyruvate injection (2 mg/g of body weight) in indicated groups (n = 3 to 4 per group). (H) Data from (G) expressed as a percentage change in glycemia/basal. (I) Endogenous glucose production in indicated groups (n = 4 to 10 per group). ID mice in (G) to (I) were treated with r-mS100A9 or saline for 3 days, as in Fig. 1A. Error bars represent SEM, and statistical analyses were done using one-way ANOVA or two-way ANOVA (Tukey’s post hoc test) when more than two groups and more than one experimental condition/time point were compared. * and # indicate a comparison to the healthy and ID groups, respectively. *P < 0.05, **P < 0.01, ***P < 0.001, #P < 0.05, ##P < 0.01, and ###P < 0.001.
Fig. 4.
Fig. 4.. r-mS100A9 enhances glucose uptake in the skeletal muscle of ID mice via Toll-like receptor 4.
Glycemia (A) and 2DG clearance rate (B) in Tlr4WT ID and ID; r-mS100A9–treated mice. Glycemia (C) and 2DG clearance rate (D) in Tlr4KO ID and ID; r-mS100A9–treated mice. (E) 2DG uptake in indicated tissues and groups 1 hour after a bolus of 2DG (n = 6 to 14 per group). (F) Immunoblots and corresponding densitometry in soleus muscle lysates of ID and ID; r-mS100A9 mice. (n = 4 to 5 per group). Error bars represent SEM, and statistical analyses were done using unpaired t test or one-way ANOVA (Tukey’s post hoc test). *P ≤ 0.05 and **P ≤ 0.01.
Fig. 5.
Fig. 5.. Insulin and r-mS100A9 exert anti-inflammatory effects on T1DM mice.
(A) Heatmap clustering of inflammatory proteins increased in ID (n = 4 per group). (B) Volcano plot representing indicating quantity comparison of each circulating protein detected in ID mice divided by the quantity of each respective protein in healthy mice. (C) Heatmap clustering of inflammatory proteins decreased in ID and was corrected by indicated treatments. (D) Plasma levels of leptin, (E) interleukin (IL-6), and (F) tumor necrosis factor–α (TNF-α) in the indicated groups (n = 3 to 7 per group). (G) Hepatic and (H) skeletal muscle mRNA levels of indicated genes in indicated groups (n = 3 to 7 per group). TNF-α (I) and IL-6 levels (J) in skeletal muscle lysates of indicated treatment groups. Error bars represent SEM, and statistical analyses were done using one-way ANOVA (Tukey’s post hoc test). * and # indicate a comparison to the healthy and ID groups, respectively. *P < 0.05, **P < 0.01, ***P < 0.001, #P < 0.05, ##P < 0.01, and ###P < 0.001.

Similar articles

Cited by

References

    1. Saeedi P., Petersohn I., Salpea P., Malanda B., Karuranga S., Unwin N., Colagiuri S., Guariguata L., Motala A. A., Ogurtsova K., Shaw J. E., Bright D., Williams R.; IDF Diabetes Atlas Committee , Global and regional diabetes prevalence estimates for 2019 and projections for 2030 and 2045: Results from the International Diabetes Federation Diabetes Atlas, 9(th) edition. Diabetes Res. Clin. Pract. 157, 107843 (2019). - PubMed
    1. Wasserfall C., Nick H. S., Campbell-Thompson M., Beachy D., Haataja L., Kusmartseva I., Posgai A., Beery M., Rhodes C., Bonifacio E., Arvan P., Atkinson M., Persistence of pancreatic insulin mRNA expression and proinsulin protein in type 1 diabetes pancreata. Cell Metab. 26, 568–575.e3 (2017). - PMC - PubMed
    1. Donath M. Y., Type 1 diabetes: What is the role of autoimmunity in β cell death? J. Clin. Invest. 132, (2022). - PMC - PubMed
    1. Quattrin T., Mastrandrea L. D., Walker L. S. K., Type 1 diabetes. Lancet 401, 2149–2162 (2023). - PubMed
    1. Talchai C., Xuan S., Lin H. V., Sussel L., Accili D., Pancreatic β cell dedifferentiation as a mechanism of diabetic β cell failure. Cell 150, 1223–1234 (2012). - PMC - PubMed