. 2024 Jan 23;98(1):e0135023.
doi: 10.1128/jvi.01350-23. Epub 2024 Jan 3.

N-acetyltransferase 10 regulates alphavirus replication via N4-acetylcytidine (ac4C) modification of the lymphocyte antigen six family member E (LY6E) mRNA

Affiliations

N-acetyltransferase 10 regulates alphavirus replication via N4-acetylcytidine (ac4C) modification of the lymphocyte antigen six family member E (LY6E) mRNA

Yamei Dang et al. J Virol. .

Abstract

Epitranscriptomic RNA modifications can regulate the stability of mRNA and affect cellular and viral RNA functions. The N4-acetylcytidine (ac4C) modification in the RNA viral genome was recently found to promote viral replication; however, the mechanism by which RNA acetylation in the host mRNA regulates viral replication remains unclear. To help elucidate this mechanism, the roles of N-acetyltransferase 10 (NAT10) and ac4C during the infection and replication processes of the alphavirus, Sindbis virus (SINV), were investigated. Cellular NAT10 was upregulated, and ac4C modifications were promoted after alphavirus infection, while the loss of NAT10 or inhibition of its N-acetyltransferase activity reduced alphavirus replication. The NAT10 enhanced alphavirus replication as it helped to maintain the stability of lymphocyte antigen six family member E mRNA, which is a multifunctional interferon-stimulated gene that promotes alphavirus replication. The ac4C modification was thus found to have a non-conventional role in the virus life cycle through regulating host mRNA stability instead of viral mRNA, and its inhibition could be a potential target in the development of new alphavirus antivirals.IMPORTANCEThe role of N4-acetylcytidine (ac4C) modification in host mRNA and virus replication is not yet fully understood. In this study, the role of ac4C in the regulation of Sindbis virus (SINV), a prototype alphavirus infection, was investigated. SINV infection results in increased levels of N-acetyltransferase 10 (NAT10) and increases the ac4C modification level of cellular RNA. The NAT10 was found to positively regulate SINV infection in an N-acetyltransferase activity-dependent manner. Mechanistically, the NAT10 modifies lymphocyte antigen six family member E (LY6E) mRNA-the ac4C modification site within the 3'-untranslated region (UTR) of LY6E mRNA, which is essential for its translation and stability. The findings of this study demonstrate that NAT10 regulated mRNA stability and translation efficiency not only through the 5'-UTR or coding sequence but also via the 3'-UTR region. The ac4C modification of host mRNA stability instead of viral mRNA impacting the viral life cycle was thus identified, indicating that the inhibition of ac4C could be a potential target when developing alphavirus antivirals.

Keywords: N-acetyltransferase 10 (NAT10); N4-acetylcytidine (ac4C); Sindbis virus (SINV); alphavirus; lymphocyte antigen 6 family member E (LY6E).


Conflict of interest statement

The authors declare no conflict of interest.

Figures

Fig 1
Fig 1
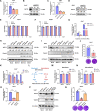
NAT10 expression and ac4C content are increased with SINV infection. (A) Huh7 cells were infected with SINV (MOI = 1), and the NAT10 mRNA was analyzed using qRT-PCR at 6, 12, and 24 hpi. GAPDH was used as the control. (B) Huh7 cells were infected with SINV (MOI = 1), and the viral RNA was analyzed using qRT-PCR at 6, 12, and 24 hpi. (C) Immunoblot analysis of the NAT10 protein abundance in Huh7 cells infected with SINV (MOI = 1) at 6, 12, and 24 hpi; uninfected cells were used as the control. (D) Huh7 cells were infected with SINV (MOI = 0.1, 0.2, and 1). NAT10 mRNA was analyzed using qRT-PCR at 24 hpi. (E) Huh7 cells were infected with SINV (MOI = 0.1, 0.2, and 1), and SINV RNA was analyzed using qRT-PCR at 24 hpi. (F) Immunoblot analysis of the NAT10 protein abundance in Huh7 cells at 24 hpi (MOI = 0.1, 0.2, and 1). (G) A549 cells were infected with SINV (MOI = 1), and NAT10 mRNA was analyzed using qRT-PCR at 6, 12, and 24 hpi. (H) A549 cells were infected with SINV (MOI = 1), and viral RNA was analyzed using qRT-PCR at 6, 12, and 24 hpi. (I) Immunoblot analysis of NAT10 protein abundance in A549 cells infected with SINV (MOI = 1) at 6, 12, and 24 hpi. (J) A549 cells were infected with SINV (MOI = 0.1, 0.2, and 1), and NAT10 mRNA was analyzed using qRT-PCR at 24 hpi. (K) A549 cells were infected with SINV (MOI = 0.1, 0.2, and 1), and SINV RNA was analyzed using qRT-PCR at 24 hpi. (L) Immunoblot analysis of the NAT10 protein abundance in A549 cells at 24 hpi (MOI = 0.1, 0.2, and 1). (M) Huh7 cells were infected with SINV (MOI = 1, 5, and 10). NAT10 mRNA was analyzed using qRT-PCR at 24 hpi. (N) Immunoblot analysis of NAT10 protein abundance in Huh7 cells at 24 hpi (MOI = 1, 5, and 10). (O) Total RNA was extracted from SINV-infected and uninfected Huh7 cells (MOI = 1, 24 hpi), blotted with an anti-ac4C antibody (upper panel), and stained with 0.2% methylene blue as an internal control (lower panel). Relative signal intensity was normalized to total RNA levels (as measured using methylene blue). (P) (Upper panel) Confocal microscopy of SINV-infected Huh7 cells (MOI = 1, 24 hpi) immunostained for NAT10 (red), dsRNA (green), and nuclei (blue); scale bar = 20 µm. (Lower panel) The fluorescence intensity profile of NAT10 (red), dsRNA (green), and nuclei (blue) was measured along the line drawn by ImageJ software. Blots were quantified with ImageJ software and normalized to control levels. Data are presented as the means ± SEM (n = 3). *P ≤ 0.05, **P ≤ 0.01, ***P ≤ 0.001, and NS, not significant (A, B, D, E, G, H, J, K, and M, two-way ANOVA with Bonferroni post-test; O, unpaired Student’s t-tests).
Fig 2
Fig 2
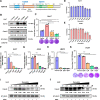
NAT10 is required for SINV replication. (A) qRT-PCR analysis of NAT10 mRNA expression in NAT10 stable-KD Huh7 cells. (B) Immunoblot analysis of NAT10-KD Huh7 cells. shNAT10 #2 was used in the subsequent experiments. (C) qRT-PCR analysis of NAT10 mRNA expression in NAT10-KD A549 cells. (D) Immunoblot analysis of NAT10-KD A549 cells. shNAT10 #2 was used in the subsequent experiments. (E, F) NAT10-KD Huh7 (E) cells were evaluated with the A549 (F) and control cells using the CCK8 assay for a period of 5 days, during which the 10% CCK8 solution was added at the same time each day, and the absorbance values of each well were detected after 4 h of incubation in the dark (n = 6). (G) qRT-PCR analysis of the SINV RNA expression levels in the NAT10-KD Huh7 cells at 24 hpi (MOI = 0.1 and 1). (H, I) Immunoblotting of the SINV capsid protein abundance in the control and NAT10-KD Huh7 (H) and A549 (I) cells at 24 hpi (MOI = 0.1, 0.2, and 1). (J) SINV infectious virion abundance in Vero E6 cells infected with a 10-fold dilution of NAT10-KD Huh7 cell supernatant (MOI = 1); counted following 1% crystal violet staining after 96 h. (K) Huh7 NAT10-KD and control cells were infected with SINV (MOI = 5), and the SINV RNA was assessed using qRT-PCR at 4, 8, 12, and 24 hpi. (L) Flowchart showing the viral attachment and internalization assay. (M) Attachment assay. SINV RNA was analyzed using qRT-PCR in Huh7 NAT10-KD and control cells infected with SINV (MOI = 5 and 10) for 30 min at 4°C. (N) Internalization assay. SINV RNA was analyzed using qRT-PCR in Huh7 NAT10-KD and control cells infected with SINV (MOI = 5 and 10) for 2 hpi at 37°C. (O, P) NAT10-KD Huh7 cells exogenously transfected with Myc-tagged NAT10-expressing plasmid and infected with SINV (MOI = 1), qRT-PCR analysis of the SINV RNA expression (O); immunoblot analysis of the SINV capsid protein level (P) was conducted at 24 hpi. (Q) SINV infectious virions in the culture supernatant determined via a plaque formation assay as described for panel (P). Blots were quantified with ImageJ software and normalized to control levels. Data are presented as the means ± SEM (n = 3). *P ≤ 0.05, **P ≤ 0.01, ***P ≤ 0.001, and NS, not significant (A, C, O, and Q, one-way ANOVA with Tukey’s multiple comparisons test; G, K, M, and N, two-way ANOVA with Bonferroni post-test; J, unpaired Student’s t-tests).
Fig 3
Fig 3
N-Acetyltransferase activity is required for NAT10 to support SINV infection. (A) Schematic diagram showing the RNA helicase and N-acetyltransferase domains of NAT10. (B) Immunoblotting of the control or NAT10-KD Huh7 cells transfected with plasmids expressing the WT NAT10, K290A mutant, or G641E mutant and infected with SINV for 24 h (MOI = 1). (C) Plaque formation assay of the SINV infectious virions in the culture supernatant of panel B. (D, E) Viability of Huh7 (D) and A549 (E) cells at 24 hpi with the Remodelin incubation at different doses, detected using the CCK8 assay. (F) qRT-PCR analysis of the SINV RNA expression levels in Huh7 cells infected with SINV and treated with different concentrations of Remodelin (MOI = 1). (G) qRT-PCR analysis of SINV RNA expression levels in A549 cells infected with SINV and treated with different concentrations of Remodelin (MOI = 1). (H) qRT-PCR analysis of the SINV RNA expression levels in HMC3 cells infected with SINV and treated with different concentrations of Remodelin (MOI = 1). (I) Immunoblotting of the SINV capsid protein in Huh7 cells infected with SINV for 24 h and treated with different concentrations of Remodelin (MOI = 1). (J) Immunoblotting of the SINV capsid protein in A549 cells infected with SINV for 24 h and treated with different concentrations of Remodelin (MOI = 1). (K) Plaque formation assay using the SINV infectious virions in the culture supernatant from the Huh7 cells infected with SINV and treated with different concentrations of Remodelin (MOI = 1). Blots were quantified with ImageJ software and normalized to control levels. Data are presented as the means ± SEM (n = 3). **P ≤ 0.01, ***P ≤ 0.001, and NS, not significant (C, F, G, H, and K, one-way ANOVA with Tukey’s multiple comparisons test).
Fig 4
Fig 4
Identification of the NAT10 targets using RNA sequencing. (A) Venn diagram showing four Huh7 cell comparison groups with DEGs. (B) Functional annotation and pathway enrichment analysis results of predicted downstream target genes of NAT10 are shown. All DEGs were mapped to GO terms in the Gene Ontology database. Gene numbers were calculated for each term, and significantly enriched GO terms for the DEGs compared to those in the background genome were defined using the hypergeometric test. GO terms with a P < 0.05 were defined as significantly enriched GO terms in the DEGs. The horizontal axis represents the different GO functional categories, and the vertical axis represents the number of genes within that category as a percentage of the total number of genes for the annotation. (C) KEGG enrichment analysis revealed that the DEGs are primarily enriched in infectious diseases. The horizontal coordinate is the percentage of differential genes annotated to the pathway for all differential genes with annotations; the vertical coordinate is the name of the KEGG pathway enriched in differential genes. The bar graphs are colored separately to show the classification of the KEGG pathway. (D) Scatter plots of the differential mRNA expression determined from the RNAseq data. Red dots denote upregulated genes, and blue dots denote downregulated genes. (E) Volcano plot showing genes with upregulated (red) and downregulated (blue) expression in NAT10-KD cells infected with SINV. Log2 (FC) is the horizontal coordinate, representing the fold change in differential expression of genes across samples; −log10 (P value) is the vertical coordinate, representing the significance of the change in expression of the DEGs. (F) Heat map showing differential expression clusters for the top 50 genes in NAT10-KD Huh7 cells infected with SINV. The horizontal coordinate is the sample, and the vertical coordinate is the screened DEGs. The change in color from blue to white to red indicates expression from low to high. Red and blue indicate genes with high and low expressions, respectively.
Fig 5
Fig 5
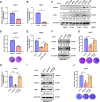
NAT10 targets LY6E, which mediates ac4C modifications during SINV infection. (A) Validation of candidate genes from the RNAseq data using qRT-PCR in NAT10-KD cells infected with SINV. (B) Predicted ac4C modification sites for the LY6E pre-mRNA and mature mRNA. (C) IP of 293T cells transfected with the NAT10-Myc plasmid and anti-Myc antibody; enriched LY6E mRNA was analyzed using qRT-PCR; the interactions between the NAT10 and LY6E mRNA were also analyzed. (D) (Upper panel) Immunoblot of the NAT10 immunoprecipitate in panel C. (Lower panel) Agarose gel electrophoresis images of the LY6E amplified using qRT-PCR in panel C. (E) After incubating with the anti-ac4C antibody and normal rabbit IgG mixed with protein A/G beads at 4°C for 2 h, respectively, incubation was continued with the NAT10-KD Huh7 cell lysate for 2 h. The bound ac4C-modified RNA was eluted and analyzed using qRT-PCR. (Left panel) The ac4C-modified RNA was also analyzed using qRT-PCR. (Right panel) Agarose gel electrophoresis images of the LY6E amplified using qRT-PCR. Equal amounts of RNA fragments not subjected to immunoprecipitation were used as the input controls. (F) (Upper panel) Schematic of the 4xS1m aptamer. (Lower panel) WT or ac4C site mutated (C–T mut) LY6E mRNA tagged with 4xS1m aptamer was incubated with cell lysates overexpressing NAT10 and separated via streptavidin-conjugated beads. NAT10 in the cell lysate was pulled down, and the LY6E mRNA was detected using an immunoblot. Cells transfected with vectors were used as negative controls. (G) (Upper panel) Schematic diagram of the dual-luciferase reporter plasmid pmirGLO. (Lower panel) Luciferase activity in the NAT10-KD Huh7 (I) or A549 (ii) cells transfected with pmirGLO with the WT or ac4C-modifier-site-mutated (C–T mut) the 3′-UTR of the LY6E mRNA. Firefly luciferase activity was normalized to Renilla luciferase activity. (H, I) Stability of LY6E mRNA in NAT10-KD Huh7 (H) and A549 (I) cells after treatment with actinomycin D (5 µg/mL) was analyzed using qRT-PCR at different time points. (J) Ly6E mRNA levels were analyzed in Huh7 cells using qRT-PCR at different time points after 24 h of Remodelin treatment with actinomycin D. Blots were quantified with ImageJ software and normalized to control levels. Data are presented as the means ± SEM (n = 3). *P ≤ 0.05, **P ≤ 0.01, ***P ≤ 0.001, and NS, not significant (A, E, G, H, I, and J, two-way ANOVA with Bonferroni post-test; C, unpaired Student’s t-tests).
Fig 6
Fig 6
SINV is positively affected by NAT10 as it regulates the stability of the LY6E mRNA. (A) qRT-PCR analysis of LY6E mRNA expression in LY6E-KD Huh7 cells. (B) qRT-PCR analysis of the SINV RNA expression levels in LY6E-KD Huh7 cells at 24 hpi (MOI = 1). (C) Immunoblot analysis of the SINV capsid protein expression in LY6E-KD Huh7 cells at 6, 12, and 24 hpi (MOI = 1). (D) Plaque formation assay using the SINV infectious virions obtained from the LY6E-KD Huh7 cell culture medium at 24 hpi (MOI = 1). (E) qRT-PCR analysis of the SINV RNA expression levels in LY6E-KD Huh7 cells ectopically expressing LY6E and infected with SINV, 24 hpi (MOI = 1). (F) Immunoblot analysis of the SINV capsid protein abundance described in panel (E). (G) Plaque formation assay using the SINV infectious virions obtained from the culture supernatant described in panel (E). (H) qRT-PCR analysis of the SINV RNA expression levels in NAT10-KD Huh7 cells ectopically expressing LY6E and infected with SINV, 24 hpi (MOI = 1). (I) Immunoblot analysis of the SINV capsid protein abundance as described in panel (H). (J) Plaque formation assay for the SINV infectious virions obtained from the culture supernatant described in panel (H). Blots were quantified with ImageJ software and normalized to control levels. Data are presented as the means ± SEM (n = 3). *P ≤ 0.05 and ***P ≤ 0.001 (A, B, and D, unpaired Student’s t-tests; E, G, H, and J, one-way ANOVA with Tukey’s multiple comparisons test).
Fig 7
Fig 7
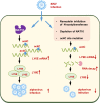
Working model showing how the loss of NAT10 reduces alphavirus replication. Alphavirus (SINV) infection upregulates NAT10 in host cells and promotes NAT10-mediated ac4C acetylation of LY6E mRNA transcripts, increasing LY6E expression and enhancing alphavirus replication.

Similar articles

Cited by

References

    1. Roundtree IA, Evans ME, Pan T, He C. 2017. Dynamic RNA modifications in gene expression regulation. Cell 169:1187–1200. doi:10.1016/j.cell.2017.05.045 - DOI - PMC - PubMed
    1. Arango D, Sturgill D, Alhusaini N, Dillman AA, Sweet TJ, Hanson G, Hosogane M, Sinclair WR, Nanan KK, Mandler MD, Fox SD, Zengeya TT, Andresson T, Meier JL, Coller J, Oberdoerffer S. 2018. Acetylation of cytidine in mRNA promotes translation efficiency. Cell 175:1872–1886. doi:10.1016/j.cell.2018.10.030 - DOI - PMC - PubMed
    1. Arango D, Sturgill D, Yang R, Kanai T, Bauer P, Roy J, Wang Z, Hosogane M, Schiffers S, Oberdoerffer S. 2022. Direct epitranscriptomic regulation of mammalian translation initiation through N4-acetylcytidine. Mol Cell 82:2912. doi:10.1016/j.molcel.2022.06.022 - DOI - PMC - PubMed
    1. Tsai K, Jaguva Vasudevan AA, Martinez Campos C, Emery A, Swanstrom R, Cullen BR. 2020. Acetylation of cytidine residues boosts HIV-1 gene expression by increasing viral RNA stability. Cell Host Microbe 28:306–312. doi:10.1016/j.chom.2020.05.011 - DOI - PMC - PubMed
    1. Hao H, Liu W, Miao Y, Ma L, Yu B, Liu L, Yang C, Zhang K, Chen Z, Yang J, Zheng Z, Zhang B, Deng F, Gong P, Yuan J, Hu Z, Guan W. 2022. N4-acetylcytidine regulates the replication and pathogenicity of enterovirus 71. Nucleic Acids Res 50:9339–9354. doi:10.1093/nar/gkac675 - DOI - PMC - PubMed