. 2024 Jan;5(1):131-146.
doi: 10.1038/s43018-023-00671-3. Epub 2024 Jan 2.

Blocking methionine catabolism induces senescence and confers vulnerability to GSK3 inhibition in liver cancer

Affiliations

Blocking methionine catabolism induces senescence and confers vulnerability to GSK3 inhibition in liver cancer

Fuming Li et al. Nat Cancer. 2024 Jan.

Abstract

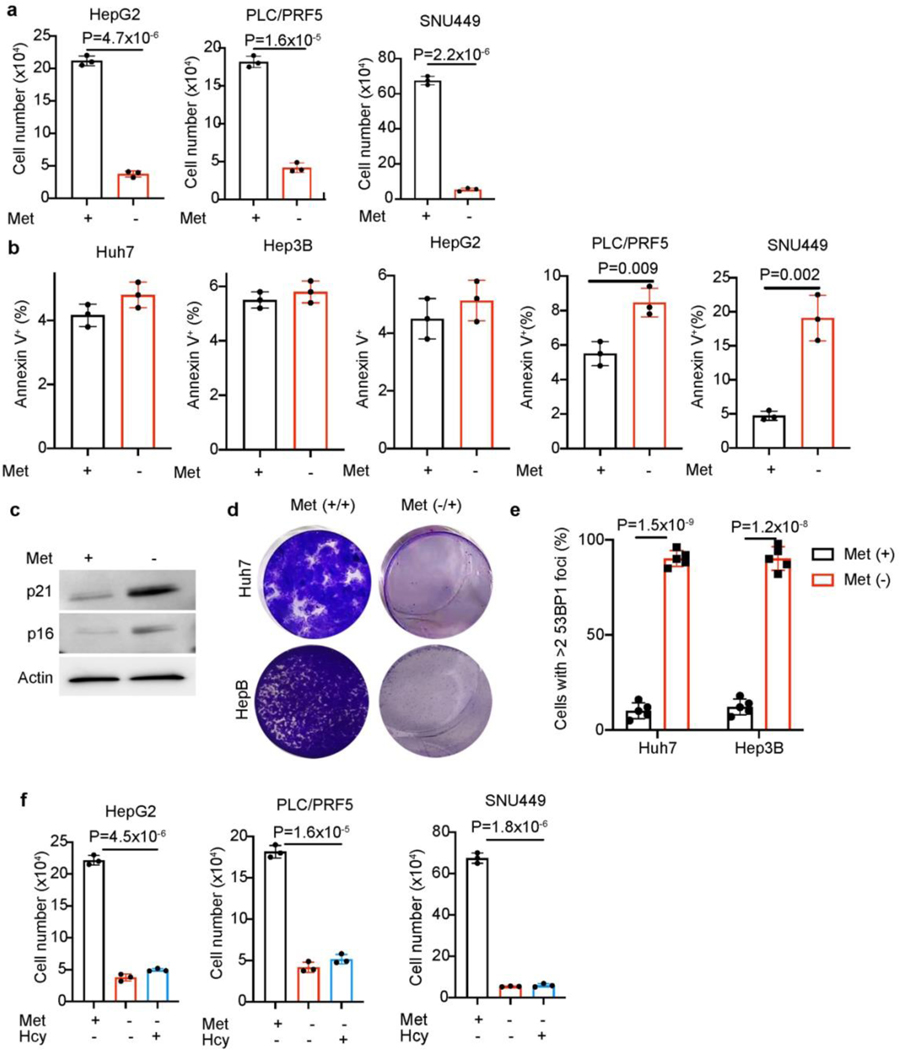
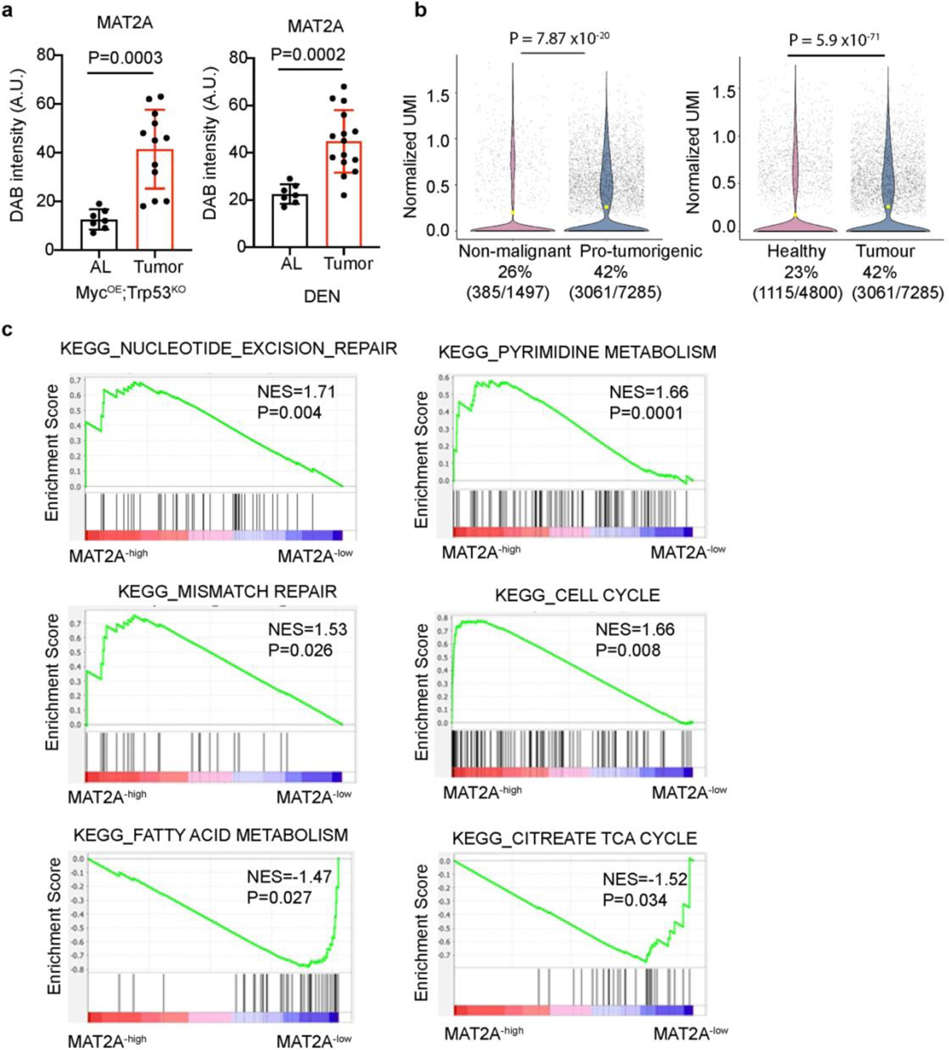
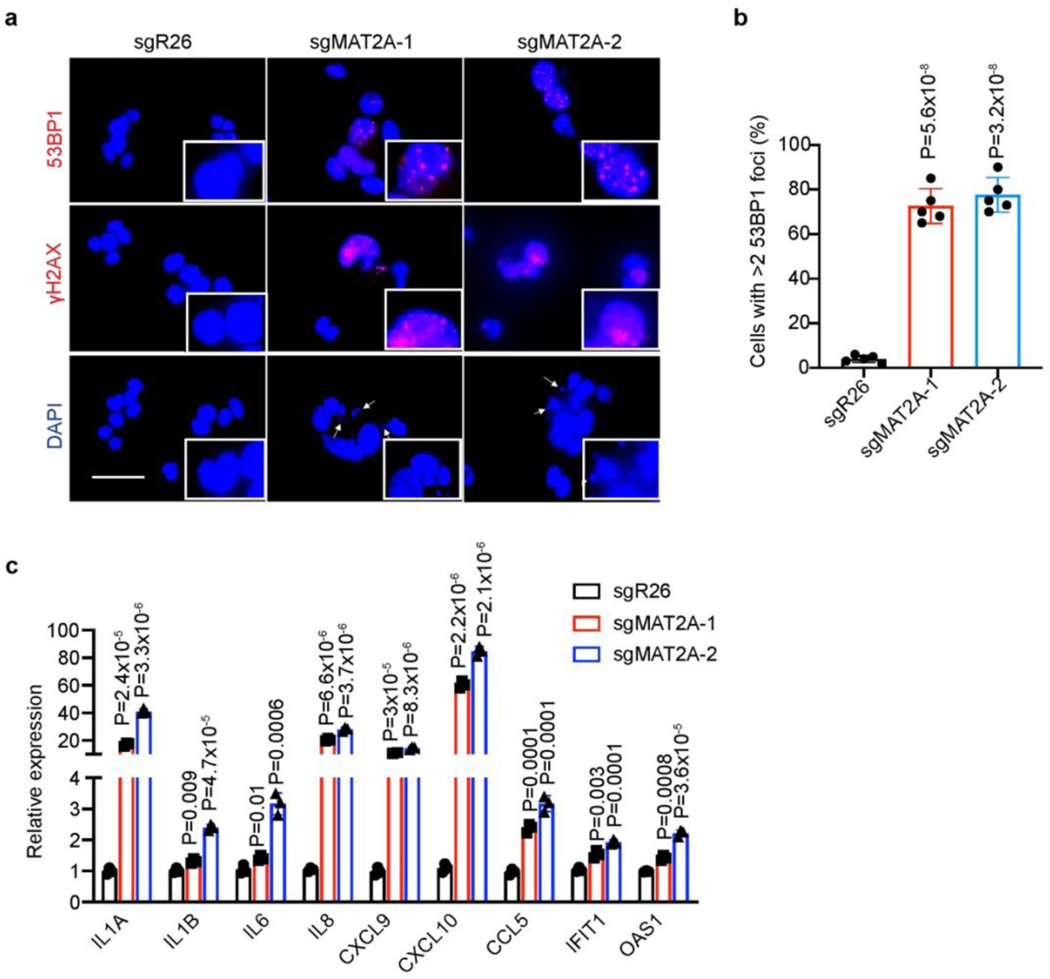
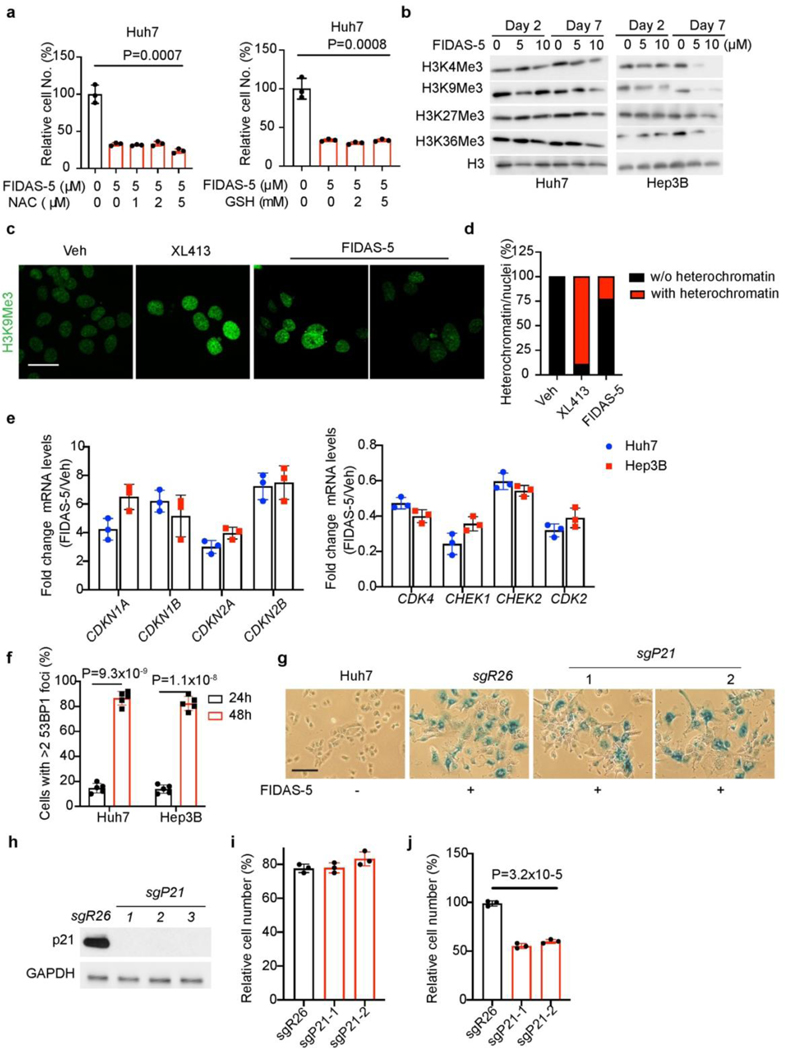
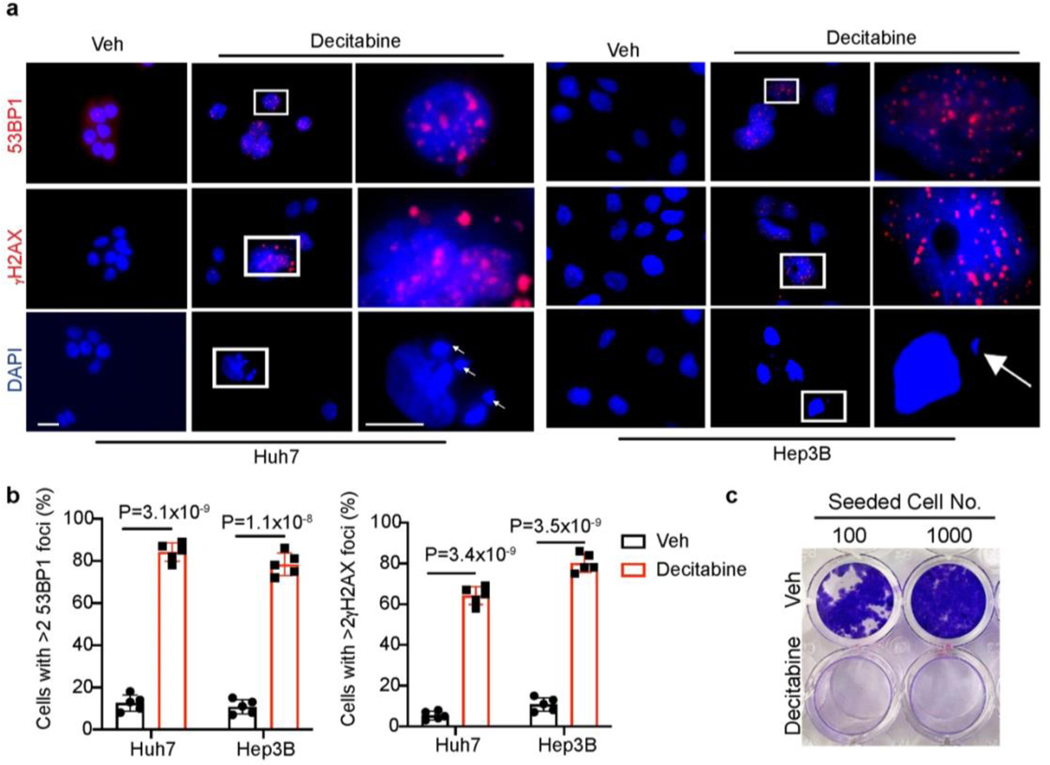
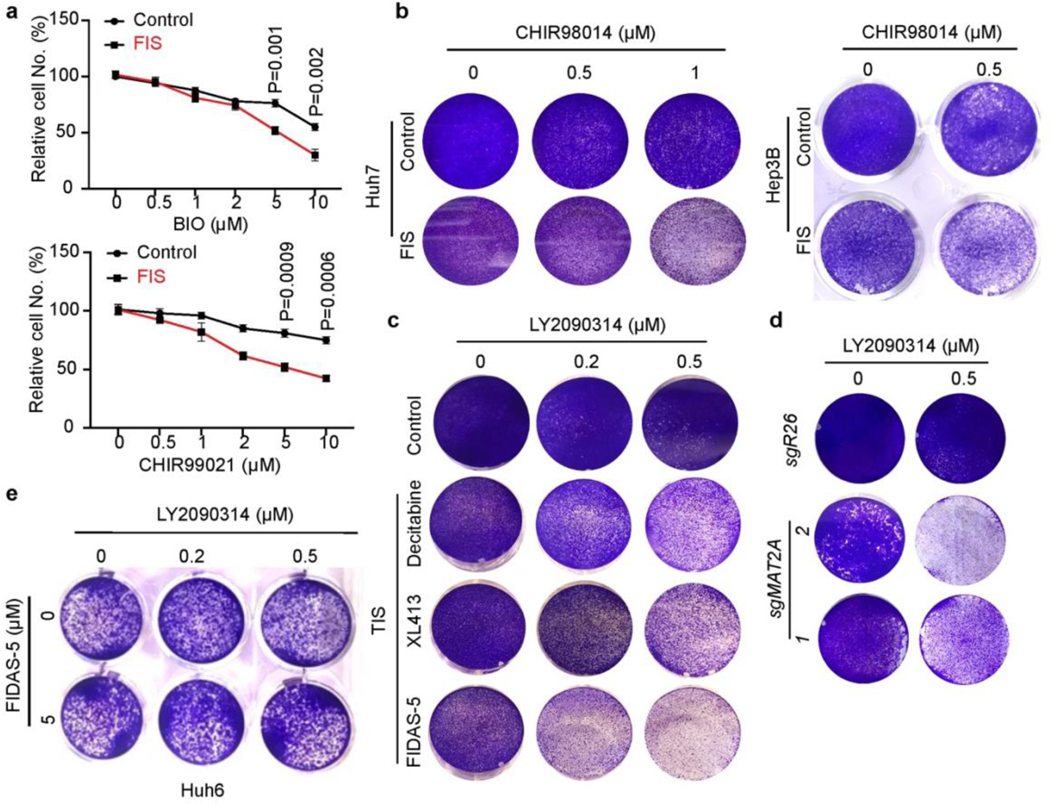
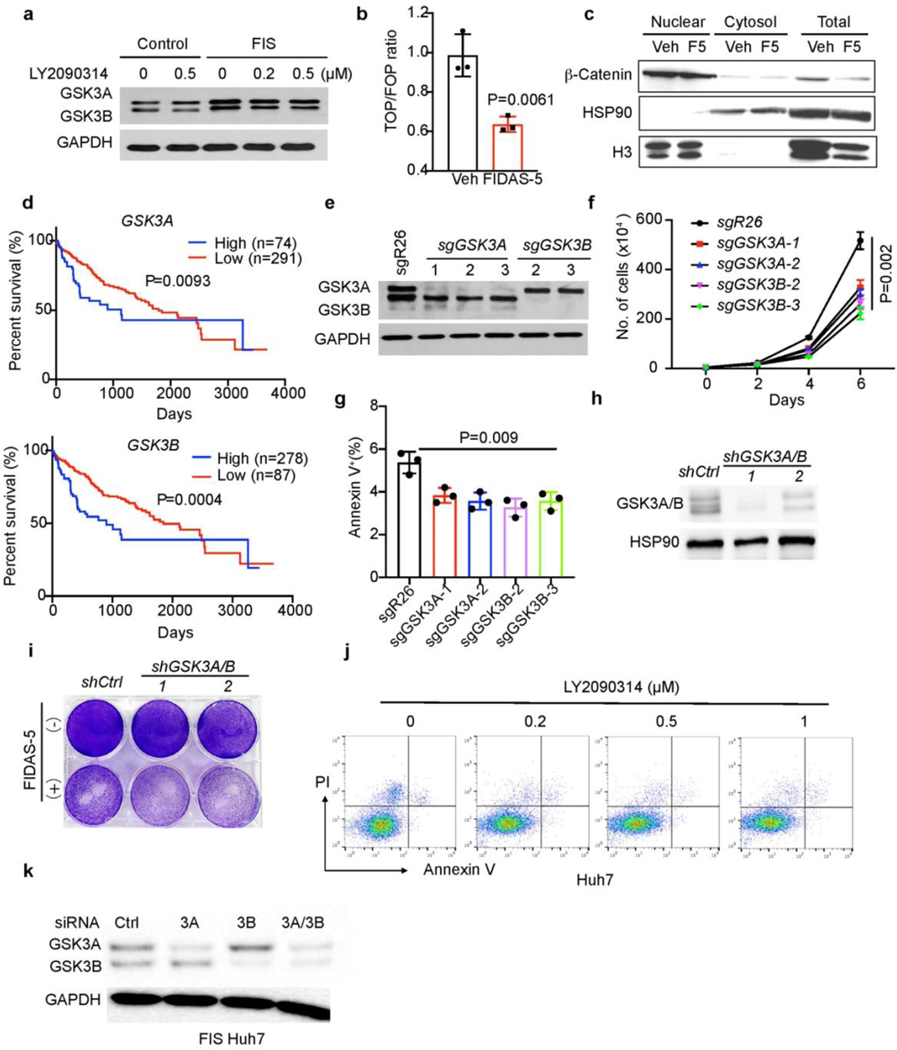
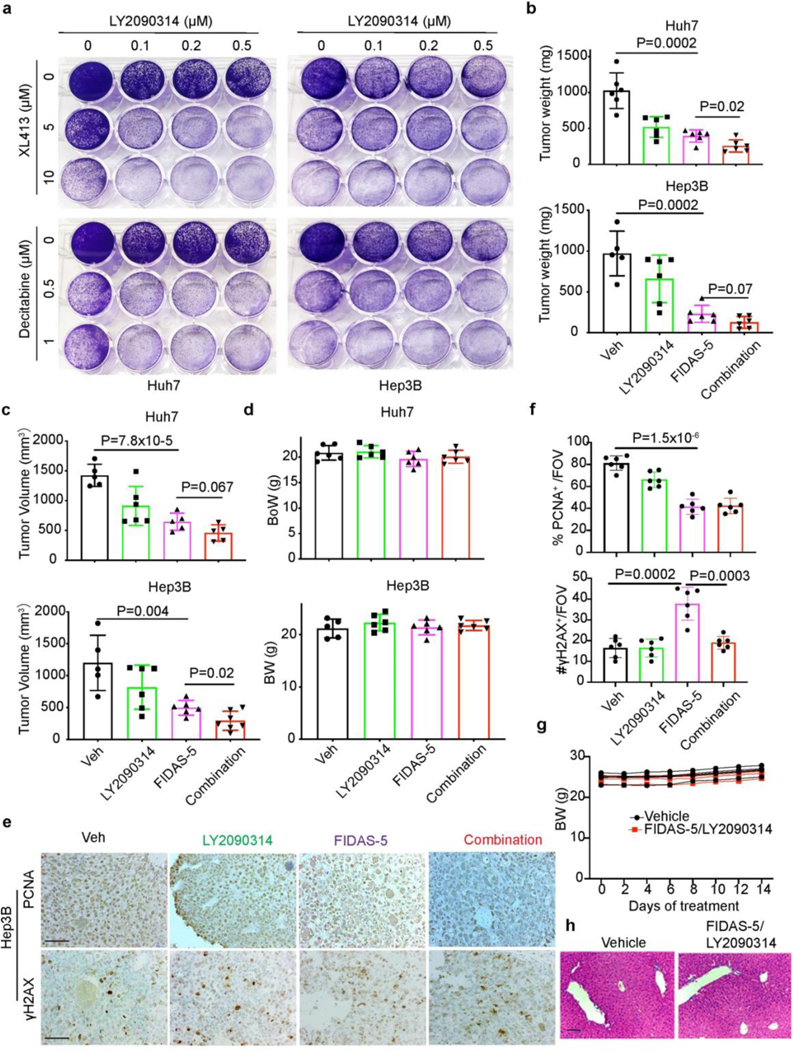
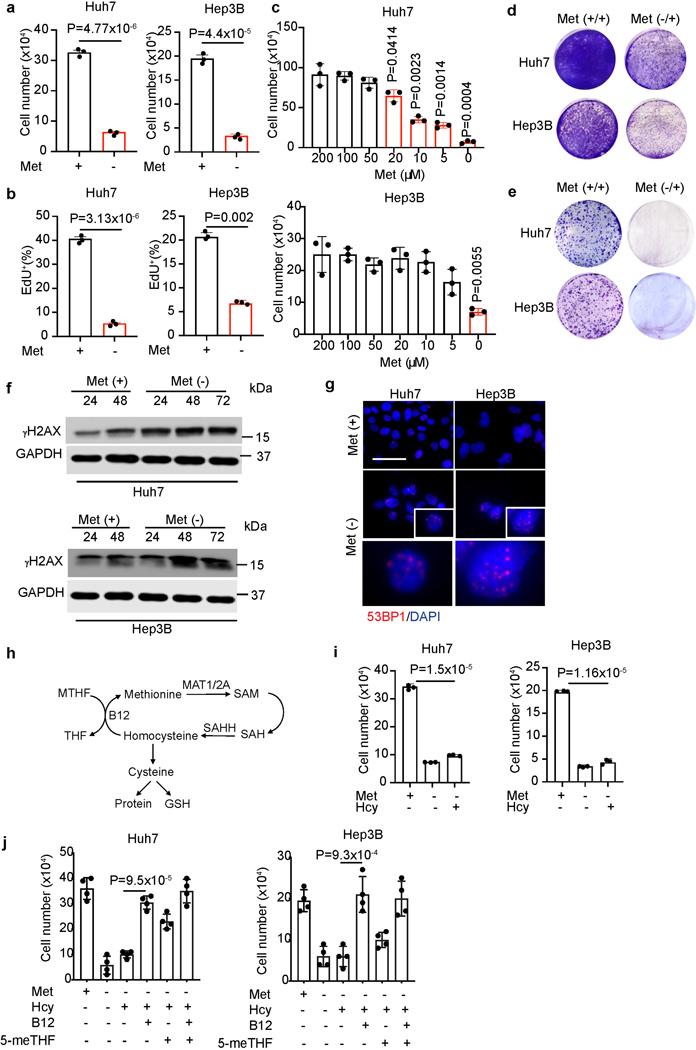
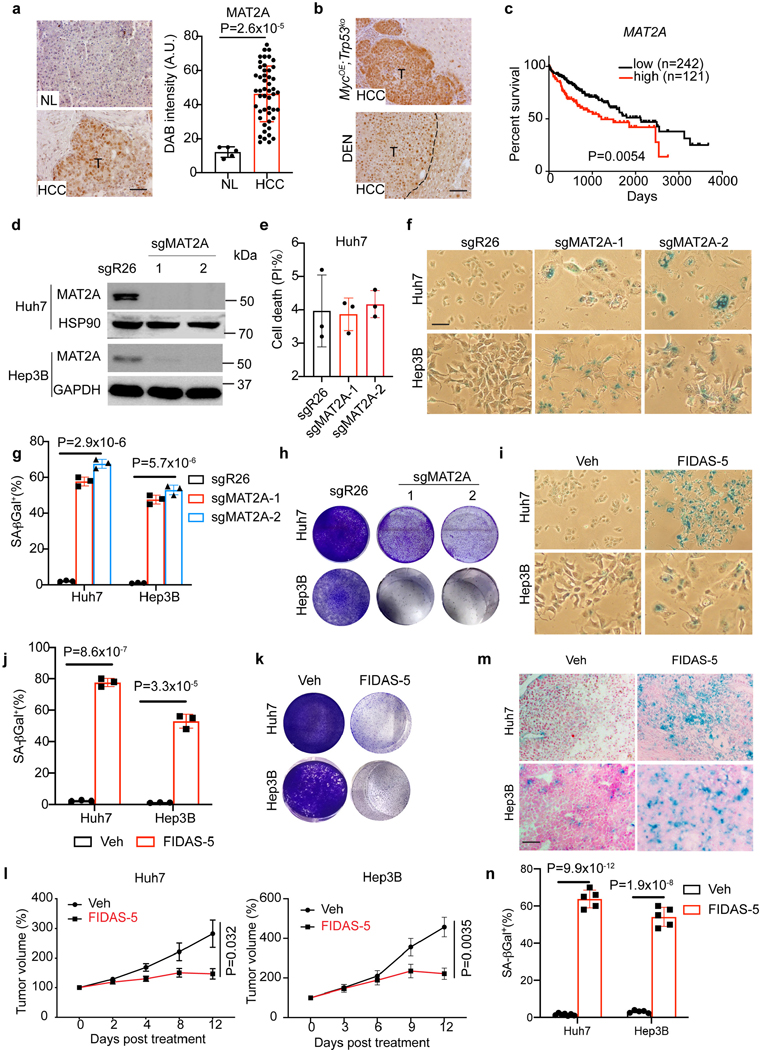
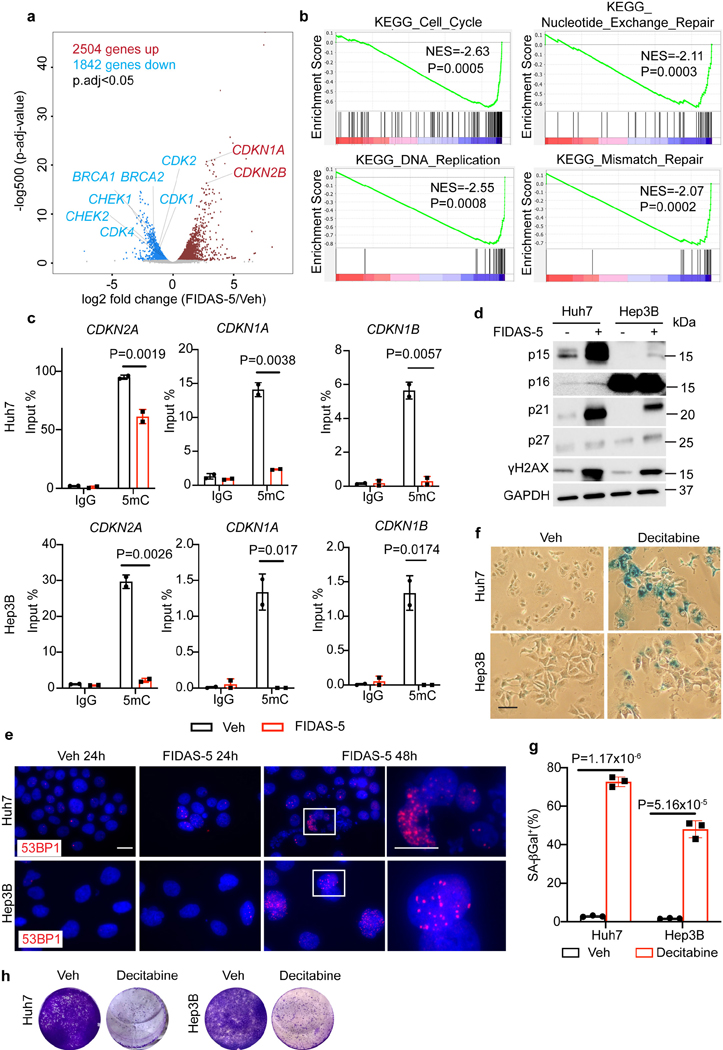
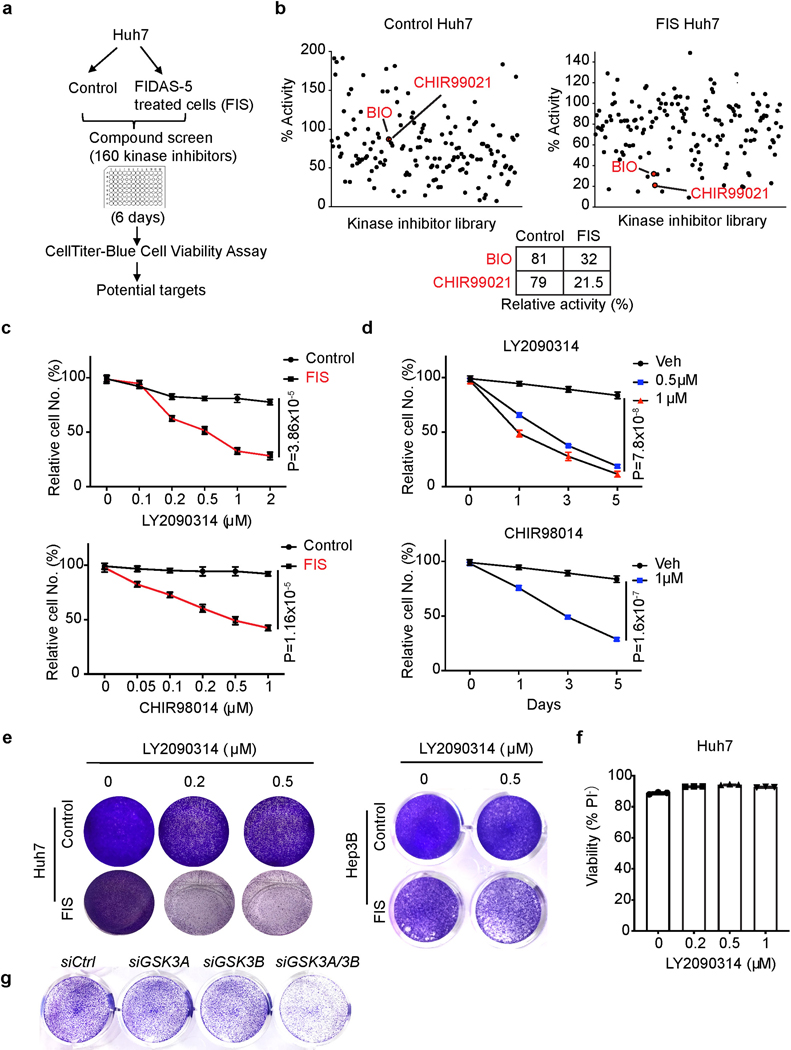
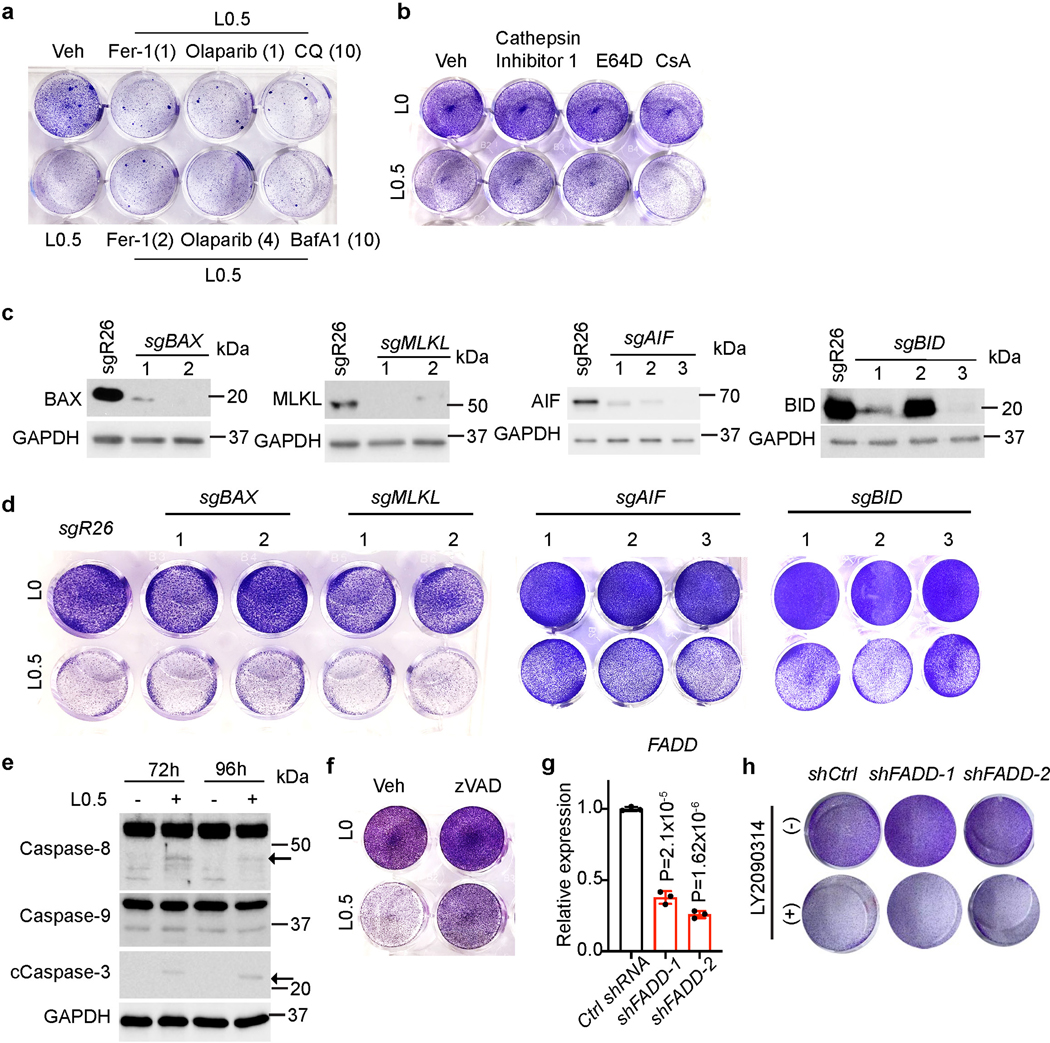
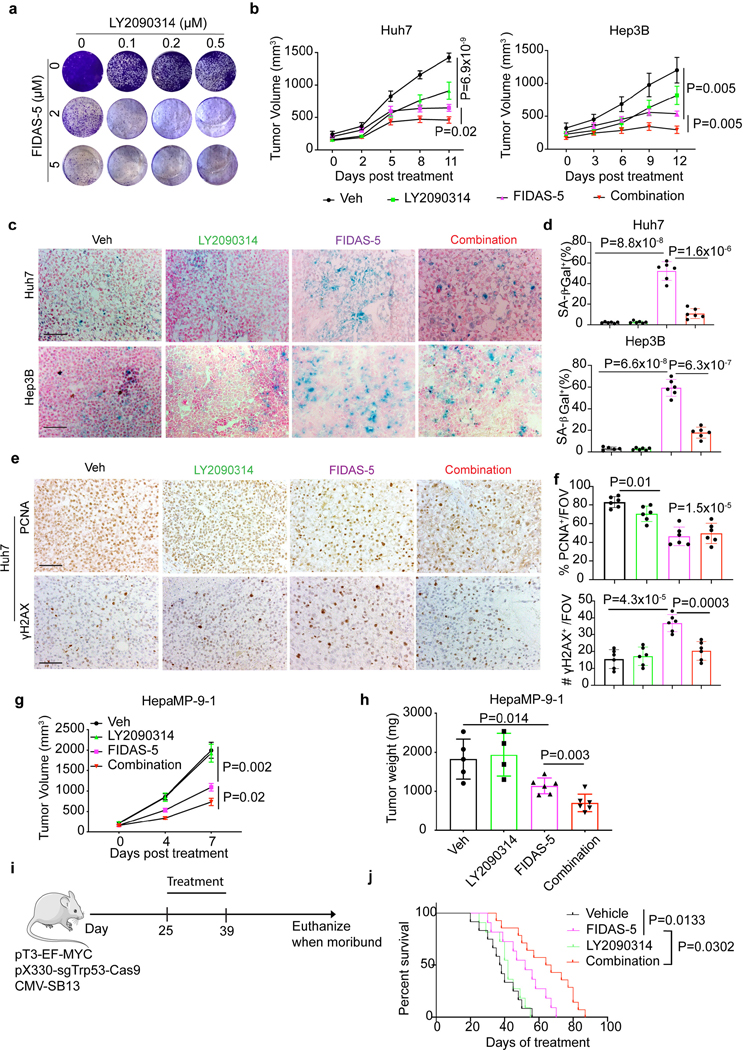
Availability of the essential amino acid methionine affects cellular metabolism and growth, and dietary methionine restriction has been implicated as a cancer therapeutic strategy. Nevertheless, how liver cancer cells respond to methionine deprivation and underlying mechanisms remain unclear. Here we find that human liver cancer cells undergo irreversible cell cycle arrest upon methionine deprivation in vitro. Blocking methionine adenosyl transferase 2A (MAT2A)-dependent methionine catabolism induces cell cycle arrest and DNA damage in liver cancer cells, resulting in cellular senescence. A pharmacological screen further identified GSK3 inhibitors as senolytics that selectively kill MAT2A-inhibited senescent liver cancer cells. Importantly, combined treatment with MAT2A and GSK3 inhibitors therapeutically blunts liver tumor growth in vitro and in vivo across multiple models. Together, methionine catabolism is essential for liver tumor growth, and its inhibition can be exploited as an improved pro-senescence strategy for combination with senolytic agents to treat liver cancer.


Conflict of interest statement

DECLARATION OF INTERESTS

The authors declare no potential conflicts of interest.

Figures

Extended Data Fig. 1.
Extended Data Fig. 1.. HCC cells undergo senescence upon methionine starvation.
a, Cell numbers of HepG2, PLC/PRF/5 and SNU449 cells with or without 72-hour methionine (Met) deprivation. b, Cell death quantification (Annexin V+%) of indicated HCC cells with or without 72-hour methionine (Met) deprivation. c, Western blot analysis of Huh7 cells with or without 72-hour methionine (Met) deprivation. Actin was used as a loading control. d, Representative crystal violet staining of control and methionine-deprived Huh7 and Hep3B cells replated in methionine-containing medium for 3-week clonogenicity assays. e, Quantification of cells with >2 53BP1 foci in control and methionine-deprived Huh7 and Hep3B cells. f, HepG2, PLC/PRF5 and SNU449 cell numbers when cultured in medium with or without homocysteine (Hcy, 100 μM). All statistical graphs show the mean ± s.e.m. P values were calculated using a two-tailed Student’s t-test. All experiments were performed in biological triplicate.
Extended Data Fig.2.
Extended Data Fig.2.. MAT2A as a potential oncogene in HCC.
a, Quantification of DAB intensity of MAT2A IHC staining of liver sections from MycOE;Trp53KO (n=7 for AL, n=12 for tumor) orthotopic model and DEN (n=7 for AL, n=16 for tumor) model. AL: adjacent liver. Representative immunofluorescence images of Huh7-sgR26, Huh7-sgMAT2A-1 and Huh7-sgMAT2A-2 cells stained with 53BP1 (red), γH2AX (red) and DAPI (blue). Scale bar: 50 μm. b, The frequency and normalized UMI of MAT2A transcripts in 7,285 pro-tumorigenic hepatocytes as compared to 1497 non-malignant hepatocytes (left) or 4800 uninjured hepatocytes from healthy livers (Right) using public single cell RNA-seq data. The data was analyzed using the non-parametric Wilcoxon rank-sum test. c, GSEA plots of indicated gene sets based on MAT2A expression in 374 HCC patient samples from TCGA dataset. MAT2A-high : top 50%, n=187; MAT2A-low:bottom 50%, n=187.
Extended Data Fig.3.
Extended Data Fig.3.. Genetic MAT2A inhibition induces DNA damage and promotes SASP gene expression.
a, Representative immunofluorescence images of Huh7-sgR26, Huh7-sgMAT2A-1 and Huh7-sgMAT2A-2 cells stained with 53BP1 (red), γH2AX (red) and DAPI (blue). Scale bar: 50 μm. b, Quantification of cells with >2 53BP1 foci in Huh7-sgR26, Huh7-sgMAT2A-1 and Huh7-sgMAT2A-2 cells. To quantify, 5 random fields containing at least 30 cells were counted and averaged. c, qRT-PCR analysis of indicated gene expression in Huh7-sgR26, Huh7-sgMAT2A-1 and Huh7-sgMAT2A-2 cells. Except a, all statistical graphs show the mean ± s.e.m. P values were calculated using a two-tailed Student’s t-test. All experiments were performed in biological triplicate.
Extended Data Fig.4.
Extended Data Fig.4.. MAT2A inhibition by FIDAS-5 induces senescence in liver cancer cells.
a, Cell viabilities of Huh7 and Hep3B cells treated with indicated doses of FIDAS-5 for 72 hours. b, Huh7 and Hep3B cell growth curves in the presence of 1 μM FIDAS-5. c, Relative SAM and SAH abundance determined by LC-MS analysis of control and FIDAS-5 treated Huh7 cells for 72 hours. d, Cell death quantification (Annexin V+%) of Huh7 and Hep3B cells with or without 72-hour FIDAS-5 exposure (Hep3B:1 μM, Huh7: 5 μM). e, Representative immunofluorescence images of vehicle control and FIDAS-5-induced senescent (FIS) Huh7 cells stained with 53BP1 (red), γH2AX (red) and DAPI (blue). Scale bar: 50 μm. f, Quantification of cells with >2 53BP1 foci in control and FIS Huh7 cells. To quantify, 5 random fields containing at least 30 cells were counted and averaged. g, Representative crystal violet staining of control and FIS Huh7 cells replated in growth medium for 3-week clonogenicity assays. h, qRT-PCR analysis of indicated gene expression in control and FIS Huh7 cells. i, j, Representative SA-β-gal staining (i) and quantification (j) of vehicle control (Veh) and FIDAS-5 treated TOV21G cells. Scale bar: 100 μm. k, Mouse body weight curves over time in vehicle control (Veh, n=7) and FIDAS-5 (n=5) treatment groups. All statistical graphs show the mean ± s.e.m. P values were calculated using a two-tailed Student’s t-test. All experiments were performed in biological triplicate.
Extended Data Fig. 5.
Extended Data Fig. 5.. Characterization of early FIDAS-5 treated HCC cells.
a, Relative numbers of Huh7 cells cultured in growth medium with indicated ROS scavengers for 72 hours. b, Western blot analysis of indicated histone methylation marks in Huh7 cells treated with indicated concentration of FIDAS-5 for indicated time. H3 was used as loading control. c, d, Representative immunofluorescence images (c) and statistical analysis (d) of Veh and treatment-induced senescent Huh7 cells stained with H3K9Me3 antibody (green). To quantify in d, 10 random fields containing at least 80 cells were counted and averaged for the percentage of H3K9Me3+ nuclei. Scale bar: 50 μm. e, Relative gene expression by qRT-PCR analysis of FIDAS-5 and vehicle treated Huh7 and Hep3B cells for 48 hours. f, Quantification of cells with >2 53BP1 foci in FIDAS5-treated Huh7, Hep3B cells for indicated time. To quantify, 5 random fields containing at least 30 cells were counted and averaged. g, Western blot analysis of p21 and GAPDH from Huh7-sgR26, Huh7-sgP21–1, Huh7-sgP21–2 and Huh7-sgP21–3 cells. h, i, Representative SA-β-gal staining (h) and quantification (i) of Huh7 cells and FIDAS-5 treated Huh7-sgR26, Huh7-sgP21–1, Huh7-sgP21–2 and Huh7-sgP21–3 cells. Scale bar: 100 μm. g, Relative cell numbers of FIDAS-5 treated Huh7-sgR26, Huh7-sgP21–1 and Huh7-sgP21–2 cells. All statistic graphs except d show the mean ± s.e.m. P values were calculated using a two-tailed Student’s t-test. All experiments were performed in biological triplicate.
Extended Data Fig. 6.
Extended Data Fig. 6.. DNA damage in early decitabine-treated HCC cells.
a, Representative immunofluorescence images of vehicle control and 48-hour decitabine-treated Huh7 and Hep3B cells stained with 53BP1 (red), γH2AX (red) and DAPI (blue). The arrows indicate cytoplasmic DNA. Scale bar: 10 μm. b, Quantification of cells with >2 53BP1 foci or >2 γH2AX foci in decitabine-treated Huh7 and Hep3B cells for 48 h. To quantify, 5 random fields containing at least 30 cells were counted and averaged. c, Representative crystal violet staining of control and decitabine-induced senescent Huh7 cells replated in growth medium for 3-week clonogenicity assays. All statistical graphs show the mean ± s.e.m. P values were calculated using a two-tailed Student’s t-test. All experiments were performed in biological triplicate.
Extended Data Fig.7.
Extended Data Fig.7.. GSK3 inhibition induces cell death in TIS liver cancer cells.
a, Relative cell numbers of Huh7 cells treated with different doses of BIO and CHIR99021 for 72 hours. b, Representative crystal violet staining of control and FIS Huh7 and Hep3B cells treated with indicated doses of CHIR98014 for 6 days. c, Representative crystal violet staining of vehicle control and TIS Huh7 cells treated with indicated doses of LY2090314 for 6 days. d, Representative crystal violet staining of Huh7-sgR26, Huh7-sgMAT2A-1 and Huh7-sgMAT2A-7 cells treated with 0.5 μM LY2090314 for 6 days. e, Representative crystal violet staining of Huh6 cells treated with indicated drug combinations for 6 days. All statistical graphs show the mean ± s.e.m. P values were calculated using a two-tailed Student’s t-test. All experiments were performed in biological triplicate.
Extended Data Fig.8.
Extended Data Fig.8.. GSK3 maintains viability of TIS liver cancer cells.
a, Western blot analysis of GSK3A, GSK3B and GAPDH in lysates from control and FIS Huh7 cells with or without 48-hour LY2090314 treatment at indicated doses. b, Normalized TOP Flash and FOP Flash luciferase activity in control and FIS Huh7 cells. c, Subcellular fractionation and western blot analysis of indicated proteins in vehicle and FIS Huh7 cells. d, Kaplan–Meier overall survival plots stratified by GSK3A or GSK3B mRNA levels from HCC TCGA database. A log-rank Mantel–Cox test was performed between the groups. e, Western blot analysis of GSK3A, GSK3B and GAPDH in lysates from Huh7 cells expressing indicated sgRNAs. f, Cell growth curves of Huh7 cells expressing indicated sgRNAs. g, Cell death quantification (Annexin V+%) of Huh7 cells expressing indicated sgRNAs. h, Western blot analysis of GSK3A, GSK3B and GAPDH from Huh7 cells expressing indicated shRNAs. i, Representative crystal violet staining of Huh7-shCtrl, Huh7-shGSK3A/B-1 and Huh7-shGSK3A/B-2 cells with or without 0.5 μM LY2090314 treatment for 6 days. j, Flow cytometry plots of Annexin-V/PI apoptosis assay in Huh7 cells treated with indicated doses of LY2090314 for 72 hours. k, Western blot analysis of GSK3A, GSK3B and GAPDH from FIS Huh7 cells expressing indicated siRNAs. All statistical graphs show the mean ± s.e.m. P values were calculated using a two-tailed Student’s t-test. All experiments were performed in biological triplicate.
Extended Data Fig.9.
Extended Data Fig.9.. Combined MAT2A and GSK3 inhibition limits liver tumor growth
a, Representative crystal violet staining of Huh7 cells treated with indicated doses of drug combination for 12 days. b-d, Quantification of end point Huh7 and Hep3B xenograft tumor weight (b), volume (c) and mouse body weight (d) from vehicle control (Veh), FIDAS-5, LY2090314 and combined FIDAS-5/LY2090314 treatment groups. Huh7: n=6 for each group. Hep3B: n=5 for Veh, n=6 for FIDAS-5, n=6 for LY2090314, n=7 for combination group. e, f, Representative IHC images (e) and quantification (f) of PCNA and γH2AX staining in Hep3B xenograft tumor sections from indicated treatment groups. To quantify, 3–5 representative images with a ×200 FOV were used for quantification using Image J and averaged for each animal. Scale bar: 100 μm. g, Body weight change of vehicle control (n=5) and combined FIDAS-5/LY2090314 (n=5)-treated C57BL/6 mice. h, Representative HE staining of liver sections from vehicle and combined FIDAS-5/LY2090314-treated wild type mice. Scale bar: 100 μm. All statistic graphs show the mean ± s.e.m. P values were calculated using a two-tailed Student’s t-test. All experiments were performed in biological triplicate.
Fig. 1.
Fig. 1.. Liver cancer cells undergo cell cycle arrest with DNA damage upon methionine deprivation.
a, Huh7 and Hep3B cell numbers with or without 72-hour methionine (Met) deprivation. b, Quantification of EdU incorporation rates (%) in Huh7 and Hep3B lines with or without 72-hour methionine deprivation (n=3 independent experiments). c, Huh7 and Hep3B cell numbers cultured in medium with indicated concentrations of methionine for 72 hours. d, e, Representative crystal violet staining of control and methionine-deprived Huh7 and Hep3B cells replated in methionine-containing medium for cell growth (d) and clonogenicity (e) assays. f, Time course western blot analysis of γH2AX and GAPDH in Huh7 and Hep3B cells cultured in control and methionine deprived medium. g, Representative immunofluorescence images of control (Met+) and methionine-deprived (Met-) Huh7 and Hep3B cells stained with 53BP1 (red) and DAPI (blue). Scale bar: 50 μm. h, Scheme of methionine cycle that couples methionine catabolism with folate metabolism and transsulfuration pathways. i, Huh7 and Hep3B cell numbers cultured in medium with or without homocysteine (Hcy, 100 μM). j, Huh7 and Hep3B cell numbers cultured in medium with indicated supplements. Hcy, homocysteine (Hcy, 100 μM), B12, vitamin B12 (100 nM), 5-meTHF, 5-methyl-tetrahydrofolate (10 μM). n=4 for each group. Methionine deprived culture media includes dialyzed FBS throughout these studies. Data presented as mean ± s.e.m. of three independent experiments; statistical significance was determined by a two-tailed Student’s t-test (a-c, i, j). Experiments were repeated three times independently, with similar results (d, e).
Fig. 2.
Fig. 2.. Blocking MAT2A induces senescence in liver cancer cells.
a, Left: representative IHC images of MAT2A staining in a human tissue array containing normal liver (NL) and HCC tissue sections. Scale bar: 100 μm. Right: quantification of DAB intensity of MAT2A IHC staining from normal liver (n=10) and HCC (n=49) sections. b, Representative IHC images of MAT2A staining of MYCOE;Trp53KO cell-derived orthotopic HCC tissue sections and DEN-treated mouse livers. T, tumor. Scale bar: 100 μm. c, Kaplan–Meier overall survival plots stratified by MAT2A high (red, n=121) or low (black, n=242) mRNA levels from TCGA HCC database. A log-rank Mantel–Cox test was performed between the groups. d, Western blot analysis of MAT2A and GAPDH isolated from Huh7-sgR26, Huh7-sgMAT2A-1, Huh7-sgMAT2A-2, Hep3B-sgR26, Hep3B-sgMAT2A-1, and Hep3B-sgMAT2A-2 cell lines (n=3 independent experiments). e, Quantification of cell death (% PI+) of Huh7-sgR26, Huh7-sgMAT2A-1 and Huh7-sgMAT2A-2 cell lines. f, g, Representative SA-β-gal staining (f) and quantification (g) of Huh7-sgR26, Huh7-sgMAT2A-1, Huh7-sgMAT2A-2, Hep3B-sgR26, Hep3B-sgMAT2A-1, and Hep3B-sgMAT2A-2 cell lines. Scale bar: 100 μm. h, Representative crystal violet staining of Huh7-sgR26, Huh7-sgMAT2A-1, Huh7-sgMAT2A-2, Hep3B-sgR26, Hep3B-sgMAT2A-1, and Hep3B-sgMAT2A-2 cell lines in cell growth assays. i, j, Representative SA-β-gal staining (i) and quantification (j) of vehicle control (Veh) and FIDAS-5 treated Huh7 and Hep3B cell lines. Scale bar: 100 μm. k, Representative crystal violet staining of vehicle control and FIDAS-5 treated Huh7 and Hep3B cell lines in long-term growth assays. l, Quantification of Huh7 and Hep3B xenograft tumor volume changes over time from vehicle control (Veh) (Huh7: n=7 female mice, Hep3B: n=4 female mice) and FIDAS-5 (Huh7: n=5 female mice, Hep3B: n=5 female mice) treatment groups. m, n, Representative SA-β-gal staining (m) and quantification (n) of Huh7 and Hep3B xenograft tumor cryosections. Control: n=7 female BAB/c mice for Huh7, n=4 female NSG mice for Hep3B. FIDAS-5: n=5 female BAB/c mice for Huh7, n=5 female NSG mice for Hep3B. Scale bar: 100 μm. Data presented as mean ± s.e.m. of three independent experiments (e,g,j,n) or mean ± s.e.m (a,l); statistical significance was determined by a two-tailed Student’s t-test (a,e,g,j,l,n) or log-rank Mantel–Cox test (c). Experiments were repeated three times independently, with similar results (d,h,k).
Fig. 3.
Fig. 3.. MAT2A inhibition leads to cell cycle arrest and DNA damage in liver cancer cells.
a, Volcano plot of differential gene expression from RNA-seq of vehicle control and FIDAS-5 treated Huh7 cells (n=3 samples for each group). b, GSEA plots of indicated gene sets based on RNA-seq of vehicle control and FIDAS-5 treated Huh7 cells (n=3 samples for each group). c, MeDIP-QPCR analysis of methylation status of indicated CpG islands of gene promoters. d, Western blot analysis of Huh7 and Hep3B cells with or without 48-hour FIDAS-5 (5 μM) treatment. e, Representative immunofluorescence images of vehicle control and FIDAS-5 treated Huh7, Hep3B cells stained with 53BP1 (red) and DAPI (blue). Scale bar: 100 μM. f, g, Representative SA-β-gal staining (f) and quantification (g) of vehicle control (Veh) and decitabine-treated Huh7 and Hep3B cells. Scale bar: 100 μm. h, Representative crystal violet staining of vehicle control and decitabine treated Huh7 and Hep3B cells in long-term growth assays. Data presented as mean ± s.e.m. of three independent experiments; statistical significance was determined by the Kolmogorov Smirnov (K-S) test (b) or a two-tailed Student’s t-test (c, g). Experiments were repeated three times independently, with similar results (d).
Fig. 4.
Fig. 4.. Identification of GSK3 inhibitors as senolytics in MAT2A-inhibited liver cancer cells.
a, Scheme of kinase inhibitor library screen in control and FIS Huh7 cells. b, Quantification of relative cell viability in control and FIS Huh7 cells from kinase inhibitor screen. Each dot represents a kinase inhibitor at 2.5 μM. Two red dots represent BIO and CHIR99021, respectively. Relative activity for BIO and CHIR99021 in control and FIS Huh7 cells are shown in the table. c, Relative cell numbers of Huh7 cell line treated with indicated doses of LY2090314 and CHIR98014 for 72 hours. d, Relative cell numbers of Huh7 cell line treated with indicated doses of LY2090314 and CHIR98014 over time. e, Representative crystal violet staining of vehicle control and FIS Huh7 and Hep3B cells treated with indicated doses of LY2090314. f, Cell viability (% PI-) of Huh7 cells treated with indicated doses of LY2090314. g, Representative crystal violet staining of FIS Huh7 cells transfected with indicated siRNAs. Data presented as mean ± s.e.m. of three independent experiments; statistical significance was determined by a two-tailed Student’s t-test (c, d, f). Experiments were repeated three times independently, with similar results (e, g).
Fig. 5.
Fig. 5.. GSK3 inhibition promotes senolysis partially through apoptosis in TIS.
a, Representative crystal violet staining of FIS Huh7 cells treated with 0.5 μM LY2090314 (L0.5) with or without additional indicated chemicals for 96 hours. Fer-1: Ferrostatin-1,1 or 2 μM. Olaparib, 1 or 4 μM. CQ: Chloroquine, 10 μM. BafA1: bafilomycin A1, 10 nM. b, Representative crystal violet staining of FIS Huh7 cells treated for 96 hours with indicated single or combination treatment groups. c, Western blot analysis of Huh7 cells expressing indicated sgRNAs. GAPDH serves as a loading control. d, Representative crystal violet staining of FIS Huh7 cells expressing indicated sgRNAs with or without 0.5 μM LY2090314 (L0.5) treatment for 96 hours. e, Western blot analysis of Caspase3, Caspase 8, Caspase 9 and GAPDH isolated from FIS Huh7 cells with or without 0.5 μM LY2090314 (L0.5) treatment at indicated time points. The arrows indicate the target bands. f, Representative crystal violet staining of FIS Huh7 cells from vehicle, LY2090314 (L0.5), zVAD (50 μM) and combined LY2090314 (L0.5)/zVAD (50 μM) treatment groups. g, Q-PCR analysis of FADD mRNA levels in control and knocked down cells. h, Representative crystal violet staining of FIS Huh7 cells from shCtrl and shFADD-1/2 groups with or without 0.5 μM LY2090314 treatment for 96 hours. Data presented as mean ± s.e.m. of three independent experiments; statistical significance was determined by a two-tailed Student’s t-test (g). Experiments were repeated three times independently, with similar results (a-f, h).
Fig. 6.
Fig. 6.. Combined MAT2A and GSK3 inhibition therapeutically limits liver tumor growth.
a, Representative crystal violet staining of Huh7 cells treated with indicated doses of drug combination for 12 days. b, Quantification of Huh7 and Hep3B xenograft tumor volumes over time in vehicle control (Veh) and FIDAS-5, LY2090314 and combined FIDAS-5/LY2090314 treatment groups. Huh7: n=6 for each group. Hep3B: n=5 female mice for Veh, n=6 female mice for FIDAS-5, n=6 female mice for LY2090314, n=7 female mice for combination group. c, d, Representative SA-β-gal staining (c) and quantification (d) of Huh7 and Hep3B xenograft tumor sections obtained from indicated treatment groups. Huh7: n=6 female mice for each group. Hep3B: n=5 female mice for Veh, n=6 female mice for FIDAS-5, n=6 female mice for LY2090314, n=7 female mice for combination group. To quantify, 5 representative images with a ×200 field of view (FOV) were used for quantification using Image J and averaged for each animal. Scale bar: 100 μm. e, f, Representative IHC images (e) and quantification (f) of PCNA and γH2AX staining in Huh7 xenograft tumor sections resected from indicated treatment groups. To quantify, 3–5 representative images with a ×200 FOV were used for quantification using Image J and averaged for each animal. n=6 mice for each group. Scale bar: 100 μm. g, Quantification of HepaMP9–1 allograft tumor volume over time in vehicle control (Veh, n=5 male mice) and FIDAS-5 (n=7 male mice), LY2090314 (n=4 male mice) and combined FIDAS-5/LY2090314 (n=6 male mice) treatment groups. h, Quantification of end point HepaMP9–1 allograft tumor weights in vehicle control (Veh, n=5 male mice) and FIDAS-5 (n=7 male mice), LY2090314 (n=4 male mice) and combined FIDAS-5/LY2090314 (n=6 male mice) treatment groups. i, Scheme of liver tumorigenesis and drug treatments of wildtype mice. j, Kaplan–Meier overall survival curves of indicated groups of mice. Veh: n=12 male mice, FIDAS-5: n=11 male mice, LY2090314: n=11 male mice, and Combination: n=14 male mice. Data presented as mean ± s.e.m. (b, d, f, g, h); statistical significance was determined by a two-tailed Student’s t-test (b,d,f,g,h) or log-rank Mantel–Cox test (j). Experiments were repeated three times independently, with similar results (a).

Similar articles

Cited by

References

    1. Siegel RL, Miller KD, Fuchs HE & Jemal A. Cancer Statistics, 2021. CA Cancer J Clin 71, 7–33 (2021). - PubMed
    1. Cancer Genome Atlas Research Network. Electronic address, w.b.e. & Cancer Genome Atlas Research, N. Comprehensive and Integrative Genomic Characterization of Hepatocellular Carcinoma. Cell 169, 1327–1341 e1323 (2017). - PMC - PubMed
    1. Finn RS et al. Atezolizumab plus Bevacizumab in Unresectable Hepatocellular Carcinoma. N Engl J Med 382, 1894–1905 (2020). - PubMed
    1. Hanahan D. & Weinberg RA Hallmarks of cancer: the next generation. Cell 144, 646–674 (2011). - PubMed
    1. DeBerardinis RJ & Chandel NS We need to talk about the Warburg effect. Nat Metab 2, 127–129 (2020). - PubMed

MeSH terms