

This is a preprint.
Transposable elements may enhance antiviral resistance in HIV-1 elite controllers
- PMID: 38168352
- PMCID: PMC10760019
- DOI: 10.1101/2023.12.11.571123
Transposable elements may enhance antiviral resistance in HIV-1 elite controllers
Abstract
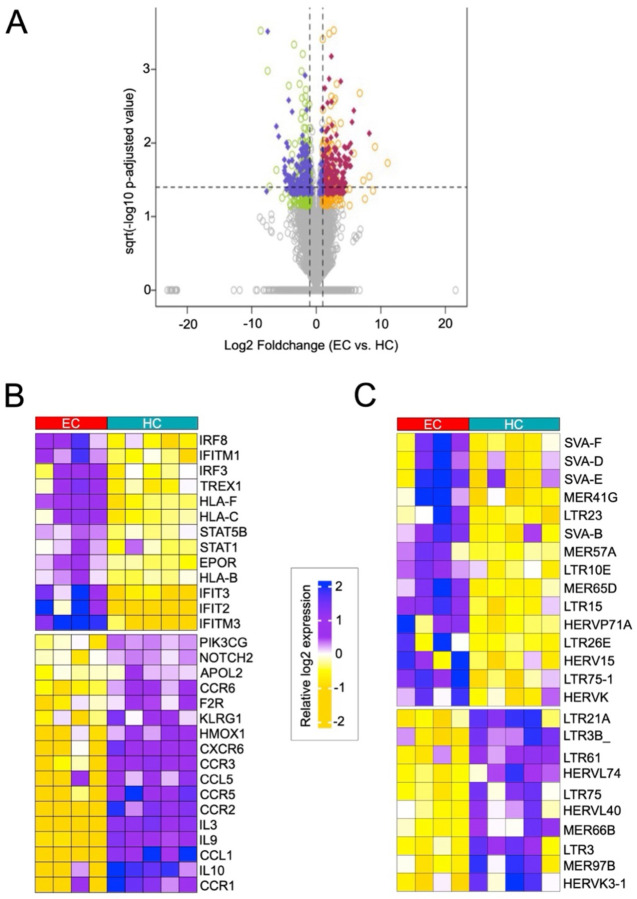
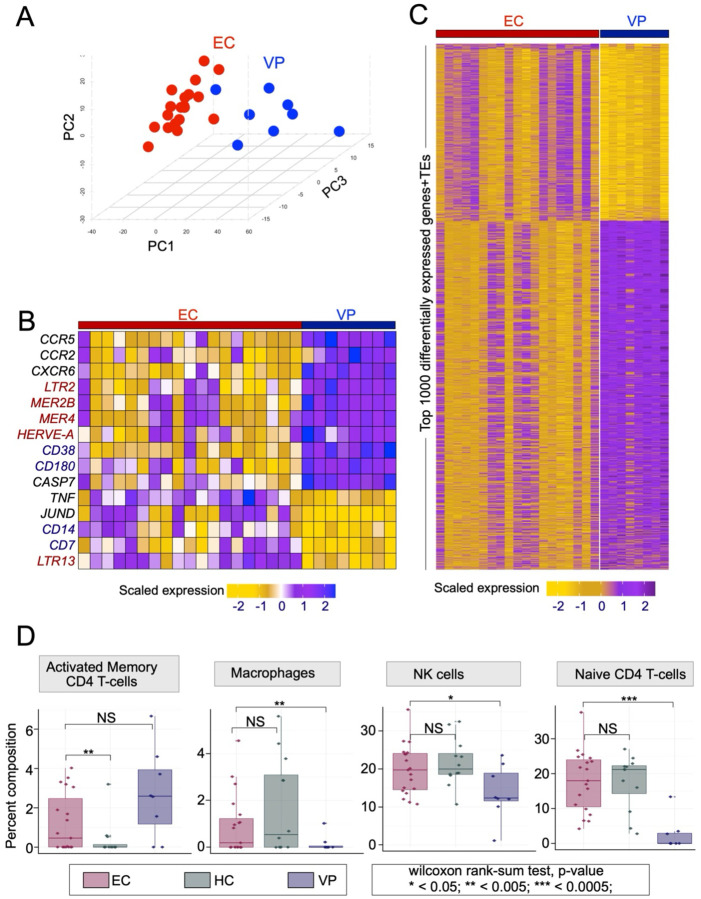
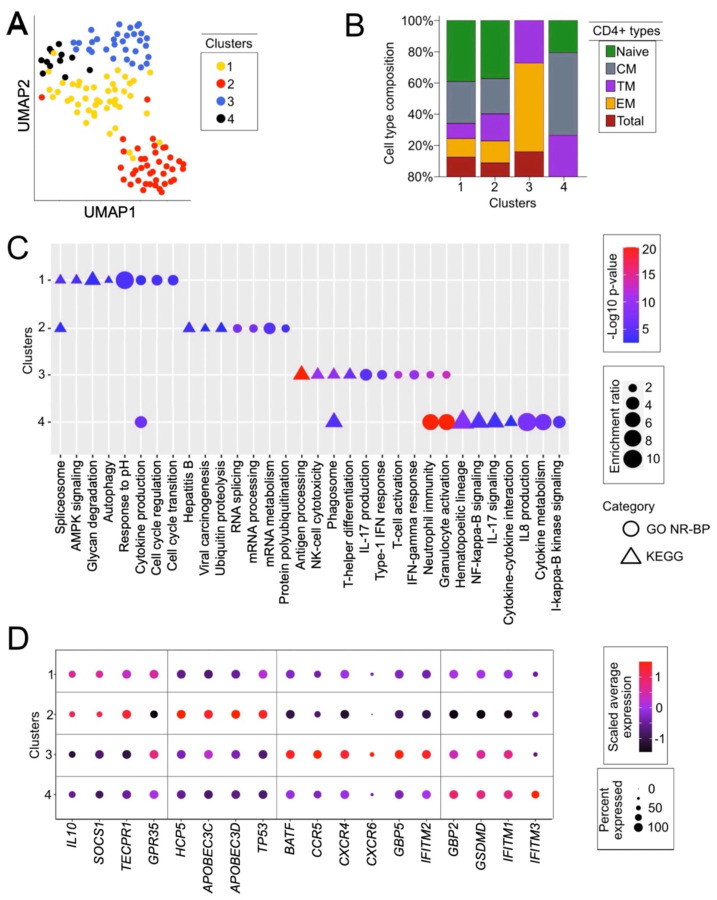
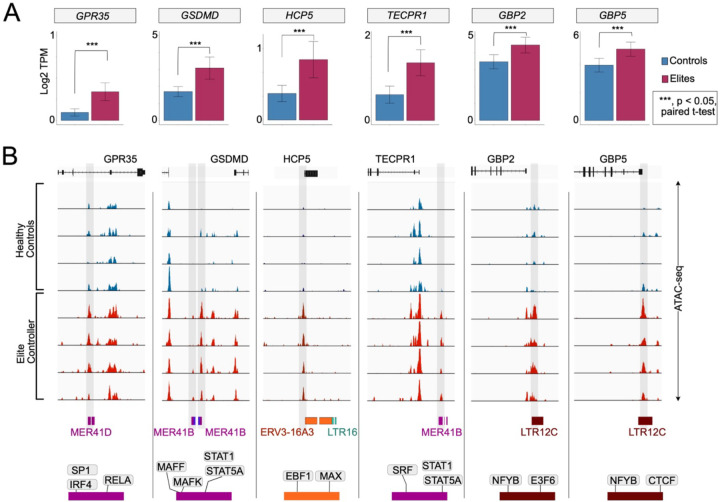
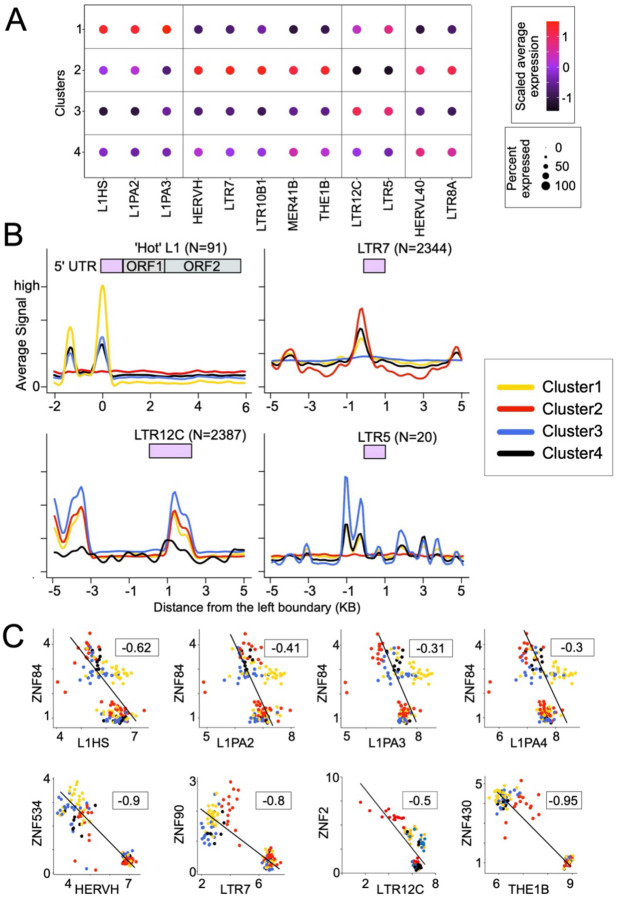
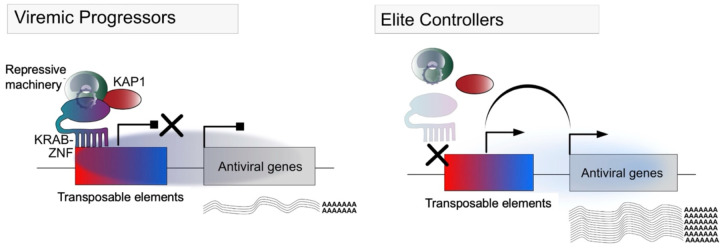
Less than 0.5% of people living with HIV-1 are elite controllers (ECs) - individuals who have a replication-competent viral reservoir in their CD4+ T cells but maintain undetectable plasma viremia without the help of antiretroviral therapy. While the EC CD4+ T cell transcriptome has been investigated for gene expression signatures associated with disease progression (or, in this case, a lack thereof), the expression and regulatory activity of transposable elements (TEs) in ECs has not been explored. Yet previous studies have established that TEs can directly impact the immune response to pathogens, including HIV-1. Thus, we hypothesize that the regulatory activities of TEs could contribute to the natural resistance of ECs against HIV-1. We perform a TE-centric analysis of previously published multi-omics data derived from EC individuals and other populations. We find that the CD4+ T cell transcriptome and retrotranscriptome of ECs are distinct from healthy controls, treated patients, and viremic progressors. However, there is a substantial level of transcriptomic heterogeneity among ECs. We categorize individuals with distinct chromatin accessibility and expression profiles into four clusters within the EC group, each possessing unique repertoires of TEs and antiviral factors. Notably, several TE families with known immuno-regulatory activity are differentially expressed among ECs. Their transcript levels in ECs positively correlate with their chromatin accessibility and negatively correlate with the expression of their KRAB zinc-finger (KZNF) repressors. This coordinated variation is seen at the level of individual TE loci likely acting or, in some cases, known to act as cis-regulatory elements for nearby genes involved in the immune response and HIV-1 restriction. Based on these results, we propose that the EC phenotype is driven in part by the reduced availability of specific KZNF proteins to repress TE-derived cis-regulatory elements for antiviral genes, thereby heightening their basal level of resistance to HIV-1 infection. Our study reveals considerable heterogeneity in the CD4+ T cell transcriptome of ECs, including variable expression of TEs and their KZNF controllers, that must be taken into consideration to decipher the mechanisms enabling HIV-1 control.
Figures
Similar articles
-
Cytokines Elevated in HIV Elite Controllers Reduce HIV Replication In Vitro and Modulate HIV Restriction Factor Expression.J Virol. 2017 Feb 28;91(6):e02051-16. doi: 10.1128/JVI.02051-16. Print 2017 Mar 15. J Virol. 2017. PMID: 28053103 Free PMC article.
-
An integrative genomic analysis of transcriptional profiles identifies characteristic genes and patterns in HIV-infected long-term non-progressors and elite controllers.J Transl Med. 2019 Jan 21;17(1):35. doi: 10.1186/s12967-019-1777-7. J Transl Med. 2019. PMID: 30665429 Free PMC article.
-
Plasmatic Levels of IL-18, IP-10, and Activated CD8+ T Cells Are Potential Biomarkers to Identify HIV-1 Elite Controllers With a True Functional Cure Profile.Front Immunol. 2018 Jul 11;9:1576. doi: 10.3389/fimmu.2018.01576. eCollection 2018. Front Immunol. 2018. PMID: 30050532 Free PMC article.
-
Learning to Be Elite: Lessons From HIV-1 Controllers and Animal Models on Trained Innate Immunity and Virus Suppression.Front Immunol. 2022 Apr 27;13:858383. doi: 10.3389/fimmu.2022.858383. eCollection 2022. Front Immunol. 2022. PMID: 35572502 Free PMC article. Review.
-
"Block and lock" viral integration sites in persons with drug-free control of HIV-1 infection.Curr Opin HIV AIDS. 2024 May 1;19(3):110-115. doi: 10.1097/COH.0000000000000845. Epub 2024 Feb 28. Curr Opin HIV AIDS. 2024. PMID: 38457193 Review.
References
-
- The path that ends AIDS: UNAIDS Global AIDS Update 2023. (n.d.). Retrieved November 8, 2023, from https://www.unaids.org/en/resources/documents/2023/global-aids-update-2023
-
- HIV and AIDS. (n.d.). Retrieved May 31, 2023, from https://www.who.int/news-room/fact-sheets/detail/hiv-aids
-
- Global HIV & AIDS statistics—Fact sheet. (n.d.). Retrieved January 19, 2023, from https://www.unaids.org/en/resources/fact-sheet
-
- Research priorities for an HIV cure: International AIDS Society Global Scientific Strategy 2021 | Nature Medicine. (n.d.). Retrieved August 18, 2023, from https://www.nature.com/articles/s41591-021-01590-5 - PubMed
-
- Hütter G., Nowak D., Mossner M., Ganepola S., Müssig A., Allers K., Schneider T., Hofmann J., Kücherer C., Blau O., Blau I. W., Hofmann W. K., & Thiel E. (2009). Long-term control of HIV by CCR5 Delta32/Delta32 stem-cell transplantation. The New England Journal of Medicine, 360(7), 692–698. 10.1056/NEJMoa0802905 - DOI - PubMed
Publication types
Grants and funding
LinkOut - more resources
Full Text Sources
Research Materials