. 2024 Jan 2;15(1):180.
doi: 10.1038/s41467-023-44239-2.

Mutant p53 gains oncogenic functions through a chromosomal instability-induced cytosolic DNA response

Affiliations

Mutant p53 gains oncogenic functions through a chromosomal instability-induced cytosolic DNA response

Mei Zhao et al. Nat Commun. .

Abstract

Inactivating TP53 mutations leads to a loss of function of p53, but can also often result in oncogenic gain-of-function (GOF) of mutant p53 (mutp53) proteins which promotes tumor development and progression. The GOF activities of TP53 mutations are well documented, but the mechanisms involved remain poorly understood. Here, we study the mutp53 interactome and find that by targeting minichromosome maintenance complex components (MCMs), GOF mutp53 predisposes cells to replication stress and chromosomal instability (CIN), leading to a tumor cell-autonomous and cyclic GMP-AMP synthase (cGAS)-stimulator of interferon genes (STING)-dependent cytosolic DNA response that activates downstream non-canonical nuclear factor kappa light chain enhancer of activated B cell (NC-NF-κB) signaling. Consequently, GOF mutp53-MCMs-CIN-cytosolic DNA-cGAS-STING-NC-NF-κB signaling promotes tumor cell metastasis and an immunosuppressive tumor microenvironment through antagonizing interferon signaling and regulating genes associated with pro-tumorigenic inflammation. Our findings have important implications for understanding not only the GOF activities of TP53 mutations but also the genome-guardian role of p53 and its inactivation during tumor development and progression.


Conflict of interest statement

The authors declare no competing interests.

Figures

Fig. 1
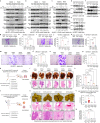
Fig. 1. mutp53 interacts with MCMs.
a Bar graph of enriched terms across input gene lists (colored by P-values) from SILAC/immunoprecipitation (IP) purification and mass spectrometry of G245D mutp53 interactome in UM-SCC-1 stable cells from Metascape analysis. Pairwise similarities between any two enriched terms were computed based on a Kappa-test score. The similarity matrix was then hierarchically clustered and a 0.3 similarity threshold was applied to trim the resultant tree into separate clusters. The most significant (lowest P-value) term within each cluster was chosen to represent the cluster in the bar graph. b p53 antibody (DO-1) IP/Western blot analysis using MDA1586 cell lysates and MCM5 antibody. Cells with mutp53 knockdown (shp53) were used as the control to evaluate the specificity of the IP. Normalized quantitative results (densitometry) calculated using NIH Image J software are shown under each blot. IB, immunoblotting. c MCM5 antibody IP/Western blot analysis using PCI-15B cell lysates and p53 antibody. IFN-γ, 200 IU, 30 min. d HA antibody IP/Western blot analysis of HEK293-FT cells co-transfected with V5-tagged MCM5 and Flag-HA-tagged wtp53 or various mutp53s. e Summary of the results from d. f HA antibody IP/Western blot analysis of HEK293-FT cells co-transfected with Flag-HA-tagged R273H mutp53 and various V5-tagged MCM components. g p53 antibody IP/Western blot analysis using MDA1586 cells and various MCM antibodies. Shp53, cells with mutp53 knockdown. Source data are provided as a Source Data file.
Fig. 2
Fig. 2. GOF mutp53 predisposes cells to replication stress and CIN through MCM5.
ac Western blot analyses using the cytosol and chromatin-bound fractions from the indicated stable cell lines. Overexpression in stable cell lines was established by sequential retroviral (pBabe-wt/mutp53s) and lentiviral (pLVX-MCM5) infections (a, b). Gene downregulation in cell lines was established by sequential lenti-shp53 and two independent doxycycline (DOX)-inducible-shMCM5 lentiviral infections (shMCM5-C or -G) (c). In c, cells were cultured in a medium with DOX (200 ng/mL) for 48 to 96 h before further hydroxyurea (HU) treatment. NT, non-target. pBabe and pLVX were the control empty vectors. pRPA32, phospho-RPA32. MEK1/2, mitogen-activated protein kinase 1/2. ORC2, origin recognition complex 2. d Examples of the metaphase spreads of hTERT HAK cl41-p53KO-c1 stable cells in the absence or presence of HU treatment. Representative chromosomal abnormalities are marked by arrows (red, fragments/double minutes; light blue, fusions). e Summary of chromosomal abnormalities (breaks, fragments, fusions, and tetraploidy/polyploidy) in the metaphase spreads of hTERT HAK cl41-p53KO-c1 stable cells in the absence or presence of HU treatment. Source data are provided as a Source Data file.
Fig. 3
Fig. 3. GOF mutp53-MCM5-mediated replication stress and CIN stimulate cytosolic DNA accumulation and NC-NF-κB activation.
a, c Representative immunofluorescence (IF) staining images of cytosolic dsDNA in the indicated stable cell lines in the absence or presence of hydroxyurea (HU) (100 μM, 48 h). Scale bar, 10 μm. b, d Violin plots of the mean fluorescent intensity (MFI) per cell of cytosolic dsDNA in the indicated stable cell lines. Bars represent the median ± quartiles; n = 167 (pBabe-PLVX), 82 (pBabe-PLVX + HU), 110 (pBabe-MCM5), 227 (pBabe-MCM5 + HU), 106 (G245D-PLVX), 227 (G245D-PLVX + HU), 221 (G245D-MCM5), 183 (G245D-MCM5 + HU) (b); n = 560 (Lenti-ctrl-shNT), 202 (Lenti-ctrl-shNT + HU), 346 (shp53-shNT), 196 (shp53-shNT + HU), 376 (shp53-shMCM5-C), 259 (shp53-shMCM5-C + HU), 280 (shp53-shMCM5-G), 98 (shp53-shMCM5-G + HU) (d). e, f Western blot analyses of the cytosolic and nuclear fractions of the indicated cells. g, i Representative IF staining images of RelB in the indicated stable cell lines in the absence or presence of hydroxyurea (HU; 100 μM, 48 h). Scale bar, 10 μm. h, j Violin plots of the MFI of nuclear RelB per cell in the indicated stable cell lines. Bars represent the median ± quartiles; n = 48 (pBabe-pLVX), 54 (pBabe-pLVX + HU), 26 (pBabe-MCM5), 78 (pBabe-MCM5 + HU), 41 (G245D-pLVX), 74 (G245D-pLVX + HU), 28 (G245D-MCM5), 105 (G245D-MCM5 + HU) (h); n = 250 (Lenti-ctrl-shNT), 138 (Lenti-ctrl-shNT + HU), 73 (shp53-shNT), 105 (shp53-shNT + HU), 181 (shp53-shMCM5-C), 203 (shp53-shMCM5-C + HU), 174 (shp53-shMCM5-G), 112 (shp53-shMCM5-G + HU) (j). Cells were incubated with doxycycline (200 ng/mL) for 48 h before further HU treatment (c), (d), (f), (i), and (j). Significances were tested by the Kruskal–Wallis test with Dunn’s multiple comparisons. Source data are provided as a Source Data file.
Fig. 4
Fig. 4. GOF mutp53 promotes tumor cell invasion and metastasis through cGAS-STING-NC-NF-κB signaling.
ae Western blot analyses of UM-SCC-1 stable cells with CGAS (a), STING1 (b, c) or RelB knockdown (d, e). f Western blot analysis of murine 4T1 stable cells that were first stably introduced with mouse R270H mutp53 (equivalent to human R273H mutp53) and then with RelB knockdown. gp CGAS, STING or RelB knockdown impairs mutp53-mediated migration and invasion. Shown are representative images (g, i, k, m, and o) and the summary graphs (h, j, l, n, and p) of the invasion of the indicated stable cell lines. n = 12 (pBabe-shNT), 9 (R273H-shNT), 10 (R273H-shcGAS-1), 10 (R273H-shcGAS-2) (h); n = 3 in each group (j, n, and p); n = 12 (pBabe-shNT), 11 (G245D-shNT), 10 (G245D-shSting-1) (l). Scale bar, 100 μm (g, i, k, m, and o). q and t Schematic representation created with BioRender.com of tail-vein injection of human UM-SCC-1 stable cell lines into nude mice (q) or orthotopic injection of murine 4T1 stable cell lines into BALB/c mice (t). r, u Representative macroscopic and corresponding microscopic hematoxylin and eosin (H & E) staining images of mouse lungs from nude mice 18 weeks after tail-vein injection with human UM-SCC-1 stable cells (106 cells/mouse) (r) or from BALB/c mice 4 weeks after mammary fat pad injection with the indicated mouse 4T1 stable cell lines (1.5 × 105 cells/mouse) (u). Arrows: lung metastatic nodules/lesions. The lower panels in u are the magnified images of the corresponding box areas in the middle panels. s Mean percentage of lung microscopic tumor metastasis areas from r. n = 3 in each group. See the Methods for details. v Numbers of lung macroscopic metastasis nodules from u. n = 11 in each group. w Mean percentage of microscopic metastasis areas from u. n = 3 in each group. See the Methods for details. pBabe and pLVX: empty control vectors. shNT and pLKO.1-NT: non-target shRNA controls. Data shown present the mean ± SD (h), (j), (l), (n), (p), (s), and (w) or ± quartiles (v). Significances were tested using one-way ANOVA with Tukey’s multiple comparisons test. Source data are provided as a Source Data file.
Fig. 5
Fig. 5. GOF mutp53-NC-NF-κB signaling promotes tumor immunosuppression.
a, b Primary tumor growth of mouse 4T1 stable cells orthotopically injected into BALB/c (a) or NOD SCID (b) mice. n = 11 in each group (a); n = 5 in each group (b). c Representative H & E and corresponding RelB immunofluorescent images in 4T1 stable cell tumors from BALB/c mice. Middle panel: cytosol vs. nuclei images from artificial intelligence (AI)-based analyses (see Methods). Scale bar, 50 μm. d Quantitative RelB nuclei/cytosol ratio from 4T1 stable cell tumors from BALB/c mice. n = 57,370 (pLVX-pLKO.1-NT), 78,073 (R270H-pLKO.1-NT). e Representative H & E and corresponding multiplex CD3 and CD8 immunofluorescent images from a 4T1 stable cell tumor from BALB/c mouse (panels i–iv). Panel v: AI-based CD3 and CD8 phenotyping image of panels ii–iv. Scale bar, 50 μm. f, g Quantitative results of CD3+ and CD8+ cells in tumor areas of 4T1 stable cell tumors from BALB/c mice (see Methods). n = 4 in each group. Each point represents the data generated from counting T cells in all tumor areas (0.3–1.7 × 106 cells) of a whole section from different tumors in each group. h, j, and l Representative MIBI images (left) and phenotypes (right) of immune cell markers as indicated in 4T1 stable cell tumors from BALB/c mice. Scale bars, 36 μm (h, l) and 26 μm (j). i, k, and m Quantitative results of granzyme B+ cells (i), DCs (k), and lymphoid tissue-resident CD11b+ cDCs (m) in 4T1 stable cell tumors from BALB/c mice. n = 13 (pLVX-pLKO.1-NT), 13 (R270H-pLKO.1-NT), 12 (R270H-shRelB1) (i, k, and m). Data shown present the mean ± SEM (a) and (b), or ±quartiles (d), or ±SD (f), (g), (i), (k), and (m). Significances were tested using one-way ANOVA with Tukey’s multiple comparisons test (a), two-tailed Wilcoxon-signed rank test (d), Kruskal–Wallis test with Dunn’s multiple comparisons test (f), (g), (i), (k), and (m). Source data are provided as a Source Data file.
Fig. 6
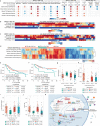
Fig. 6. GOF mutp53-induced MCM5-STING-NC-NF-κB signaling antagonizes IFN signaling and regulates inflammation-related genes associated with immunosuppression and tumor progression of OSCC.
a Summary of normalized enrichment scores (NES) of GSEA Hallmark pathways of IFN and inflammation-related signaling that were significantly enriched (false-discovery rate q-values [FDRq] <25%]) for the indicated comparisons of cell lines. +HU: 100 μM, 48 h. b, c Hierarchical clustering analyses of the 97 genes (x-axis) in the Hallmark IFNα response gene set (b) and of the 200 genes in the Hallmark IFNγ response gene set (c) for the indicated comparisons of UM-SCC-1 stable cell lines in the presence of HU (+HU: 100 μM, 48 h). d Hierarchical clustering analysis of single-sample GSEA scores for the Hallmark GSEA IFN and inflammation-related (Inf) signaling pathways for each of the 221 TCGA patients with HPV-negative, TP53-mutant OSCC (x-axis). The analysis revealed 4 patient groups with distinct gene expression profiles. e, f Five-year overall survival (OS) and disease-specific survival (DSS) for the 221 patients with HPV-negative TP53-mutant OSCC with the indicated IFN and Inf gene expression profiles. L, low; H, high. gj Box plots of EMT and immune enrichment scores of the 221 HPV-negative and TP53-mutant OSCCs with the indicated IFN and Inf gene expression profiles. The number of patients in each group was IFNH/InfL = 52, IFNL/InfH = 25, All High = 58, and All Low = 86. Shown are the mean immune enrichment scores (±SD) in each group. Boxes represent the interquartile range (IQR) and the horizontal line indicates the median. The whiskers extend to the last data point within 1.5×IQR. Significances were tested using Kruskal–Wallis test and the two-sided steel-dwass test (gj). k A working model of the mutp53 GOF mechanism involving mutp53-MCMs-CIN-cytosolic DNA-cGAS-STING-NC-NF-κB signaling that promotes tumor metastasis, immunosuppression, and tumor progression. Created with BioRender.com (k). Source data are provided as a Source Data file.

Similar articles

Cited by

References

    1. Eischen CM. Genome stability requires p53. Cold Spring Harb. Perspect. Med. 2016;6:a026096. doi: 10.1101/cshperspect.a026096. - DOI - PMC - PubMed
    1. Livingstone LR, et al. Altered cell cycle arrest and gene amplification potential accompany loss of wild-type p53. Cell. 1992;70:923–935. doi: 10.1016/0092-8674(92)90243-6. - DOI - PubMed
    1. Wahl G, Vafa O. Genetic instability, oncogenes, and the p53 pathway. Cold Spring Harb. Symp. Quant. Biol. 2000;65:511–520. doi: 10.1101/sqb.2000.65.511. - DOI - PubMed
    1. Kastan MB. Wild-type p53: tumors can’t stand it. Cell. 2007;128:837–840. doi: 10.1016/j.cell.2007.02.022. - DOI - PubMed
    1. Lane DP. Cancer. p53, guardian of the genome. Nature. 1992;358:15–16. doi: 10.1038/358015a0. - DOI - PubMed