. 2024 Jan 2;21(1):2.
doi: 10.1186/s12986-023-00777-6.

Deficiency of Trex1 leads to spontaneous development of type 1 diabetes

Affiliations

Deficiency of Trex1 leads to spontaneous development of type 1 diabetes

Jiang-Man Zhao et al. Nutr Metab (Lond). .

Abstract

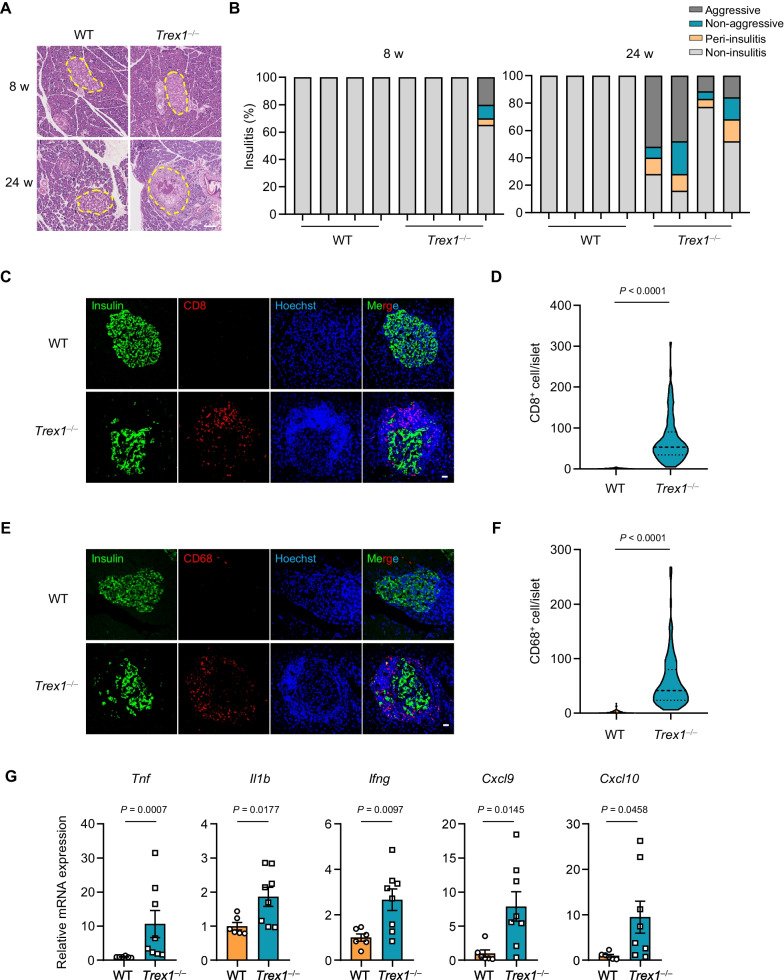
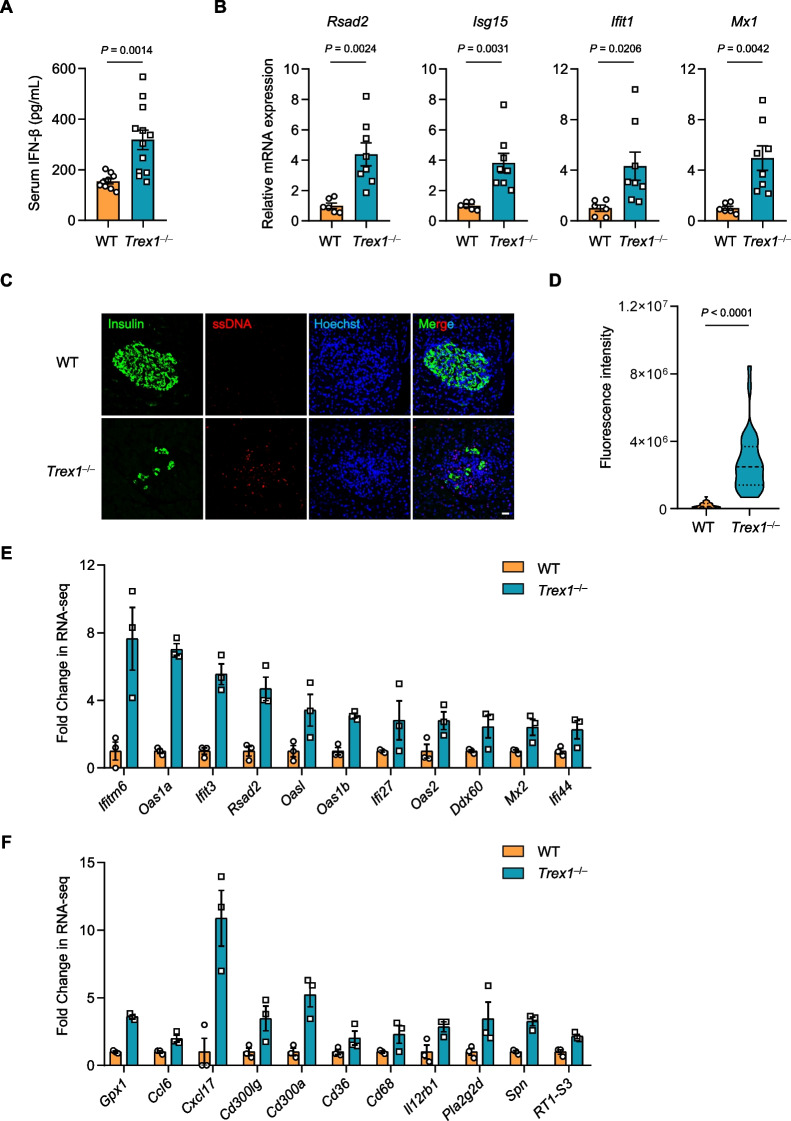
Background: Type 1 diabetes is believed to be an autoimmune condition, characterized by destruction of insulin-producing cells, due to the detrimental inflammation in pancreas. Growing evidences have indicated the important role of type I interferon in the development of type 1 diabetes.

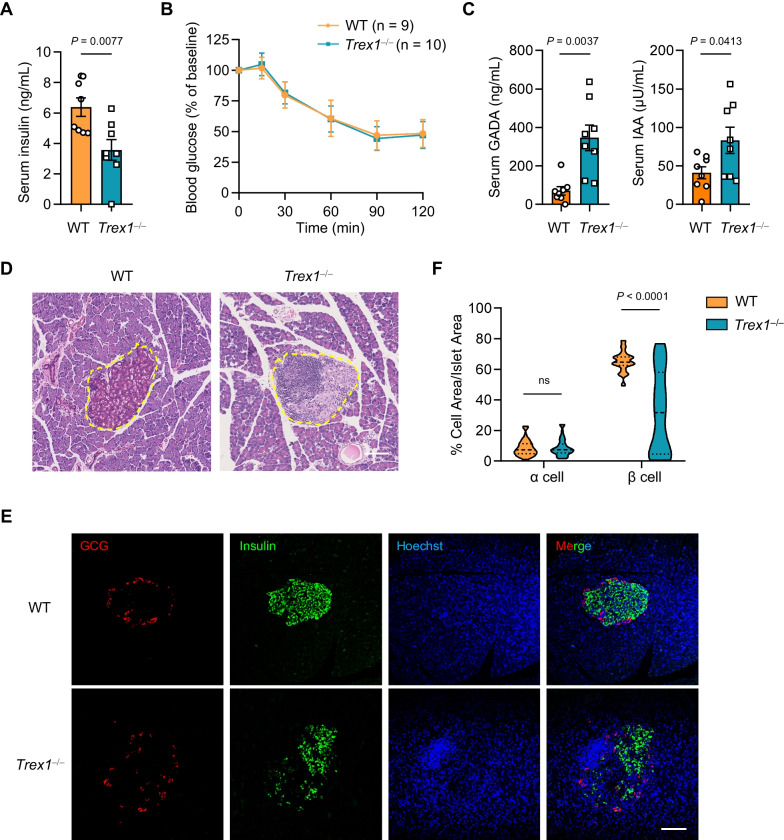
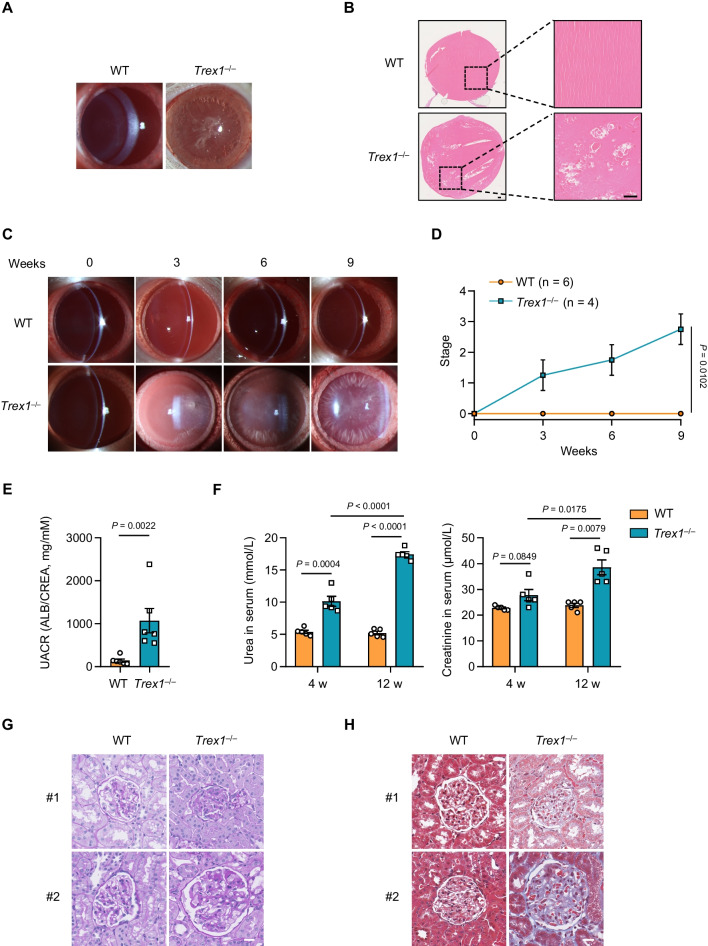
Methods: Trex1-deficient rats were generated by using CRISPR-Cas9. The fasting blood glucose level of rat was measured by a Roche Accuchek blood glucose monitor. The levels of insulin, islet autoantibodies, and interferon-β were measured using enzyme-linked immunosorbent assay. The inflammatory genes were detected by quantitative PCR and RNA-seq. Hematein-eosin staining was used to detect the pathological changes in pancreas, eye and kidney. The pathological features of kidney were also detected by Masson trichrome and periodic acid-Schiff staining. The distribution of islet cells, immune cells or ssDNA in pancreas was analyzed by immunofluorescent staining.

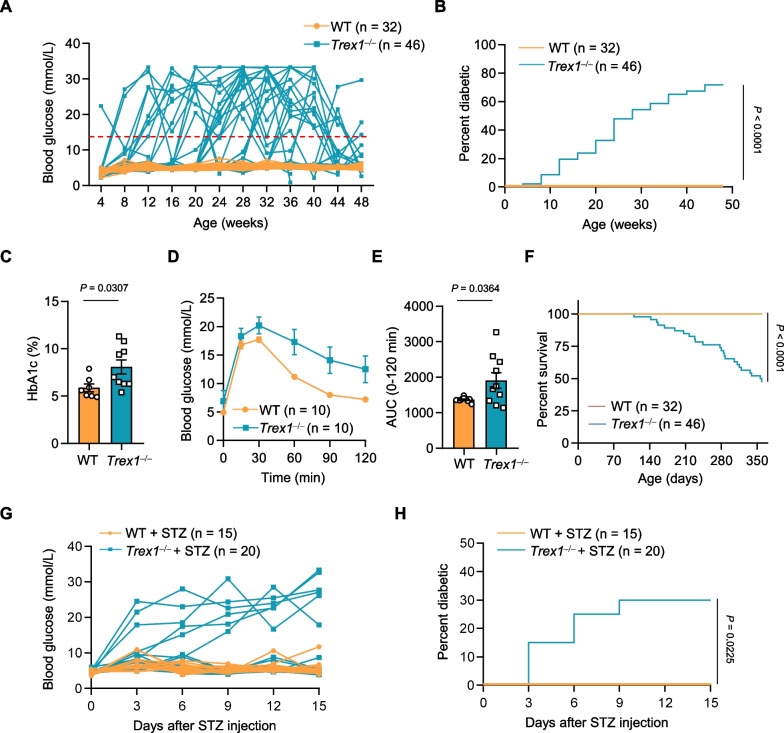
Results: In this study, we established a Trex1-deletion Sprague Dawley rat model, and unexpectedly, we found that the Trex1-/- rats spontaneously develop type 1 diabetes. Similar to human diabetes, the hyperglycemia in rats is accompanied by diabetic complications such as diabetic nephropathy and cataract. Mechanistical investigation revealed the accumulation of ssDNA and the excessive production of proinflammatory cytokines, including IFN-β, in Trex1 null pancreas. These are likely contributing to the inflammation in pancreas and eventually leading to the decline of pancreatic β cells.

Conclusions: Our study links the DNA-induced chronic inflammation to the pathogenesis of type 1 diabetes, and also provides an animal model for type 1 diabetes studies.

Keywords: TREX1; Type 1 diabetes; Type I interferon.


Conflict of interest statement

The authors declare that they have no competing interests.

Figures

Fig. 1
Fig. 1
Trex1-deficient rats develop spontaneous diabetes. A Blood glucose levels of WT (n = 32; female, n = 20; male, n = 12) and Trex1−/− (n = 46; female, n = 26; male, n = 20) rats were measured monthly from 4 weeks postnatal until 48 weeks, and the individual values of blood glucose were plotted versus ages. B Diabetes incidence in WT (n = 32) or Trex1−/− (n = 46) rats from A. C Percent HbA1c in WT (n = 7) and Trex1−/− (n = 9) rats, the detected serum from different weeks of age. D The blood glucose changes after challenged with glucose, were measured with time, using WT (n = 10) and Trex1−/− (n = 10) rats at 12 weeks of age. Glucose was injected intraperitoneally at a dose of 2 g/kg. E Quantification of the area under curve (AUC) in D for the intraperitoneal glucose tolerance test. F Survival curve for WT (n = 32) and Trex1−/− (n = 46) rats from A. G Blood glucose was measured periodically from WT + STZ group (n = 15) or Trex1−/−  + STZ group (n = 20) after STZ injection. STZ, streptozotocin, intraperitoneal injection, 30 mg/kg. H Diabetes incidence in WT (n = 15) or Trex1−/− (n = 20) rats after STZ injection. All data are represented as mean ± SEM; Each dot represents one independent biological replicate; Log-rank (Mantel-Cox) test in B, F, H; Unpaired t test in C; Welch’s t test in E
Fig. 2
Fig. 2
Trex1-deficient rats develop Type 1 diabetes. A Serum insulin levels were measured in 8-week-old WT (n = 8) and Trex1−/− (n = 8) rats after fasting for 4 h. B Blood glucose levels during an intraperitoneal insulin tolerance test were monitored in WT (n = 9) and Trex1−/− (n = 10) rats at 16 weeks of age. C Serum GADA and IAA levels were measured by Elisa in 16-week-old WT (n = 8) and Trex1−/− (n = 8) rats. D Representative H&E staining images of pancreatic section from WT and Trex1−/− rats. Yellow circles indicate islets. Scale bar, 100 μm. E Representative fluorescence images of pancreatic sections from WT and Trex1−/− rats stained with insulin (green) and glucagon (red) antibodies, indicating β cells and α cells respectively. The cell nuclei were stained with Hoechst (blue). Scale bar, 100 μm. F Percentage of β cells and α cells in islets from WT (n = 3) and Trex1−/− (n = 3) rats. 15 islets in each of the rats were analyzed. All data are represented as mean ± SEM; Each dot represents one independent biological replicate; Unpaired t test in A, (C IAA); Welch’s t test in (C GADA); Two-way ANOVA with Sidak correction in F
Fig. 3
Fig. 3
Trex1-deficient rats exhibit insulitis and infiltration of immune cells. A Representative H&E staining images of pancreatic sections from WT and Trex1−/− rats at 8-week-old and 24-week-old. Yellow circles indicate islets. Scale bar, 100 μm. B Insulitis scoring was assessed on H&E-stained pancreatic sections from WT (n = 4) or Trex1−/− (n = 4) rats at 8 or 24 weeks of age. 20–30 islets in each of the rats were analyzed. C Representative fluorescence images of pancreatic sections from WT or Trex1−/− rats co-staining by insulin (green) and CD8 (red) antibodies. The cell nuclei were stained with Hoechst (blue). Scale bar, 20 μm. D Numbers of CD8+ cells in each islet from WT (n = 5) or Trex1−/− (n = 5) rats were quantified. 20 islets in each of the rats were analyzed. E Representative fluorescence images of pancreatic sections from WT or Trex1−/− rats co-stained by insulin (green) and CD68 (red) antibodies. The cell nuclei were stained with Hoechst (blue). Scale bar, 20 μm. F Numbers of CD68+ cells in each islet from WT (n = 5) or Trex1−/− (n = 5) rats were quantified. 20 islets in each of the rats were analyzed. G The mRNA levels of indicated genes were analyzed by qPCR in pancreas from WT (n = 6) or Trex1−/− (n = 8) rats. Normalized by the housekeeping gene Gapdh. All data are represented as mean ± SEM; Each column represents one rat in B; Each dot represents one islet in D, F or independent biological replicate in G; Mann Whitney test in D, F and (G Tnf); Welch’s t test in (G Il1b, Ifng, Cxcl9, Cxcl10)
Fig. 4
Fig. 4
Trex1 deficiency results in accumulation of ssDNA and elevated production of IFN-β in pancreas. A Serum from WT (n = 9) or Trex1−/− (n = 12) rats were obtained for ELISA analysis of IFN-β concentration. B The mRNA levels of Rsad2, Isg15, Ifit1, Mx1 in pancreas from WT (n = 6) and Trex1−/− (n = 8) rats were measured by qPCR. Normalized by the housekeeping gene Gapdh. C Representative fluorescence images of the pancreas from WT or Trex1−/− rats stained with antibodies recognizing ssDNA (red) and insulin (green). Nuclei were stained with Hoechst (blue). Scale bar, 20 μm. D Fluorescence scoring of ssDNA+ islets cell from WT or Trex1−/− rats were quantified. (n = 3 per group). 10 islets in each of the rats were analyzed. E Fold change of indicated ISGs transcripts from RNA-seq data in the pancreas of WT or Trex1−/− rats. F Fold change of indicated pro-inflammatory cytokines genes transcripts from RNA-seq data in the pancreas of WT or Trex1−/− rats. All data are represented as mean ± SEM; Each dot represents independent biological replicate; Welch’s t test in A, B; Mann Whitney test in D
Fig. 5
Fig. 5
Trex1-deficient rats develop diabetic cataracts and diabetic nephropathy. A Representative slit-lamp photographs of lens from WT or Trex1−/− rats. B Representative H&E images showing lens sections from WT or Trex1−/− rats. Scale bars, 100 μm. C Representative slit-lamp photographs of lens from different groups of animals at 0, 3, 6 and 9 weeks after the onset of diabetes in Trex1−/− rats. D The progression of diabetic cataracts in WT (n = 6) or Trex1−/− (n = 4) rats was quantified. E The UACR levels were calculated by the ratio of urinary albumin and creatinine in Trex1−/− rats at 8 and 12 weeks after the onset of diabetes (n = 6 per group). F The urea and creatinine levels in serum were quantified at 4 and 12 weeks after the onset of diabetes in Trex1−/− rats (n = 5 in each condition). G, H Representative images of kidney sections from WT or Trex1−/− rats stained by periodic acid–Schiff (PAS) G or Masson’s trichrome H. Scale bars, 20 μm. All data are represented as mean ± SEM; Each dot represents independent biological replicate; Repeated measure ANOVA with Sidak post hoc test in D; Mann Whitney test in E, (F creatinine 12 w); Unpaired t-test in (F urea, F creatinine 4 w and 12 w); Welch’s t test in (F creatinine 4 w)

Similar articles

Cited by

References

    1. Todd JA. Etiology of type 1 diabetes. Immunity. 2010;32(4):457–467. doi: 10.1016/j.immuni.2010.04.001. - DOI - PubMed
    1. Noble JA, Valdes AM, Varney MD, Carlson JA, Moonsamy P, Fear AL, et al. HLA class I and genetic susceptibility to type 1 diabetes: results from the Type 1 Diabetes Genetics Consortium. Diabetes. 2010;59(11):2972–2979. doi: 10.2337/db10-0699. - DOI - PMC - PubMed
    1. Op de Beeck A, Eizirik DL. Viral infections in type 1 diabetes mellitus—why the beta cells? Nat Rev Endocrinol. 2016;12(5):263–273. doi: 10.1038/nrendo.2016.30. - DOI - PMC - PubMed
    1. Hull CM, Peakman M, Tree TIM. Regulatory T cell dysfunction in type 1 diabetes: what’s broken and how can we fix it? Diabetologia. 2017;60(10):1839–1850. doi: 10.1007/s00125-017-4377-1. - DOI - PMC - PubMed
    1. Eizirik DL, Colli ML. Revisiting the role of inflammation in the loss of pancreatic beta-cells in T1DM. Nat Rev Endocrinol. 2020;16(11):611–612. doi: 10.1038/s41574-020-00409-6. - DOI - PubMed

LinkOut - more resources