. 2024 Jan 2;20(1):e1011893.
doi: 10.1371/journal.ppat.1011893. eCollection 2024 Jan.

Trichinella spiralis -induced immunomodulation signatures on gut microbiota and metabolic pathways in mice

Affiliations

Trichinella spiralis -induced immunomodulation signatures on gut microbiota and metabolic pathways in mice

Xi-Meng Sun et al. PLoS Pathog. .

Abstract

The hygiene hypothesis proposes that decreased exposure to infectious agents in developed countries may contribute to the development of allergic and autoimmune diseases. Trichinella spiralis, a parasitic roundworm, causes trichinellosis, also known as trichinosis, in humans. T. spiralis had many hosts, and almost any mammal could become infected. Adult worms lived in the small intestine, while the larvae lived in muscle cells of the same mammal. T. spiralis was a significant public health threat because it could cause severe illness and even death in humans who eat undercooked or raw meat containing the parasite. The complex interactions between gastrointestinal helminths, gut microbiota, and the host immune system present a challenge for researchers. Two groups of mice were infected with T. spiralis vs uninfected control, and the experiment was conducted over 60 days. The 16S rRNA gene sequences and untargeted LC/MS-based metabolomics of fecal and serum samples, respectively, from different stages of development of the Trichinella spiralis-mouse model, were examined in this study. Gut microbiota alterations and metabolic activity accompanied by parasite-induced immunomodulation were detected. The inflammation parameters of the duodenum (villus/crypt ratio, goblet cell number and size, and histological score) were involved in active inflammation and oxidative metabolite profiles. These profiles included increased biosynthesis of phenylalanine, tyrosine, and tryptophan while decreasing cholesterol metabolism and primary and secondary bile acid biosynthesis. These disrupted metabolisms adapted to infection stress during the enteral and parenteral phases and then return to homeostasis during the encapsulated phase. There was a shift from an abundance of Bacteroides in the parenteral phase to an abundance of probiotic Lactobacillus and Treg-associated-Clostridia in the encapsulated phase. Th2 immune response (IL-4/IL-5/IL-13), lamina propria Treg, and immune hyporesponsiveness metabolic pathways (decreased tropane, piperidine and pyridine alkaloid biosynthesis and biosynthesis of alkaloids derived from ornithine, lysine, and nicotinic acid) were all altered. These findings enhanced our understanding of gut microbiota and metabolic profiles of Trichinella -infected mice, which could be a driving force in parasite-shaping immune system maintenance.


Conflict of interest statement

The authors have declared that no competing interests exist.

Figures

Fig 1
Fig 1. Sampling Strategy and Inflammation Index of T. spiralis Infection.
(A) Infection and sampling strategy. (B) Physiological Changes. The number of worms observed in the small intestines and muscles of individual T. spiralis infection mice at each sampling time point (n = 5). (C) Body weights of infected (n = 7) and uninfected mice at each sampling time (n = 7). (D) H&E-stained duodenum represents sections from infected and uninfected mice at each time point (original magnification: ×10 or ×20). (E) Villus height to crypt depth (villus/crypt ratio). (F) The number of goblet cells per villus. (G) Goblet cell size. (H) Histological score (n = 6). *p < 0.05, **p < 0.01, ***p < 0.001.
Fig 2
Fig 2. Cytokine Profiles and the Differentiation of Treg Cells Measured by Mesenteric Lymph Nodes Isolated from T. spiralis Infected Mice.
On Days 6, 15, 30, and 60 after infection with T. spiralis, five infected mice at each time point were sacrificed, and MLNs were isolated. (A) The cells were sorted with CD3, CD4, CD25, and Foxp3 by FACS, and the percentage of CD25+ Foxp3+ cells in the CD4+ T cells population was shown. (B) The culture supernatants were collected after being incubated with α-CD3/CD28 for 48 h, and the concentrations of IL-4, IL-5, IL-10, IL-13, IL-2, IFN-γ, IL-17A, and IL-6 were measured by ELISA. Data are from three independent experiments expressed as mean SEM, with * P < 0.05, ** P < 0.01, and *** P< 0.001 compared to the uninfected group.
Fig 3
Fig 3. T. spiralis Infection Enhanced Residential Tregs in Lamina Propria of the Large Intestine.
Forty-eight Foxp3EGFP mice were randomly assigned to infected (N = 24) and uninfected (N = 24) groups. On Days 6, 15, 30, and 60 after infection with T. spiralis, 6 infected or uninfected mice at each time point were sacrificed, and the colon was isolated. (A) Immunofluorescence analysis of Foxp3 expression. It was mainly observed on CD4+ Treg (×400 magnification). EGFP, Enhanced Green Fluorescent Protein, Cy3, indocarbocyanin red, and DAPI, 4′,6-Diamidino-2- phenylindoldihydrochlorid blue–nuclear counterstaining. (B) The number of Foxp3+ cells per field.
Fig 4
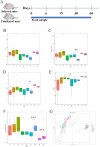
Fig 4. Infection with T. spiralis modulates the colon microbiota in mice.
The experimental design of murine infection, as well as the taxonomic and α and β diversity of gut microbiomes on days 0, 6, 15, 30, and 60 after infection with T. spiralis, ten infected mice at each time point were sacrificed, and the feces were collected. The α diversity refers to the diversity within a sample, while β diversity refers to the diversity between samples. (A) The murine infection experimental design. (B) Comparison of Chao 1 index (an α diversity indicator used to estimate the total number of microbial species) between infection and control groups. (C) Comparison of observed species between two groups. (D) Comparison of the Shannon index (a measure of diversity considering the number and abundance of species in a sample) between two groups. (E) Comparison of Simpson index (a measure of diversity considering the number of species and their relative abundance) between two groups. (F) Unweighted pairwise UniFrac distances were averaged within each group to calculate an average diversity value (a proxy for inter-individual variation). (G) PCoA plot based on the unweighted UniFrac distance (to compare whether there were significant differences in microbial communities in specific evolutionary lineages of samples) of gut microbiota by positioning each sample from infected vs. uninfected group (I6 vs. C6 group, P = 0.3631; I15 vs. C15 group, P = 0.7912; I30 vs C30 group, P = 0; I60 vs. C60 group, P = 0). N, represented the result of the samples collected before T. spiralis infection on day 0. Median, dispersion degree, maximum, minimum, outliers and were shown as boxes. *P <0.05, **P <0.01, ***P <0.001. P values are from Wilcox test.
Fig 5
Fig 5. The microbiome composition differences in the infected and uninfected group as well as the log linear discriminant analysis (LDA) effect size quantifies the degree to which each lineage contributes to the uniqueness of two groups.
The data showed the abundance of different bacterial groups in the infection and control groups at each time point. For the quantitative microbiome analyses, LEfSe method was used to identify significant bacterial groups between the infected and uninfected groups, which was performed by LEfSe software with a default LDA Score threshold of 4. (A) Community bar plot analysis was shown at the phylum level. N, represented the result of the samples collected before T. spiralis infection on day 0. (B) C6 group. (C) I60 group. (D) I15 vs. C15 group. (E) I30 vs. C30 group.
Fig 6
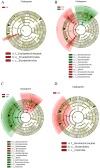
Fig 6. Bacterial Lineage Cladograms with Significantly Different Representation in Infected and Uninfected Groups.
The lineages of bacteria on the trees were color-coded to indicate whether the taxon significantly differed between two groups at the genus level (red or green) or does not (yellow). (A) I6 vs. C6 group, (B) I15 vs. C15 group, (C) I30 vs. C30 group, (D) I60 vs. C60 group.
Fig 7
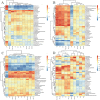
Fig 7. Microbial Structure is associated with Immune Characteristics.
A heat map of the Spearman correlation coefficient score and statistical significance was calculated by Package Vegan from the R program. It showed the associations between variations in the gut microbiota and host immune characteristics during T. spiralis infection. (A) The associations were analyzed on day 6 after infection with T. spiralis. (B) The associations were analyzed on day 15 after infection with T. spiralis. (C) The associations were analyzed on day 30 after infection with T. spiralis. (D) The associations were analyzed on day 60 after infection with T. spiralis. V.C represented villus height/crypt depth, num. GC represented the number of goblet cells per villus, GC. size represented the size of goblet cells, inf. Score represented the inflammatory score. Each cell’s color represents the slope’s direction (red is positive, blue is negative). *P <0.05, **P <0.01.
Fig 8
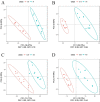
Fig 8. Partial Least Squares Discrimination Analysis (PLS-DA) Score Plots under Positive Ionic Mode.
R2Y represented the interpretation rate of the model and Q2Y reflects model prediction. The closer R2Y and Q2 were to 1, the better the model stability and predictability. (A) I6 vs. C6 group. (B) I15 vs. C15 group. (C) I30 vs. C30 group. (D) I60 vs. C60 group.
Fig 9
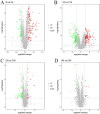
Fig 9. Volcano Plot under Positive Ionic Mode.
Each point represented a metabolite. The horizontal coordinate represented the multiple change of the relative substances in the group (taking the logarithm of base 2). The vertical coordinate represented the P value of T test (taking the logarithm of base 10). The size of the scatter point represented the VIP value of the PLS-DA model. The larger the scatter point, the larger the VIP value. Significantly up-regulated metabolites were shown in red, significantly down-regulated metabolites were shown in blue, and non-significantly differentiated metabolites were shown in gray. (A) I6 vs. C6 group. (B) I15 vs. C15 group. (C) I30 vs. C30 group. (D) I60 vs. C60 group.
Fig 10
Fig 10. Analyses of KEGG Metabolic Pathways in Infected and Control Mice.
DAVID was used to identify the altered metabolic pathways by T. spiralis infection on days 6 (A-B), 15(C-D), 30(E-F), and 60(G-H). A redder circle color indicated more-significant changes in the metabolites in the corresponding pathway, while the size of each circle corresponded to the pathway impact score (larger circles reflected higher centrality of the metabolites involved).
Fig 11
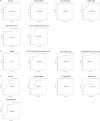
Fig 11. ROC Analyses of Potential Biomarkers for T. spiralis Infection.
The score was higher than the cutoff (0.7). ROC analyses were performed to measure the sensitivities and specificities of these metabolites from corresponding pathways for T. spiralis infection on days 6 (A), 15(B), and 30(C).
Fig 12
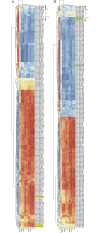
Fig 12. Metabolite Profiles associated with Immune Characteristics.
A heat map of the Spearman correlation coefficient score and statistical significance were calculated by Package Vegan from the R program. It showed the associations between serum metabolites and host immune characteristics during T. spiralis infection. (A) The serum metabolites were analyzed in positive ionic mode. (B) The serum metabolites were analyzed in negative ionic mode. V.C represented villus height/crypt depth, num. GC represented the number of goblet cells per villus, GC. size represented the size of goblet cells, inf. Score represented the inflammatory score. The color of each cell represented the direction of the slope (red was positive, blue was negative). *P <0.05, **P <0.01, ***P <0.001.

Similar articles

Cited by

References

    1. Ashour DS. Trichinella spiralis immunomodulation: an interactive multifactorial process. Expert Rev Clin Immunol. 2013;9(7):669–75. doi: 10.1586/1744666X.2013.811187 . - DOI - PubMed
    1. Maizels RM, McSorley HJ. Regulation of the host immune system by helminth parasites. J Allergy Clin Immunol. 2016;138(3):666–75. Epub 20160729. doi: 10.1016/j.jaci.2016.07.007 ; PubMed Central PMCID: PMC5010150. - DOI - PMC - PubMed
    1. Finlay CM, Walsh KP, Mills KH. Induction of regulatory cells by helminth parasites: exploitation for the treatment of inflammatory diseases. Immunol Rev. 2014;259(1):206–30. doi: 10.1111/imr.12164 . - DOI - PubMed
    1. Jenkins SJ, Perona-Wright G, Worsley AG, Ishii N, MacDonald AS. Dendritic cell expression of OX40 ligand acts as a costimulatory, not polarizing, signal for optimal Th2 priming and memory induction in vivo. J Immunol. 2007;179(6):3515–23. Epub 2007/09/06. doi: 10.4049/jimmunol.179.6.3515 . - DOI - PubMed
    1. Ekkens MJ, Liu Z, Liu Q, Whitmire J, Xiao S, Foster A, et al.. The role of OX40 ligand interactions in the development of the Th2 response to the gastrointestinal nematode parasite Heligmosomoides polygyrus. J Immunol. 2003;170(1):384–93. Epub 2002/12/24. doi: 10.4049/jimmunol.170.1.384 . - DOI - PubMed

Substances

Grants and funding

This work was supported by the National Natural Science Foundation of China (81772213 to X.M.S.), the Natural Science Foundation of Beijing (7222007 to X.M.S.), and the scientific Research Cooperation Fund from Beijing University of Technology (to X.P.Z.). The funders had no role in study design, data collection and analysis, decision to publish, or preparation of the manuscript.