. 2024 Mar;33(3):e4889.
doi: 10.1002/pro.4889.

Structural characterization of the Sel1-like repeat protein LceB from Legionella pneumophila

Affiliations

Structural characterization of the Sel1-like repeat protein LceB from Legionella pneumophila

Tiffany V Penner et al. Protein Sci. 2024 Mar.

Abstract

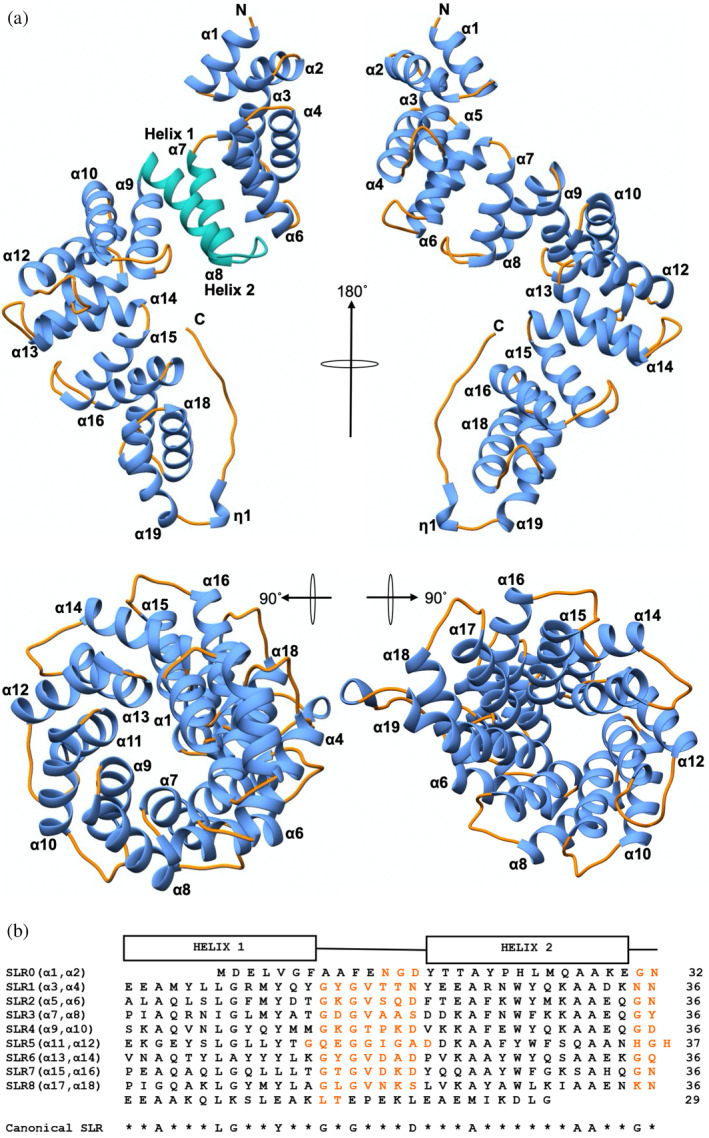
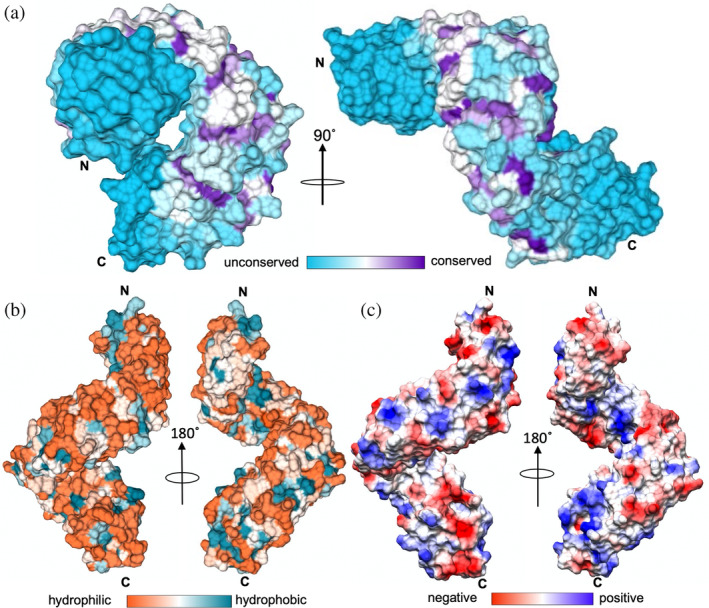
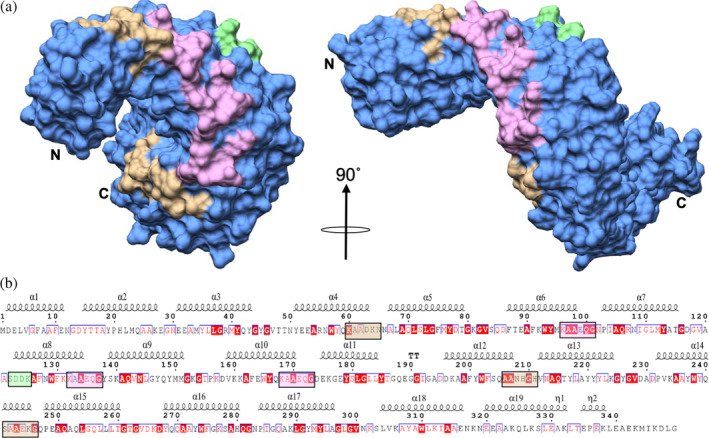
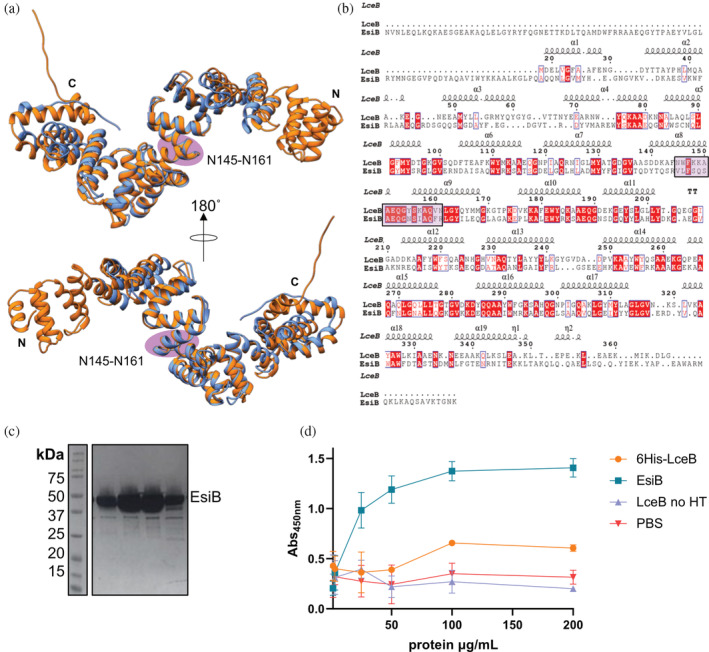
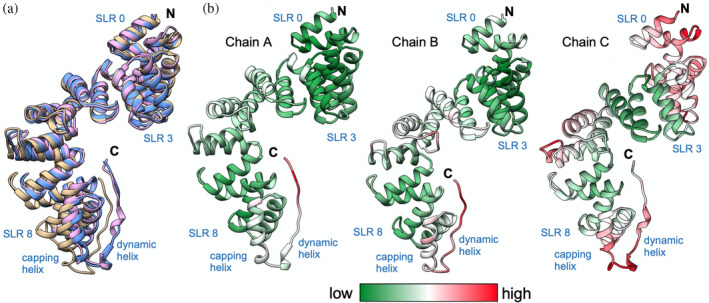
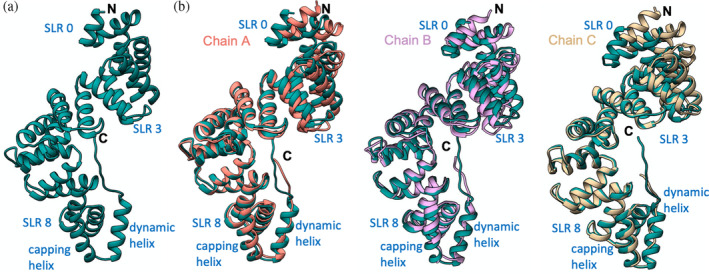
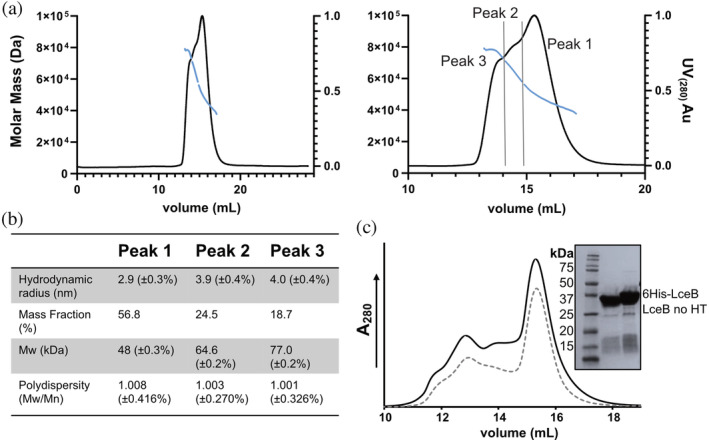
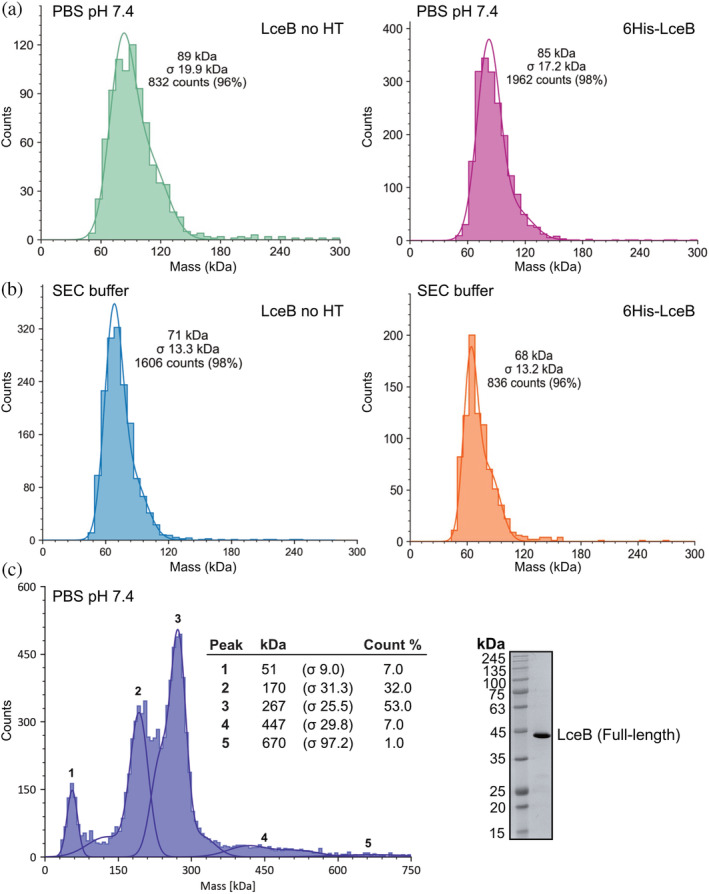
Legionella are freshwater Gram-negative bacteria that in their normal environment infect protozoa. However, this adaptation also allows Legionella to infect human alveolar macrophages and cause pneumonia. Central to Legionella pathogenesis are more than 330 secreted effectors, of which there are nine core effectors that are conserved in all pathogenic species. Despite their importance, the biochemical function of several core effectors remains unclear. To address this, we have taken a structural approach to characterize the core effector of unknown function LceB, or Lpg1356, from Legionella pneumophila. Here, we solve an X-ray crystal structure of LceB using an AlphaFold model for molecular replacement. The experimental structure shows that LceB adopts a Sel1-like repeat (SLR) fold as predicted. However, the crystal structure captured multiple conformations of LceB, all of which differed from the AlphaFold model. A comparison of the predicted model and the experimental models suggests that LceB is highly flexible in solution. Additionally, the molecular analysis of LceB using its close structural homologs reveals sequence and structural motifs of known biochemical function. Specifically, LceB harbors a repeated KAAEQG motif that both stabilizes the SLR fold and is known to participate in protein-protein interactions with eukaryotic host proteins. We also observe that LceB forms several higher-order oligomers in solution. Overall, our results have revealed that LceB has conformational flexibility, self-associates, and contains a molecular surface for binding a target host-cell protein. Additionally, our data provides structural insights into the SLR family of proteins that remain poorly studied.

Keywords: LceB; Legionella pneumophila; Lpg1356; Sel1-like repeat protein; Type IV secretion system; X-ray crystallography; effector.


Conflict of interest statement

The authors declare that they have no conflicts of interest with the contents of this article.

Figures

FIGURE 1
FIGURE 1
X‐ray crystal structure of LceB. (a) Four views of Legionella pneumophila LceB are shown as a ribbon diagram. The N and C terminus are labeled with a secondary structure indicated as alpha‐helices (α) and 310 helices as (η). Helices are colored in blue or green and loop regions in orange. A single SLR made up of Helix 1 (α7) and Helix 2 (α8) is depicted in sea green. (b) Alignment of LceB SLR's. Secondary structure elements can be observed above the SLR sequences (Helix 1 and 2). The canonical SLR is located below the sequences with loop regions colored orange.
FIGURE 2
FIGURE 2
Molecular surface properties of LceB. (a) Residue surface conservation of LceB generated by Consurf (https://consurf.tau.ac.il/). Unconserved surfaces are colored in turquoise and conserved surfaces in deep purple. Areas of white or light shades indicate partial conservation or homologous residue regions. (b) Hydrophobic surface representation of LceB. A gradient of hydrophilic surfaces (orange) to hydrophobic patches (blue‐green) is drawn. (c) LceB colored by the Coulombic surface or electrostatic potential ranging from negative surface (red) to a positive surface (blue) as calculated by UCSF Chimera. In each panel, the N‐ and C‐termini of LceB are indicated.
FIGURE 3
FIGURE 3
Conserved surface residue motifs of LceB. (a) Molecular surface representation of LceB showing predicted functional regions of LceB. The repeated KAAEQG sequence motif is highlighted in pink and is bounded by two closely related motifs in brown. A catalytic serine motif (SXXK) observed in known SLR β‐lactamases is colored green. (b) LceB amino acid sequence plotted with corresponding secondary structure and residue conservation using Espript (https://espript.ibcp.fr/). Residues highlighted in red indicate strict conservation, homologous residues are colored red, while unconserved residues are colored black.
FIGURE 4
FIGURE 4
Structural alignment of LceB with EsiB from E. coli (a) LceB (cornflower blue) aligned with EsiB (PDB 4BWR) (orange) is shown in two views with a 180° rotation. (b) The sequence alignment based on the structural alignment of LceB and EsiB from the Dali server is shown. The secondary structural elements and residue conservation is plotted by Espript (https://espript.ibcp.fr/). Residues highlighted in red indicate strict conservation, homologous residues are colored red, while unconserved residues are not bolded and colored black. The sequence that EsiB uses to bind SIgA is highlighted with a purple oval on the structures in panel (a) and by a box on the sequence in panel (b). This corresponds to a KAAEQG sequence motif. (c) Coomassie stained SDS‐PAGE gel showing the purity of EsiB after purification by SEC. (d) ELISA of protein binding to SIgA. 6His‐LceB (orange), EsiB (blue), LceB no HT (purple) and PBS (pink). Interaction with SIgA was measured by increasing protein concentrations and blotting with anti‐His conjugated HRP antibody. The HRP enzyme product absorbs at 450 nm after quenching the reaction. The graph was plotted using Graph Pad Prism version 9.4.1.
FIGURE 5
FIGURE 5
Comparison of the three LceB copies in the asymmetric unit. (a) Superimposition of LceB chains. Chain A is in cornflower blue, Chain B is in tan, and Chain C is in plum. All panels have the N and C termini labeled. (b) For each chain the observed B‐factors are colored by gradient from low (green) to high (red). Each chain has the N‐ and C‐terminus indicated with relevant structural features highlighted.
FIGURE 6
FIGURE 6
The crystal structure of LceB varies from the AlphaFold model. (a) LceB structure predicted by AlphaFold and used as a molecular replacement model. (b) The Alphafold model (steel blue) aligned with each chain in the LceB x‐ray crystal structure. Chain A (cornflower blue), chain B (plum), and chain C (tan). Each chain has the N and C terminus indicated with relevant structural features highlighted.
FIGURE 7
FIGURE 7
Solution state analysis of LceB. (a) SEC‐MALS trace of LceB showing calculated molecular mass fit of the peak(s) in blue (left). Zoom‐in of SEC‐MALS trace showing three peaks (right). The boundaries separating the overlapping peaks for MALS fit are shown as gray lines. (b) Table of mass‐calculations from ASTRA analysis software. (c) SEC traces of 6His‐LceB (black line) and LceB no HT without an N‐terminal 6His‐tag (gray dotted line) are shown. Inset is a Coomassie stained SDS‐PAGE gel showing the purity of the LceB SEC samples before loading. Graphs were plotted using GraphPad Prism version 9.4.1.
FIGURE 8
FIGURE 8
LceB forms higher‐order oligomers in solution. Molecular weight histograms obtained from mass photometry measurements of purified LceB. (a) LceB (22–366) without a 6His‐tag (LceB no HT) and with the cloning artifact (6His‐LceB) in PBS pH 7.4. (b) LceB (22–366) without a 6His‐tag (LceB no HT) and with the cloning artifact (6His‐LceB) in SEC buffer (Tris pH 7.5 750 mM NaCl). (c) Molecular weight histogram obtained from mass photometry measurements of purified full‐length LceB in PBS pH 7.4 (left). Approximate oligomeric states are Peak 1 = monomer, Peak 2 = trimer, Peak 3 = pentamer or hexamer, Peak 4 = decamer, and Peak 5 = unknown multimer. Right: Coomassie stained SDS‐PAGE gel of full‐length LceB used in mass‐photometry experiments. The peak and standard deviation (σ) of calculated molecular weights are shown.

Similar articles

References

    1. Adams PD, Afonine PV, Bunkóczi G, Chen VB, Davis IW, Echols N, et al. PHENIX: a comprehensive python‐based system for macromolecular structure solution. Acta Crystallogr D Biol Crystallogr. 2010;66:213–221. - PMC - PubMed
    1. Allison MJ, Dawson KA, Mayberry WR, Foss JG. Oxalobacter formigenes gen. Nov., sp. nov.: oxalate‐degrading anaerobes that inhabit the gastrointestinal tract. Arch Microbiol. 1985;141:1–7. - PubMed
    1. Armenteros JJA, Tsirigos KD, Sønderby CK, Petersen TN, Winther O, Brunak S, et al. SignalP 5.0 improves signal peptide predictions using deep neural networks. Nat Biotechnol. 2019;37:420–423. - PubMed
    1. Ausubel FM, Brent R, Kingston RE, Moore DD, Seidman JG, Smith JA. In: Struhl K, editor. Short protocols in molecular biology: a compendium of methods from current protocols in molecular biology. 5th ed. New York: John Wiley & Sons Inc.; 2002.
    1. Bandyopadhyay P, Sumer EU, Jayakumar D, Liu S, Xiao H, Steinman HM. Implication of proteins containing Tetratricopeptide repeats in conditional virulence phenotypes of Legionella pneumophila . J Bacteriol. 2012;194:3579–3588. - PMC - PubMed

MeSH terms

Substances

LinkOut - more resources