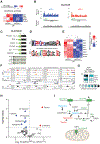
. 2024 Jan 23;43(1):113615.
doi: 10.1016/j.celrep.2023.113615. Epub 2023 Dec 29.

Impact of eIF2α phosphorylation on the translational landscape of mouse embryonic stem cells

Affiliations

Impact of eIF2α phosphorylation on the translational landscape of mouse embryonic stem cells

Mehdi Amiri et al. Cell Rep. .

Abstract

The integrated stress response (ISR) is critical for cell survival under stress. In response to diverse environmental cues, eIF2α becomes phosphorylated, engendering a dramatic change in mRNA translation. The activation of ISR plays a pivotal role in the early embryogenesis, but the eIF2-dependent translational landscape in pluripotent embryonic stem cells (ESCs) is largely unexplored. We employ a multi-omics approach consisting of ribosome profiling, proteomics, and metabolomics in wild-type (eIF2α+/+) and phosphorylation-deficient mutant eIF2α (eIF2αA/A) mouse ESCs (mESCs) to investigate phosphorylated (p)-eIF2α-dependent translational control of naive pluripotency. We show a transient increase in p-eIF2α in the naive epiblast layer of E4.5 embryos. Absence of eIF2α phosphorylation engenders an exit from naive pluripotency following 2i (two chemical inhibitors of MEK1/2 and GSK3α/β) withdrawal. p-eIF2α controls translation of mRNAs encoding proteins that govern pluripotency, chromatin organization, and glutathione synthesis. Thus, p-eIF2α acts as a key regulator of the naive pluripotency gene regulatory network.

Keywords: Stem cell research; embryonic stem cells; p-eIF2α; pluripotency; ribosome profiling; translational control.


Conflict of interest statement

Declaration of interests The authors declare no competing interests.

Figures
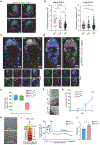
Figure 1.
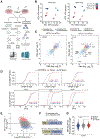
Figure 1.. p-eIF2α transiently marks naive epiblast (EPI) lineages
(A) Immunostaining analysis of an early E4.5 mouse embryo for p-eIF2α and Sox17 (primitive endoderm [PrE] marker). I, II, III, and IV represent serial optical sections of the same image. Scale bars, 20 μm. (B) Quantification of p-eIF2α staining in each blastocyst lineage (EPI, PrE [GATA6 positive] and trophectoderm [TrE]) in early (left) and late (right) pre-implanting mouse embryos (E4.5). Each dot represents one cell from embryos (n = 5–6), **p< 0.01, ****p < 0.0001, ns, not significant, one-way ANOVA test with correction for multiple comparisons using Dunnett T3. (C and D) Immunostaining of three early E4.5 and three late E4.5 embryos as described in (B), one embryo from each time point is magnified to show p-eIF2α staining of EPI in early E4.5, but not in late E4.5. Scale bars, 20 μm. (E) Quantification of the ICM outgrowth diameters derived from culturing eIF2α+/+, eIF2α+/A, and eIF2αA/A blastocysts for 9 days (n = 4–5), *p < 0.05, one-way ANOVA test with correction for multiple comparisons using Dunnett’s T3 test. (F) Representative image of ICM outgrowths described in (E). Scale bars, 200 μm. (G) Cell proliferation assay for early passage (<6) eIF2α+/+, eIF2α+/A, and eIF2αA/A mESCs. **p < 0.01, ****p < 0.0001 (n = 5–6), two-way ANOVA test with correction for multiple comparisons using Tukey. Data presented as mean ± standard deviation (SD). (H) Representative images of eIF2α+/+ and eIF2αA/A mESCs cultured in serum-free, feeder-free LIF/2i. Scale bars, 400 μm. (I) Schematic representation of the fractionation of ribosomes using sucrose gradient. Cytoplasmic lysates of eIF2α+/+ and eIF2αA/A mESCs were loaded on a 10%–50% sucrose gradient, centrifuged (35,000 rpm for 2 h, 4°C), and UV absorbance at 260 nm was monitored continuously to detect 40S, 60S, 80S (monosomes [M]) and polysome fractions (P). Representative polysome profiles of eIF2α+/+ and eIF2αA/A mESCs cultured in serum-free, feeder-free LIF/2i are shown on the right. (J) Quantification of P/M ratio of polysome profiles obtained from eIF2α+/+ and eIF2αA/A mESCs, *p < 0.05 (n = 3), t test with Welch correction. Data presented as mean ± standard error of mean (SEM).
Figure 2.
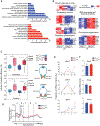
Figure 2.. Translatome analysis of eIF2α+/+ and eIF2αA/A mESCs
(A) Experimental design for preparation and sequencing of RNA-seq and Ribo-seq libraries, and phospho(proteomics) analysis of mESCs. This analysis was performed on biological replicates of eIF2α+/+ and eIF2αA/A mESCs cultured for 6 days in the serum-free medium containing LIF (1,000 U/mL) in the presence or absence of 2i. Image was created with https://biorender.com/. (B) Principal-component analysis (PCA) plots of Ribo-seq (left) and RNA-seq (right) datasets separating each treatment and genotype. Each circle shows a biological replicate; different conditions and mESC genotypes are color coded. (C) Scatterplot showing the association between RNA-seq and Ribo-seq fold change (FC) between eIF2αA/A and eIF2α+/+ mESCs under LIF/2i (left) or LIF (right) conditions. mRNAs with statistically significant changes (p-adj < 0.05 and log2 FC > 0.2 or log2 FC < −0.2) are highlighted with different colors according to the following categories: intensified up, increase in transcription, increase in translation efficiency (TE). Intensified down: decrease in transcription, decrease in TE. Forwarded up: increase in mRNA and RPF at the same rate, no change in TE. Forwarded down: decrease in mRNAand RPF at the same rate, no change inTE. Exclusive up: increase in RPF and TE, no change in mRNA. Exclusive down: decrease in RPF and TE, no change in mRNA. Buffered up: decrease in transcription/increase in TE. Buffered down: increase in transcription/decrease in TE. (D) Cumulative frequency curves of length and GC% of different mRNA regions between translationally upregulated (TE up) and translationally downregulated (TE down) mRNAs in eIF2αA/Avs. eIF2α+/+ mESCs cultured in LIF medium. Adjusted p values are shown on each panel, n.s, not significant, one-way ANOVA test with correction for multiple comparisons using Games-Howell test. (E) Correlation between TE of CDS of mRNAs in eIF2α+/+ cells and TE FC of eIF2αA/A vs. eIF2α+/+ cells in LIF medium. (F) The percentage of translated and untranslated (not translated) AUG initiating uORFs in all mRNAs in the dataset and p-eIF2α-resistant (TE down in eIF2αA/A mESCs) mRNAs. (G) Violin plots of minimum free energy (MFE) score normalized to 5′ UTR length for all mRNAs (gray), p-eIF2α-resistant (blue), and p-eIF2α-sensitive (TE up in eIF2αA/A mESCs; red) mRNAs. ns, not significant, *p < 0.05, one-way ANOVA test with correction for multiple comparisons using Dunnett T3.
Figure 3.
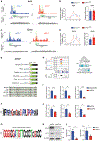
Figure 3.. p-eIF2α controls the translation of mRNAs encoding key cellular processes
(A) Gene ontology (GO) analysis for translationally downregulated (top panel) and upregulated (bottom panel) mRNAs in eIF2αA/A compared with eIF2α+/+ mESCs under LIF conditions. p values were corrected for multiple comparisons using the Benjamini-Hochberg method. mRNAs with p-adj < 0.1 and −0.5 > log2 FC>0.5 are considered for this analysis; up mRNAs, n = 408; down mRNAs, n = 259. (B) Heatmaps highlight translationally upregulated and downregulated genes (eIF2αA/A compared with eIF2α+/+ mESCs under LIF conditions) that define representative functional categories. Values show log2 transformed z-scored TE. (C) Average TE of components of condensin and cohesin complexes. The complete list of components and the corresponding TE are provided in Table S6. *p < 0.05, **p < 0.01, ***p < 0.001, ns, not significant. One-way ANOVA test with correction for multiple comparisons using Tukey. (D) eIF2α+/+ and eIF2αA/A mESCs were cultured under LIF conditions. Sub-polysome (A and B) and polysome (C, D, and E) fractions were obtained by ultra-centrifugation through 10%–50% sucrose gradients. (E) The percentage of mRNAs in each fraction was quantified by RT-qPCR. *p < 0.05, **p < 0.01, ***p < 0.001. (n = 3), two-way ANOVA test with correction for multiple comparisons using the Benjamini-Hochberg method. Data presented as mean ± SEM. (F) The total mRNA levels of the genes assessed in (E) were quantified using RT-qPCR of the input. (n = 3), t test with Welch correction. Data presented as mean ± SEM.
Figure 4.
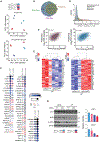
Figure 4.. Identification of p-eIF2α-dependent regulatory uORFs
(A) Ribosome (Ribo-seq) and RNA (RNA-seq) coverage plots for Atf4 mRNA in eIF2α+/+ and eIF2αA/A mESCs under LIF conditions. (B) The percentage of Atf4 mRNAs in each fraction of polysome profiles (left) and total input mRNA level (right) of eIF2α+/+ and eIF2αA/A mESCs cultured in LIF medium were quantified by RT-qPCR. *p < 0.05, (n = 3), two-way ANOVA test with correction for multiple comparisons using the Benjamini-Hochberg method. Data presented as mean ± SEM. (C) Ribo-seq and RNA-seq coverage plot of Epop in eIF2α+/+ and eIF2αA/A mESCs under LIF conditions. (D) The percentage of Epop mRNAs in each fraction of polysome profiles (left) and total input mRNA level (right) of eIF2α+/+ and eIF2αA/A mESCs cultured in LIF medium were quantified by RT-qPCR. *p < 0.05, **p < 0.01, (n = 3), two-way ANOVA test with correction for multiple comparisons using the Benjamini-Hochberg method. Data presented as mean ± SEM. (E) Position and amino acid conservation of Epop uORF-encoded protein in several mammals. The number of nucleotides (nt) between the cap and the start of uORF is indicated in blue for each species. The distance of the uORF start site to the CDS start site, and the length of the uORF-encoded protein are indicated in red and green, respectively, for each species. (F) Amino acid conservation of N-terminal region of EPOP uORF-encoded peptide in mammalian species. (G) Conservation of nucleotides flanking the start site of Epop uORF in mammalian species. (H) Left: UCSC Genome browser views for ATF4 binding events in GCN2+/+ wild-type (WT) and GCN2−/− knockout (KO) cells that were exposed to control (+Leu) or leucine-deficient (−Leu) medium. ATF4 binding profiles in ATF4+/+ (WT) and ATF4−/− (KO) cells treated with tunicamycin (Tm) (GSE35681) are shown below the panel. Right: the heatmap shows fold enrichment for ATF4 ChIP-seq target eIF1. (I and J) RT-qPCR analysis of N2A cells transduced with the indicated siRNA or shRNAs. Values were normalized to β-actin level. *p < 0.05, **p < 0.01. Data are presented as mean ± SEM (n = 3) t test. (K and L) Western blot analysis and quantification of ATF4 and eIF1 in N2A cells transduced with shCtrl or shRNA against ATF4. Values were normalized to β-actin level. Results are presented as mean ± SEM (n = 3). *p < 0.05, t test.
Figure 5.
Figure 5.. Proteomics complements ribosome profiling-based quantification of protein synthesis
(A) Principal-component analysis (PCA) plots of the proteome (top) and phosphoproteome (bottom) datasets, separating each treatment and genotype. Each circle shows a biological replicate, and different conditions and mESC genotypes are color coded. (B) Venn diagram illustrating the mRNAs identified by Ribo-seq, RNA-seq, and proteomics. The mRNAs in Ribo-seq (reads per kilobase per million mapped reads [RPKM] >1), RNA-seq (RPKM >1), and proteomics (S/N ratio >250) yielding 5,731 common gene products. (C) Scatterplots showing the correlation between proteomics with RNA-seq (left) and Ribo-seq (right). R values are Pearson correlation coefficient. (D) The distribution of the magnitude of changes in RNA-seq, Ribo-seq, proteomics, and phosphoproteomics datasets. (E) Heatmap displaying a subset of translationally upregulated and downregulated genes (eIF2αA/A compared with eIF2α+/+ mESCs under LIF conditions) with similar changes in proteomics analysis. Values show log transformed z-scored TE. (F) Dot plot showing the proteins with similar changes in protein level as in TE. Protein abundance is the average S/N ratio of TMT intensity of indicated proteins from two replicates. Color-coded border lines indicate p values. (G) Western blot analysis and quantification of indicated proteins in two independent clones of eIF2α+/+ and eIF2αA/A mESCs cultured under the serum-free LIF/2i and LIF conditions for 6 days. Values were normalized to β-actin level. Data are presented as mean ± SD (n = 2). t test with Welch’s correction.
Figure 6.
Figure 6.. p-eIF2α regulates the expression of mRNAs encoding proteins involved in glutathione synthesis
(A) Heatmap plot highlighting translationally downregulated mRNA involved in glutathione synthesis (eIF2αA/A compared with eIF2α+/+ mESCs under LIF conditions). Values are log-transformed z-scored TE. (B) Ribo-seq and RNA-seq coverage plot of Slc25a39 in eIF2α+/+ and eIF2αA/A mESCs under LIF conditions. (C) Position and amino acid conservation of Slc25a39 uORF-encoded protein in several mammals. The distance of the uORF stop codon to the CDS start codon (in red) and the length of the uORF-encoded peptide (in green) have been shown for each species. (D) Amino acid conservation of N-terminal region of Slc25a39 uORF-encoded peptides in different mammalian species (top), conservation of nucleotides around the start site of Slc25a39 uORF in different mammalian species (bottom). (E) Heatmap plot highlighting transcriptionally regulated genes involved in glutathione synthesis (eIF2αA/A compared with eIF2α+/+ mESCs in LIF). Values are log-transformed z-scored RNA-seq expression level. (F) UCSC Genome browser views for ATF4 binding events in GCN2+/+ (WT) and GCN2−/− (KO) cells that have been exposed to control (+Leu) or leucine-deficient (−Leu) medium. ATF4 binding profiles in ATF4+/+ (WT) and ATF4−/− (KO) cells treated with tunicamycin (Tm) (GSE35681) are shown below each panel. (G) The heatmap plot shows fold enrichment for selected ATF4 ChIP-Seq target genes associated with glutathione synthesis. (H) Metabolomic analysis of eIF2α+/+ and eIF2αA/A mESCs under LIF conditions. Significantly up- and downregulated metabolites (p < 0.05 and −0.5 > log2 FC > 0.5) are highlighted in red and blue, respectively. (I) Schematic summary of genes that are translationally or transcriptionally regulated by ISR and are involved in glutathione metabolism. CTH, cystathionine gamma-lyase; CHAC1, ChaC glutathione-specific gamma-glutamylcyclotransferase 1; GPX, glutathione peroxidase; GSS, glutathione synthetase; GSSG, glutathione disulfide; GSH, glutathione; Glu, glutamate; Gln, glutamine.
Figure 7.
Figure 7.. Model summarizing the translational regulation of genes involved in key cellular processes by p-eIF2α in pluripotent cells

Similar articles

Cited by

  • Metabolic regulation of the hallmarks of stem cell biology.
    Jackson BT, Finley LWS. Jackson BT, et al. Cell Stem Cell. 2024 Feb 1;31(2):161-180. doi: 10.1016/j.stem.2024.01.003. Cell Stem Cell. 2024. PMID: 38306993 Review.
  • Transfer RNA acetylation regulates in vivo mammalian stress signaling.
    Gamage ST, Khoogar R, Manage SH, Crawford MC, Georgeson J, Polevoda BV, Sanders C, Lee KA, Nance KD, Iyer V, Kustanovich A, Perez M, Thu CT, Nance SR, Amin R, Miller CN, Holewinski RJ, Meyer T, Koparde V, Yang A, Jailwala P, Nguyen JT, Andresson T, Hunter K, Gu S, Mock BA, Edmondson EF, Difilippantonio S, Chari R, Schwartz S, O'Connell MR, Chih-Chien Wu C, Meier JL. Gamage ST, et al. bioRxiv [Preprint]. 2024 Jul 28:2024.07.25.605208. doi: 10.1101/2024.07.25.605208. bioRxiv. 2024. PMID: 39091849 Free PMC article. Preprint.
  • NPC1 is required for postnatal islet β cell differentiation by maintaining mitochondria turnover.
    Liu B, Hua D, Shen L, Li T, Tao Z, Fu C, Tang Z, Yang J, Zhang L, Nie A, Jiang Y, Wang J, Li Y, Gu Y, Ning G. Liu B, et al. Theranostics. 2024 Feb 24;14(5):2058-2074. doi: 10.7150/thno.90946. eCollection 2024. Theranostics. 2024. PMID: 38505613 Free PMC article.

References

    1. Ying QL, Wray J, Nichols J, Batlle-Morera L, Doble B, Woodgett J, Cohen P, and Smith A (2008). The ground state of embryonic stem cell self-renewal. Nature 453, 519–523. - PMC - PubMed
    1. Rossant J. (2008). Stem cells and early lineage development. Cell 132, 527–531. - PubMed
    1. Nichols J, and Smith A (2009). Naive and primed pluripotent states. Cell Stem Cell 4, 487–492. - PubMed
    1. Yamanaka S, Zhang XY, Maeda M, Miura K, Wang S, Farese RV Jr., Iwao H, and Innerarity TL (2000). Essential role of NAT1/p97/DAP5 in embryonic differentiation and the retinoic acid pathway. EMBO J. 19, 5533–5541. - PMC - PubMed
    1. Li D, Yang J, Huang X, Zhou H, and Wang J (2022). eIF4A2 targets developmental potency and histone H3.3 transcripts for translational control of stem cell pluripotency. Sci. Adv 8, eabm0478. - PMC - PubMed

Publication types

MeSH terms

Substances