. 2024 Jan 2;121(1):e2315242121.
doi: 10.1073/pnas.2315242121. Epub 2023 Dec 28.

ALK signaling primes the DNA damage response sensitizing ALK-driven neuroblastoma to therapeutic ATR inhibition

Affiliations

ALK signaling primes the DNA damage response sensitizing ALK-driven neuroblastoma to therapeutic ATR inhibition

Marcus Borenäs et al. Proc Natl Acad Sci U S A. .

Abstract

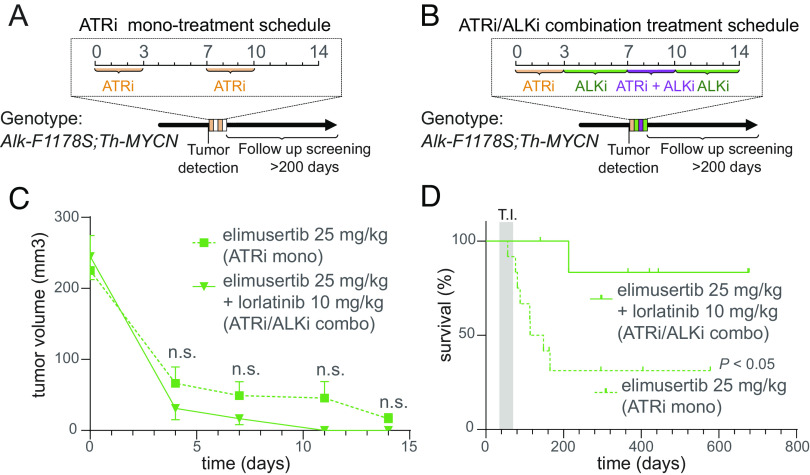
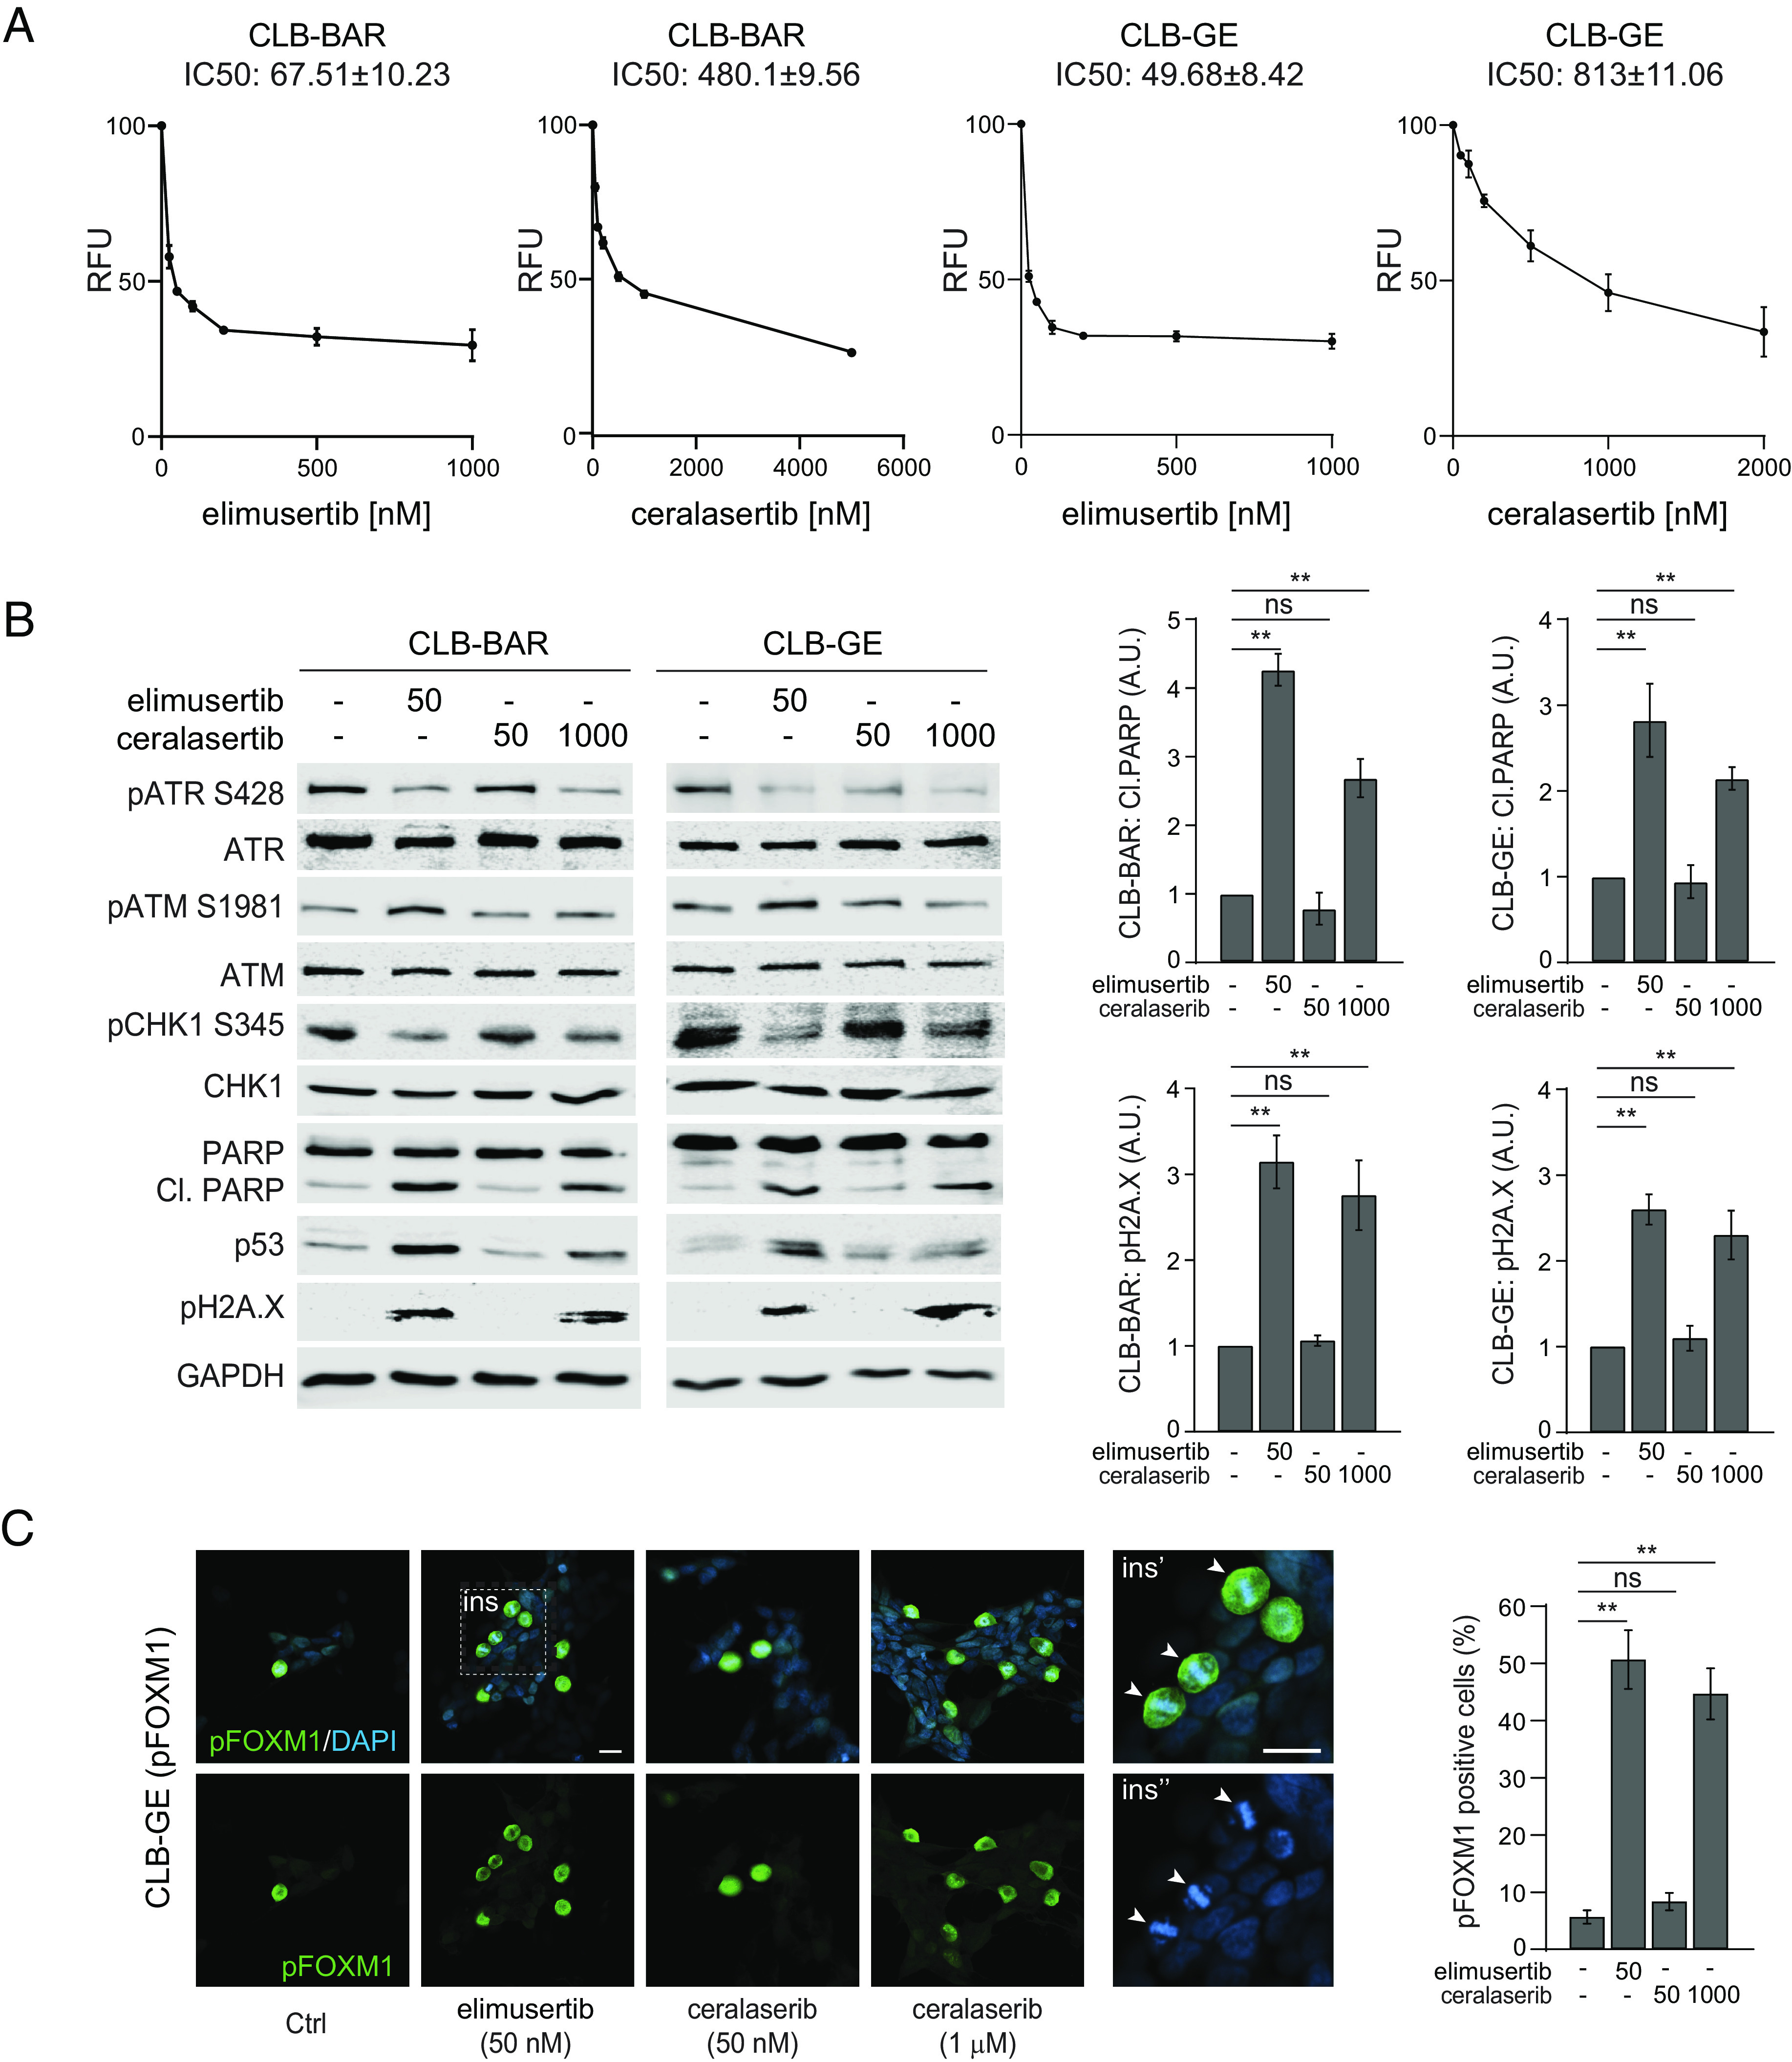
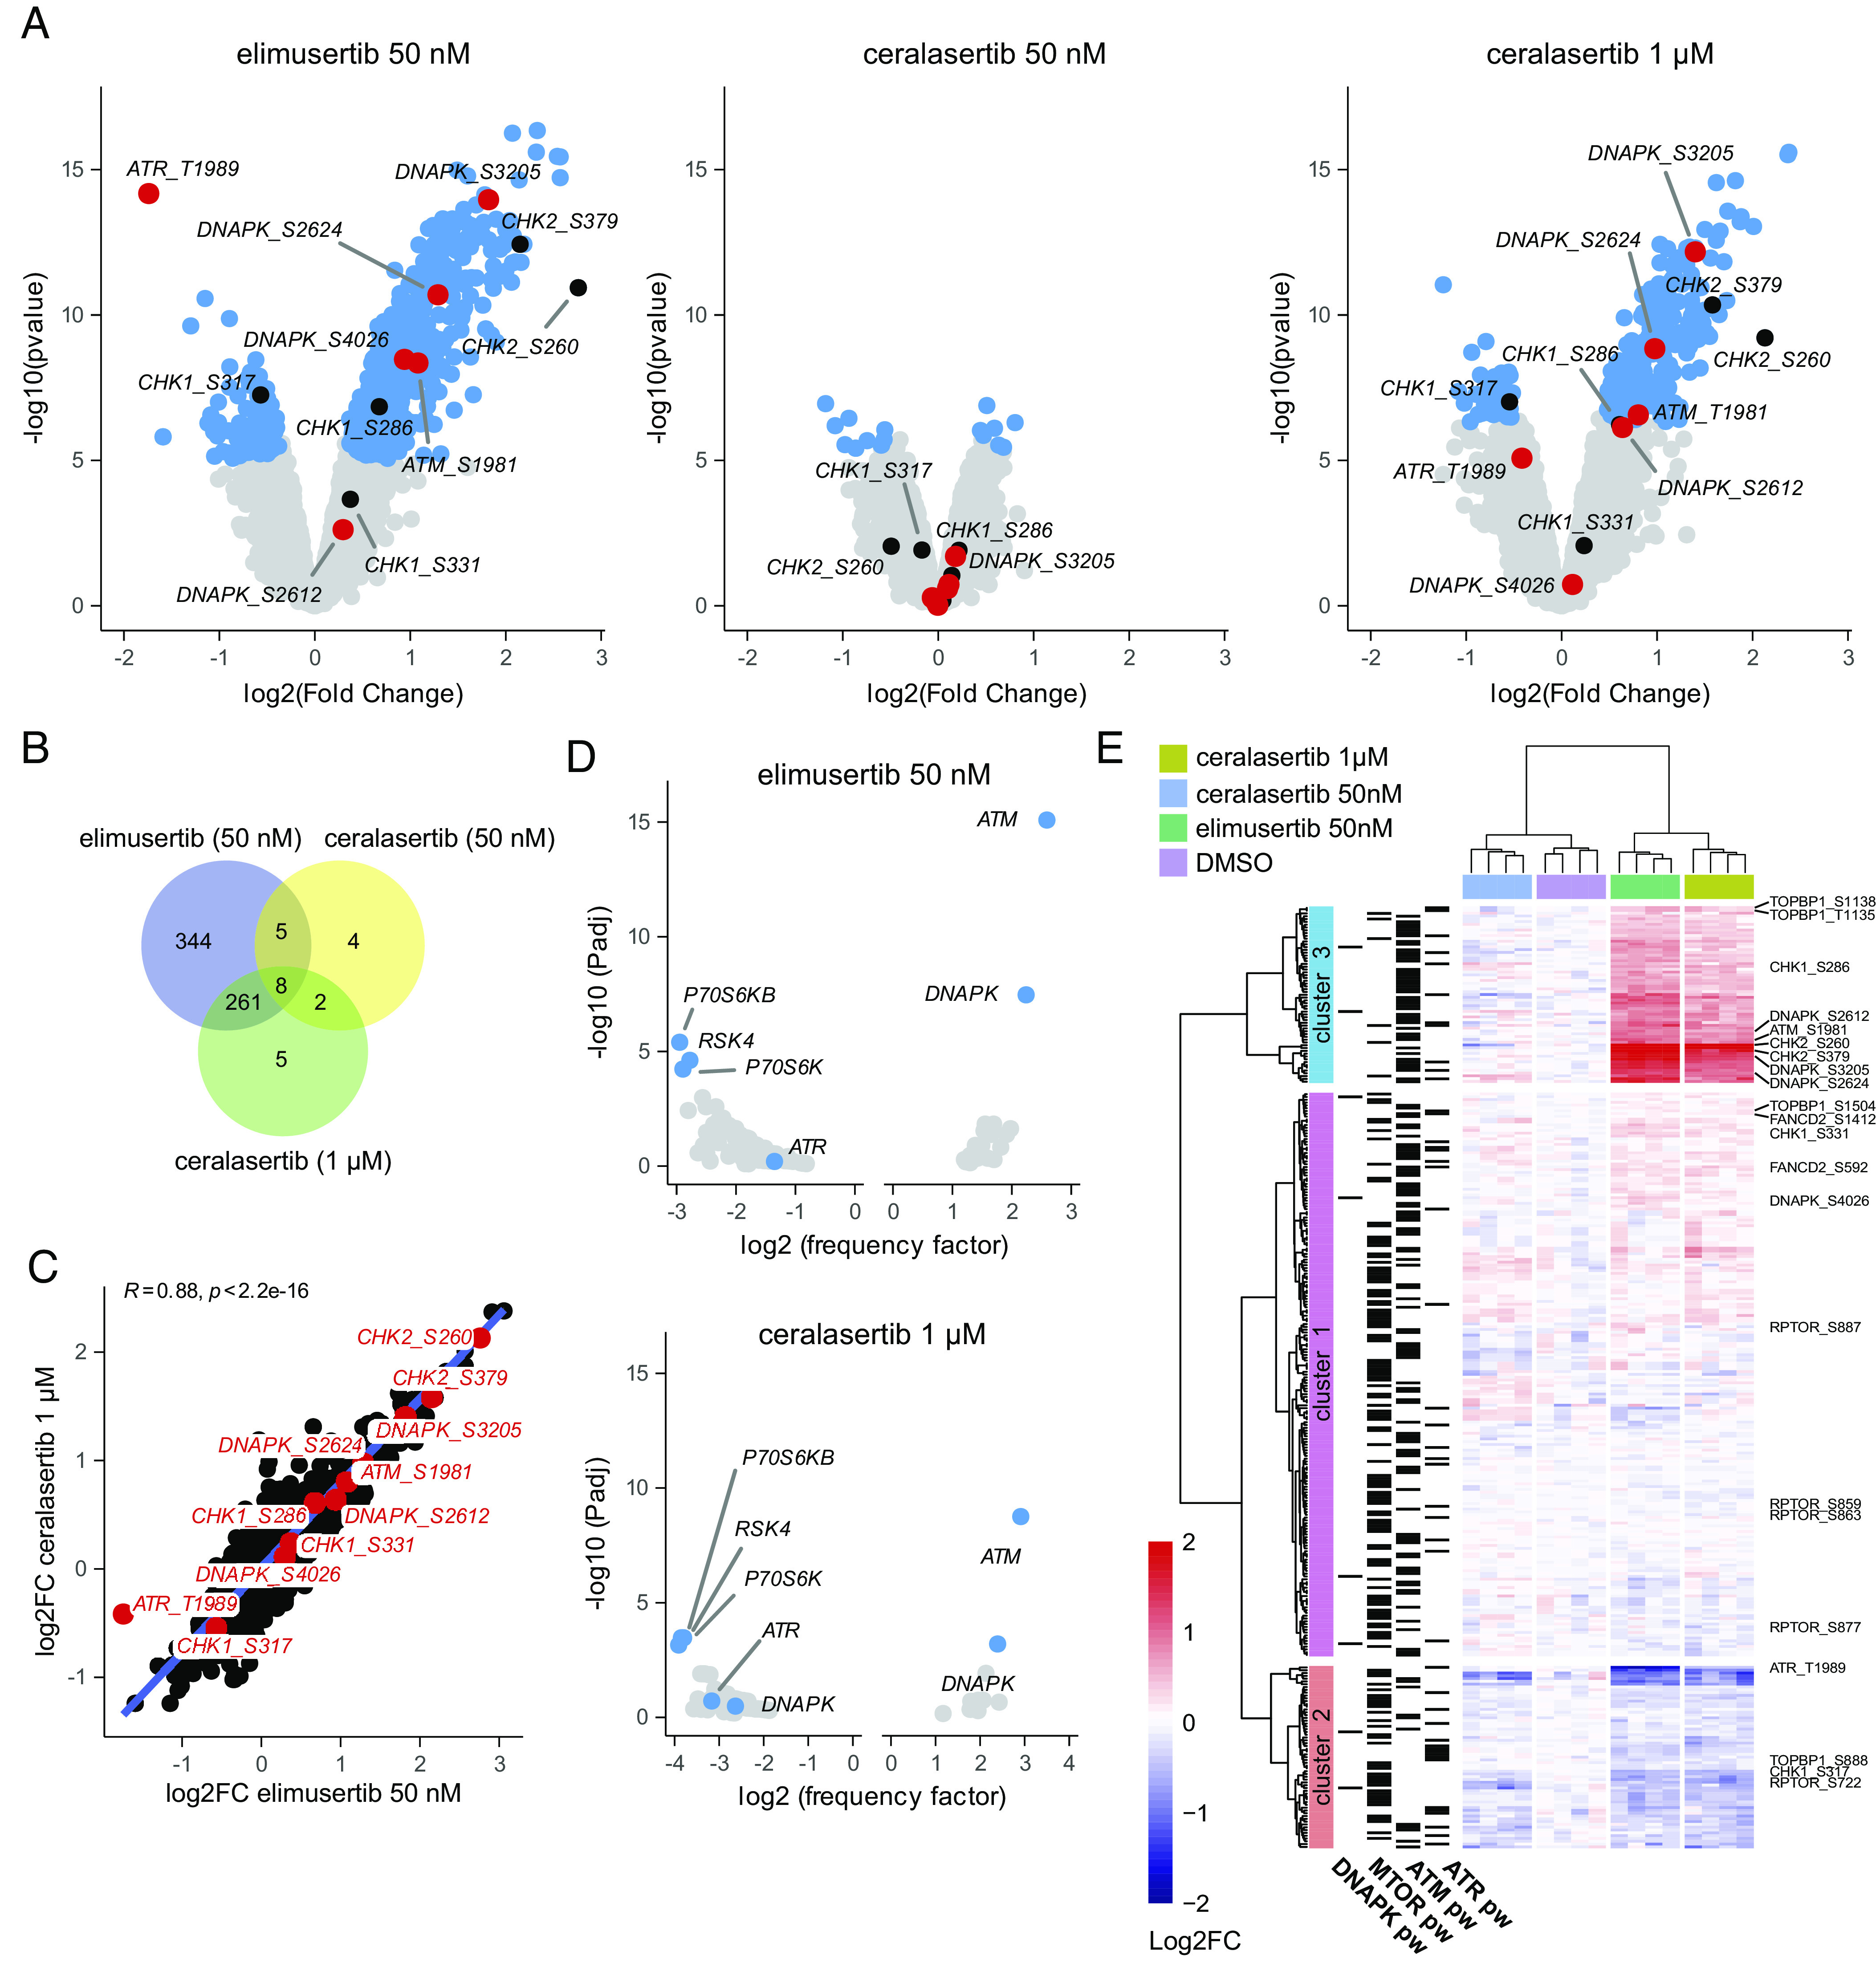
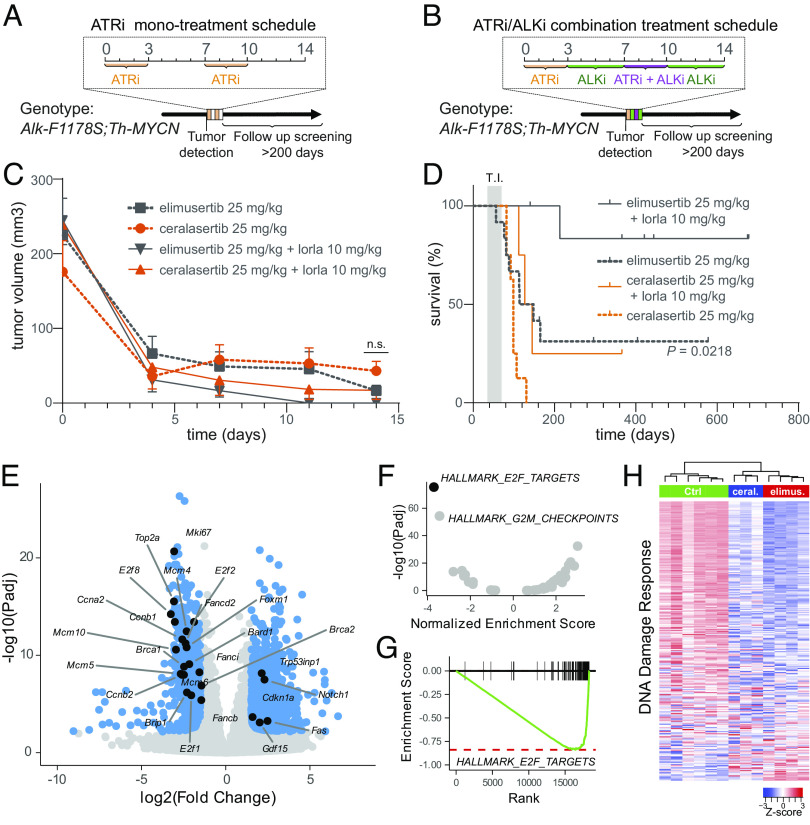
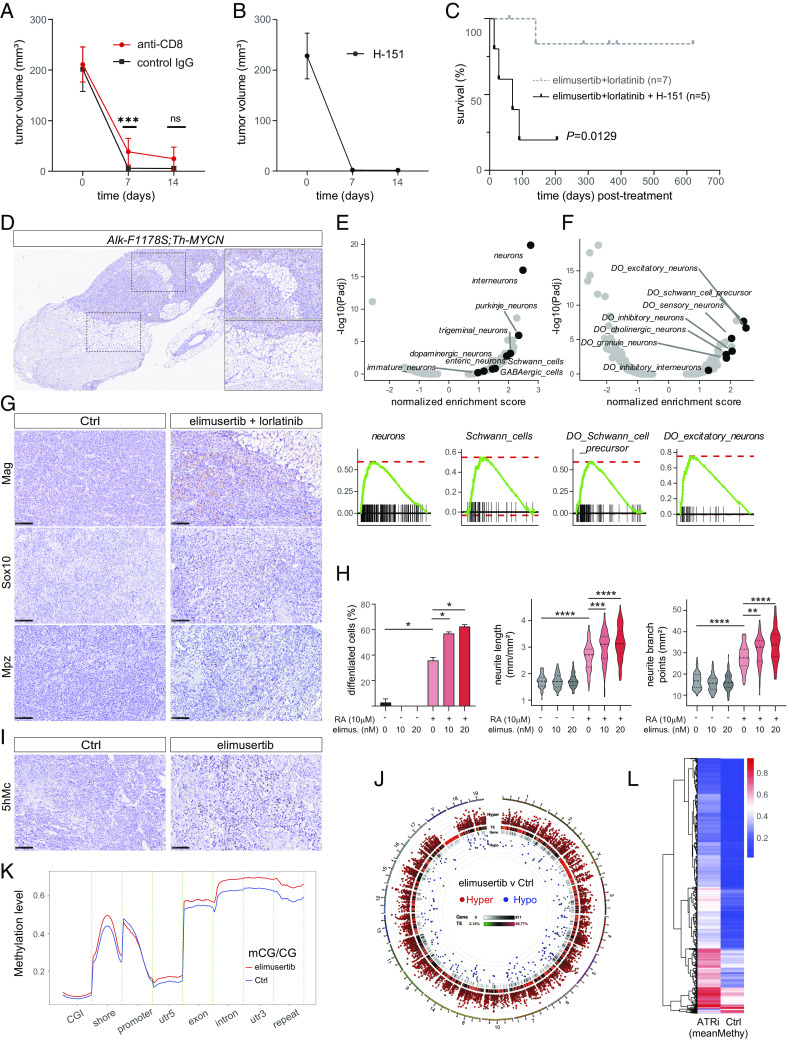
High-risk neuroblastoma (NB) is a significant clinical challenge. MYCN and Anaplastic Lymphoma Kinase (ALK), which are often involved in high-risk NB, lead to increased replication stress in cancer cells, suggesting therapeutic strategies. We previously identified an ATR (ataxia telangiectasia and Rad3-related)/ALK inhibitor (ATRi/ALKi) combination as such a strategy in two independent genetically modified mouse NB models. Here, we identify an underlying molecular mechanism, in which ALK signaling leads to phosphorylation of ATR and CHK1, supporting an effective DNA damage response. The importance of ALK inhibition is supported by mouse data, in which ATRi monotreatment resulted in a robust initial response, but subsequent relapse, in contrast to a 14-d ALKi/ATRi combination treatment that resulted in a robust and sustained response. Finally, we show that the remarkable response to the 14-d combined ATR/ALK inhibition protocol reflects a robust differentiation response, reprogramming tumor cells to a neuronal/Schwann cell lineage identity. Our results identify an ability of ATR inhibition to promote NB differentiation and underscore the importance of further exploring combined ALK/ATR inhibition in NB, particularly in high-risk patient groups with oncogene-induced replication stress.

Keywords: ALK; ATR; elimusertib; lorlatinib; neuroblastoma.


Conflict of interest statement

Competing interests statement:The authors declare no competing interest.

Figures

Fig. 1.
Fig. 1.
ALK inhibition enhances tumor response and progression-free survival in mice treated with ATR inhibitors. (A) Monotreatment regimen for Alk/MYCN-driven GEMM tumors. Tumor-bearing mice were treated with 25 mg/kg ATRi (elimusertib) for 3 d; after this, a 4-d pause from treatment was followed by an additional 3 d of elimusertib. (B) In the combination regimen, the initial monotreatment with ATRi was followed by 10 mg/kg lorlatinib for 11 d, with the addition of ATRi at days 8 to 10. All treatments were given orally twice daily. (C) Tumor volume measured by ultrasound over 14 d. Data are presented as mean ± SEM. n.s. = not significant. (D) Survival (from birth) of Alk-F1178S;Th-MYCN mice treated with elimusertib monotreatment (n = 12) compared with elimusertib/lorlatinib combination treatment (n = 7). P < 0.05; log-rank (Mantel–Cox) test. The shaded area indicates tumor incidence (T.I.) range.
Fig. 2.
Fig. 2.
ALK signaling activity drives phosphorylation of CHK1 on S280. (A) ALK-driven CLB-BAR and NB1 cells were treated with different inhibitors (2 h) or 1 μg/mL ALKAL2 ligand (0.5 h) alone or in combination as indicated. Inhibitors employed were the ALK inhibitor lorlatinib (20 nM), the ATR inhibitor elimusertib (100 nM), and the CHK1 inhibitor LY2603618 (1 μM). Lysates were immunoblotted for pALK (Y1278), ALK, pCHK1 (S280), pCHK1 (S345), pAKT (S473), pERK1/2 (T202/Y204), and Tubulin. Serine sites S280 (downstream of ALK) and S345 (downstream of ATR) are highlighted schematically in CHK1 (Top). CHK1 kinase domain (in red) and regulatory SQ domain (SQ, in green). Arrowheads indicate pCHK1 (S280) and pCHK1 (S345). (B) ALK-positive CLB-BAR, CLB-GE, and CLB-GAR NB cells treated with lorlatinib (30 nM) for 0, 1, and 6 h. Lysates were immunoblotted for pALK (Y1278), ALK, pCHK1 (S280), pCHK1 (S345), CHK1, and Actin. (C) Lysates and cytoplasmic or nuclear extracts of CLB-BAR cells treated with 1 μg/mL ALKAL2 ligand alone or in combination with lorlatinib were immunoblotted for pCHK1 (S280), CHK1, Lamin A (nuclear marker) and β-tubulin (cytoplasmic marker). The arrowhead indicates pCHK1 (S280). Quantification of pCHK1/CHK1 ratios normalized to controls is shown below. (D) ALK-positive CLB-BAR, CLB-GE, and CLB-GAR NB cells were treated with lorlatinib (30 nM) at different time points, as indicated. Lysates were immunoblotted for ALK, pALK (Y1278), and p-H2A.X (S139). GAPDH was employed as loading control. n = 3 biologically independent experiments. Unpaired t test; ***P < 0.001. (E) Bar plot showing RNA-Seq-based log2FC values (mean ± 95% CI) of 276 genes involved in the DDR for different NB cell lines and drug treatments as indicated. Data were derived from five previously published studies (14, 19, 20, 24, 25) with DDR genes as defined by Knijnenburg et al. (23). CLB-BAR, CLB-GE, and NB1 are ALK-dependent lines. IMR32 cells express ALK but are not ALK-dependent for cell growth. SKNAS (NRAS, Q61K) cells lack detectable ALK expression and are ALK-independent (26, 27). (F) ALK-positive CLB-BAR, CLB-GE, and CLB-GAR NB cells were treated with lorlatinib (30 nM) or etoposide (500 nM), either alone or in combination for 24 h. DNA damage was monitored by immunoblotting of p-H2A.X (S139). GAPDH was employed as loading control. n = 3 biologically independent experiments. Unpaired t test; ns, not significant; *P < 0.05; **P < 0.01; ***P < 0.001.
Fig. 3.
Fig. 3.
ALK-positive NB cell lines exhibit differential sensitivity to elimusertib and ceralasertib. (A) CLB-BAR and CLB-GE cell viability in response to elimusertib and ceralasertib. Data shown as mean ± SE of fold relative fluorescence units (RFU) relative to untreated cells from three independent experiments. (B) ALK-positive CLB-BAR and CLB-GE cells treated for 24 h with elimusertib or ceralasertib as indicated (nM). Lysates were immunoblotted for pATR (S428), ATR, pATM (S1981), ATM, pCHK1 (S345), CHK1, PARP/cl.PARP (quantified at Right), p53 and pH2A.X (S139, quantified at Right). GAPDH was employed as loading control. (C) CLB-GE cells were synchronized by thymidine block for 24 h followed by treatment with elimusertib or ceralasertib as indicated. Cells were stained for pFOXM1 (T600) (green, quantified at right) and DAPI (blue). Panels (ins) indicate close up of cells in metaphase (arrowheads) (scale bar, 20 µm.) Bar graphs indicate the percentage of pFOXM1 T600 (green)-positive cells following elimusertib or ceralasertib treatment. n = 3 biologically independent experiments, unpaired t test; ns, not significant; **P < 0.01.
Fig. 4.
Fig. 4.
Comparison of the phosphoproteomic response to elimusertib and ceralasertib treatment of NB cell lines. CLB-BAR cells were synchronized by thymidine block and treated with either DMSO (control), elimusertib (50 nM) and ceralasertib (50 nM or 1 µM) for 6 h. (A) Volcano plots showing DP between different treatments (as indicated) and control. DP sites are indicated in blue. ATR, ATM, and DNAPK sites are indicated and labeled in red. CHK1/2 sites are indicated in black. (B) Venn diagrams indicating the number of DP sites for each condition. (C) Correlation plot between DP log2FC values of different treatments as indicated. Sites in ATR, ATM, DNAPK, and CHK1/2 are indicated and labeled in red. Linear regression line in blue and Pearson correlation coefficient indicated on Top. (D) Volcano plot showing PK predictions for all hypophosphorylated (negative values) and hyperphosphorylated sites (positive values). ATR, ATM, DNAPK, and strongest predicted PKs are labeled and indicated in blue. (E) Heatmap comparing log2FC between different samples as indicated. Hierarchical clustering was performed using the Ward.2 method with dendrograms indicated. Genes active in ATR, ATM, DNAPK, and mTOR pathways (pw) are indicated on the Left. See Dataset S1 for detailed results.
Fig. 5.
Fig. 5.
Elimusertib exhibits a more robust antitumor response in GEMMs compared to ceralasertib. (A) Schematic of the monotreatment regimen for Alk/MYCN-driven GEMM tumors. Mice were treated with 25 mg/kg elimusertib or ceralasertib for 3 d. A subsequent 4-d pause from treatment was followed by an additional 3 d of ATRi. (B) In the combination regimen, initial monotreatment with ATRi was followed by 10 mg/kg lorlatinib for 11 d, supplemented with ATRi at days 8 to 10, orally. All treatments were given twice daily. (C) Tumor volume was measured by ultrasound over 14 d. Data presented as mean ± SEM. (D) Survival (from birth) of Alk-F1178S;Th-MYCN treated with elimusertib monotreatment (gray dashed, n = 12) or ceralasertib (orange dashed, n = 8) (P = 0.0218) compared with elimusertib or ceralasertib and lorlatinib combination treatment (gray and orange solid, respectively, n = 7 and n = 4) (P = 0.025). Data for elimusertib and elimusertib/lorlatinib treatment cohorts are shown for comparison. Gray bar indicates tumor incidence (T.I.) range. Data shown as Kaplan–Meier with log-rank (Mantel–Cox) test. (E) Volcano plot showing RNA-Seq-based differential gene expression (DE) analysis between untreated control Alk-F1178S;Th-MYCN tumors (n = 6) and after 3 d of ceralasertib treatment (n = 3). DE genes are indicated in blue, with genes discussed in the main text indicated in black. (F and G) Hallmark GSEA showing normalized enrichment scores and corresponding FDR values with running score plot (panel G) shown for E2F targets, the most strongly enriched gene set. (H) Heatmap comparing z-score normalized gene expression counts between untreated control, ceralasertib treated, and elimusertib treated Alk-F1178S;Th-MYCN tumors for 273 different DDR genes as indicated. Genes ranked based on DE (most DE on Top). Color key shown at Bottom Right. Columns (tumor samples) are hierarchically clustered as illustrated by the dendrogram shown on the Top.
Fig. 6.
Fig. 6.
Investigation of immune cell dependency, differentiation, and methylation upon ATRi treatment. (A) Tumor volume in Alk-F1178S;Th-MYCN mice harboring tumors treated with combination elimusertib and lorlatinib concurrent with injections of either anti-mouse CD8α [n = 10 (day 0), n = 10 (day 7), and n = 9 (day 14)] or IgG2b isotype control [n = 5 (day 0), n = 5 (day 7), and n = 4 (day 14)]. Tumor volumes of anti-mouse CD8α and IgG2b isotype treated controls at day 7 (P = 0.0007) and day 14 (P = 0.0755) was compared by two-tailed Mann–Whitney test. (B) Alk-F1178S;Th-MYCN mice harboring tumors treated with H-151 (n = 5) in addition to the 14-d combination treatment regime (elimusertib+lorlatinib). Tumor volume data are presented as mean ± SD. (C) Kaplan–Meier survival curve (posttreatment) of Alk-F1178S;Th-MYCN mice harboring tumors treated with H-151 (n = 5) in addition to the 14-d combination treatment regime (elimusertib+lorlatinib). The gray dashed line shows survival curve for elimusertib and lorlatinib alone (Fig. 5D) for comparison. Kaplan–Meier survival curve with log-rank (Mantel–Cox) test, P = 0.0129. (D) Representative elimusertib+lorlatinib treated Alk-F1178S;Th-MYCN tumor, showing distinct histological features within the same tumor; inserts are magnifications of dashed squares. (E and F) Volcano plots showing GSEA results using cell type signature genes from PanglaoDB (E) and MSigDB (F). Enrichment was performed using DGE between NB tumors from Alk-F1178S;Th-MYCN mice in untreated control conditions (n = 6) and after 3 d of elimusertib treatment (n = 3). Neuronal and Schwann cell–related gene sets are indicated. Lower plots show running score plots for the most enriched neuronal and Schwann cell–related gene sets. (G) Sections from control and elimusertib+lorlatinib treated tumors were stained for Mag, Sox10, and Mpz by immunohistochemistry. Treated tumors exhibited Mag- and Mpz-positive regions with enlarged cells resembling neuronal or Schwann cells. Control tumors were negative. Sox10-positive nuclei were present in both control and treated tumors. (H) Bar graphs indicate percentage of differentiated SK-N-BE(2) cells, neurite length (mm/mm2), and neurite branch points (mm2) following RA or/and elimusertib treatment for 24 h. n = 3 biologically independent experiments. Unpaired two-tailed t test (*P < 0.05, **P < 0.01, ***P < 0.001, and ****P < 0.0001). (I) Sections from control and elimusertib treated tumors were stained for 5-hydroxymethylcytosine (5-hmC) by immunohistochemistry. Treated tumors exhibited 5-hmC-positive regions with enlarged cells resembling neuronal or Schwann cells. (J) Circos plot showing hypo- and hypermethylated regions within the mouse genome between vehicle and elimusertib treated Alk-F1178S;Th-MYCN tumors. (K) Diagram showing methylation levels within functional genomic regions. (L) Heatmap of DMR between vehicle and elimusertib treatment. Vehicle treatment n = 3, elimusertib treatment n = 3 in (K and L). DMRs were sorted by areaStat including hypomethylated (areaStat < 0) and hypermethylated (areaStat > 0) DMRs.

Similar articles

Cited by

References

    1. Matthay K. K., et al. , Neuroblastoma. Nat. Rev. Dis. Primers 2, 16078 (2016). - PubMed
    1. Ladenstein R., et al. , Busulfan and melphalan versus carboplatin, etoposide, and melphalan as high-dose chemotherapy for high-risk neuroblastoma (HR-NBL1/SIOPEN): An international, randomised, multi-arm, open-label, phase 3 trial. Lancet Oncol. 18, 500–514 (2017). - PubMed
    1. Amoroso L., et al. , Topotecan-vincristine-doxorubicin in stage 4 high-risk neuroblastoma patients failing to achieve a complete metastatic response to rapid COJEC: A SIOPEN study. Cancer Res. Treat. 50, 148–155 (2018). - PMC - PubMed
    1. De Brouwer S., et al. , Meta-analysis of neuroblastomas reveals a skewed ALK mutation spectrum in tumors with MYCN amplification. Clin. Cancer Res. 16, 4353–4362 (2010). - PubMed
    1. Pugh T. J., et al. , The genetic landscape of high-risk neuroblastoma. Nat. Genet. 45, 279–284 (2013). - PMC - PubMed

Substances