. 2024 Mar 1;45(9):688-703.
doi: 10.1093/eurheartj/ehad842.

Inhibition of a novel Dickkopf-1-LDL receptor-related proteins 5 and 6 axis prevents diabetic cardiomyopathy in mice

Affiliations

Inhibition of a novel Dickkopf-1-LDL receptor-related proteins 5 and 6 axis prevents diabetic cardiomyopathy in mice

En Ma et al. Eur Heart J. .

Abstract

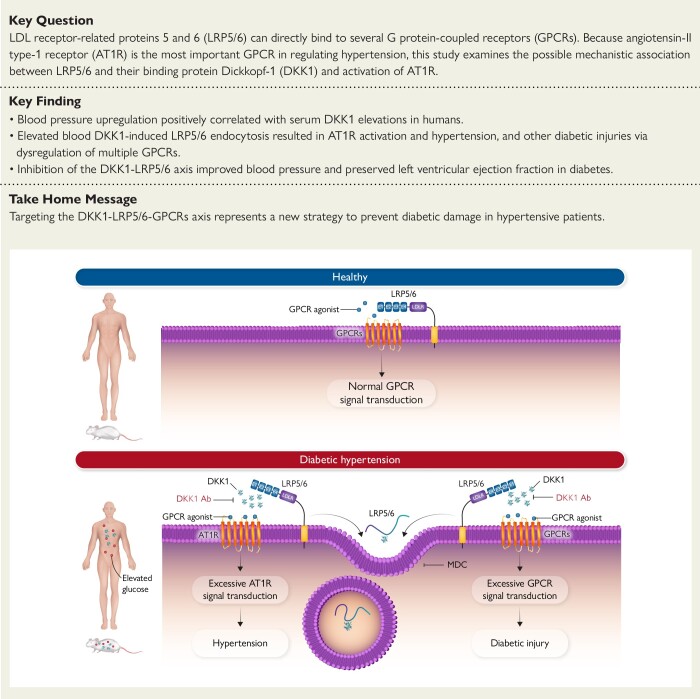
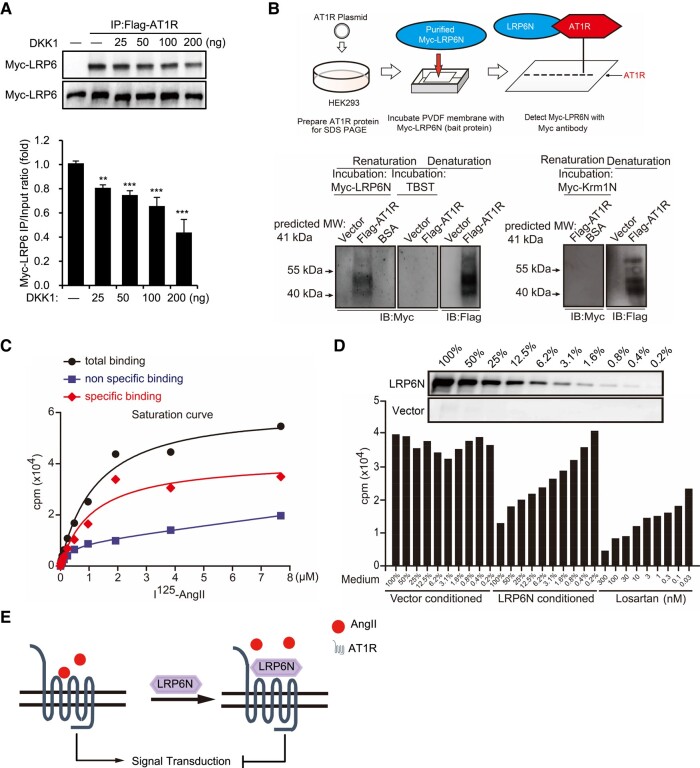
Background and aims: Anti-hypertensive agents are one of the most frequently used drugs worldwide. However, no blood pressure-lowering strategy is superior to placebo with respect to survival in diabetic hypertensive patients. Previous findings show that Wnt co-receptors LDL receptor-related proteins 5 and 6 (LRP5/6) can directly bind to several G protein-coupled receptors (GPCRs). Because angiotensin II type 1 receptor (AT1R) is the most important GPCR in regulating hypertension, this study examines the possible mechanistic association between LRP5/6 and their binding protein Dickkopf-1 (DKK1) and activation of the AT1R and further hypothesizes that the LRP5/6-GPCR interaction may affect hypertension and potentiate cardiac impairment in the setting of diabetes.

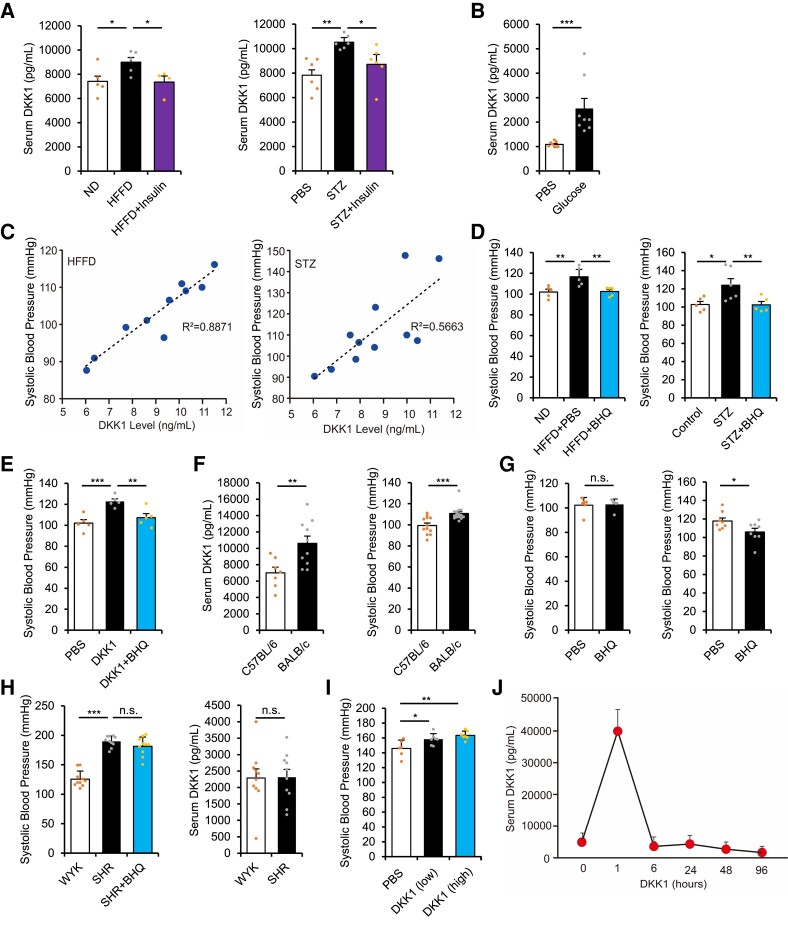
Methods: The roles of serum DKK1 and DKK1-LRP5/6 signalling in diabetic injuries were investigated in human and diabetic mice.

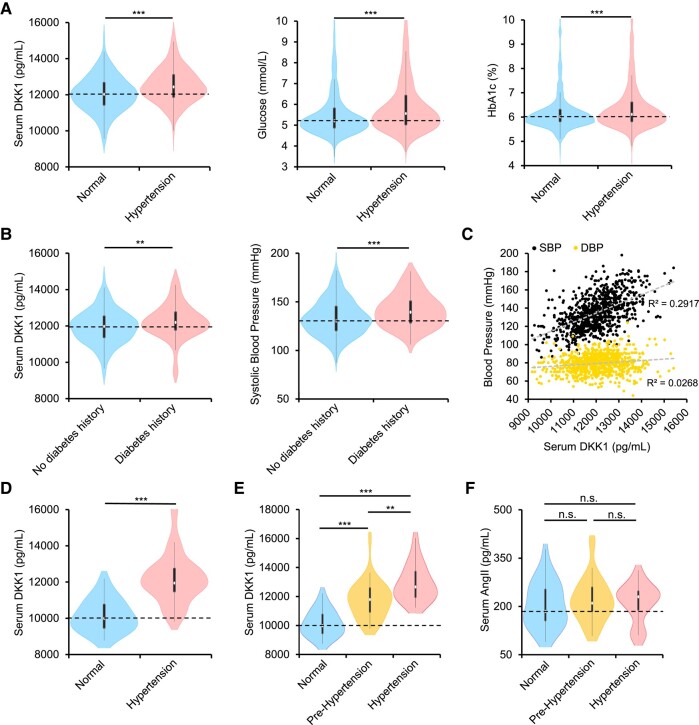
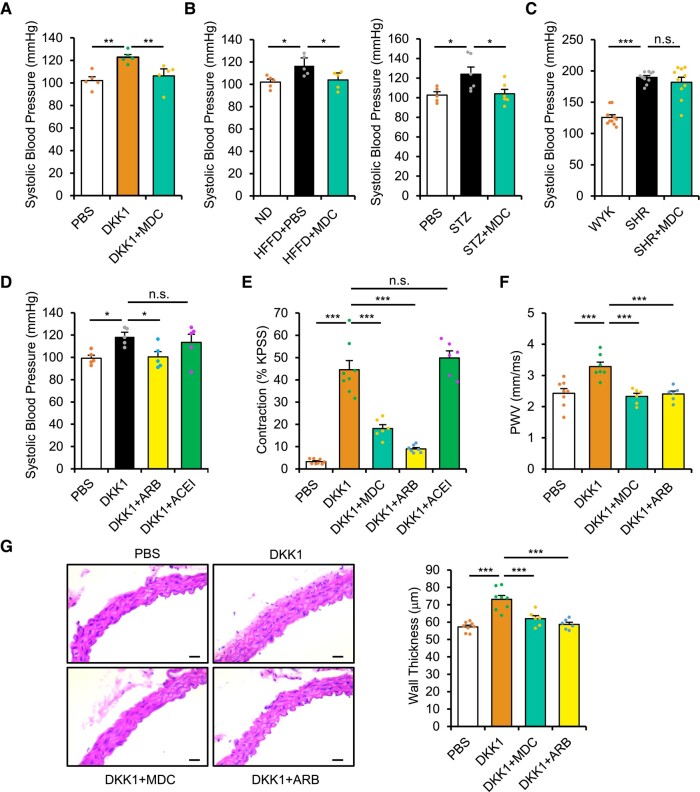
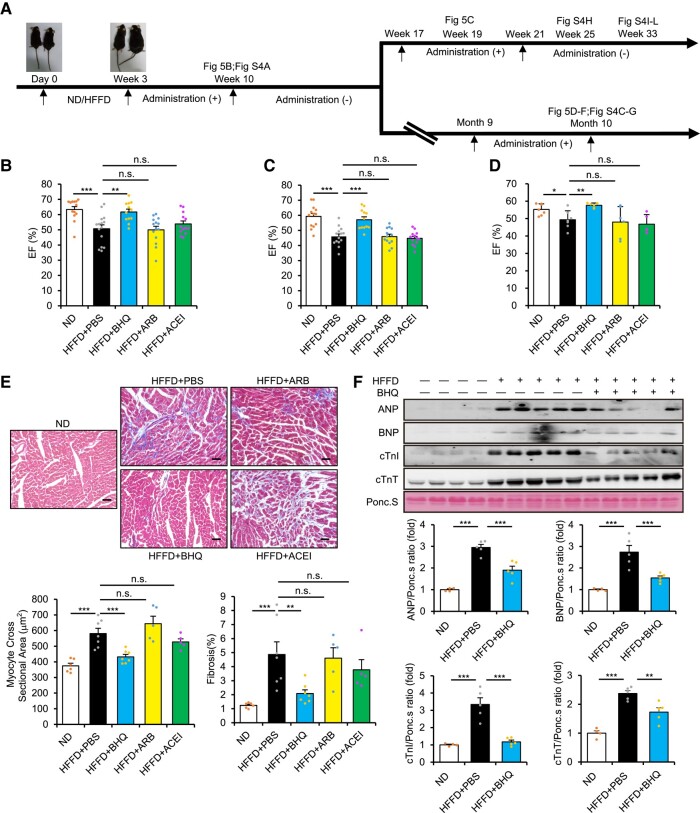
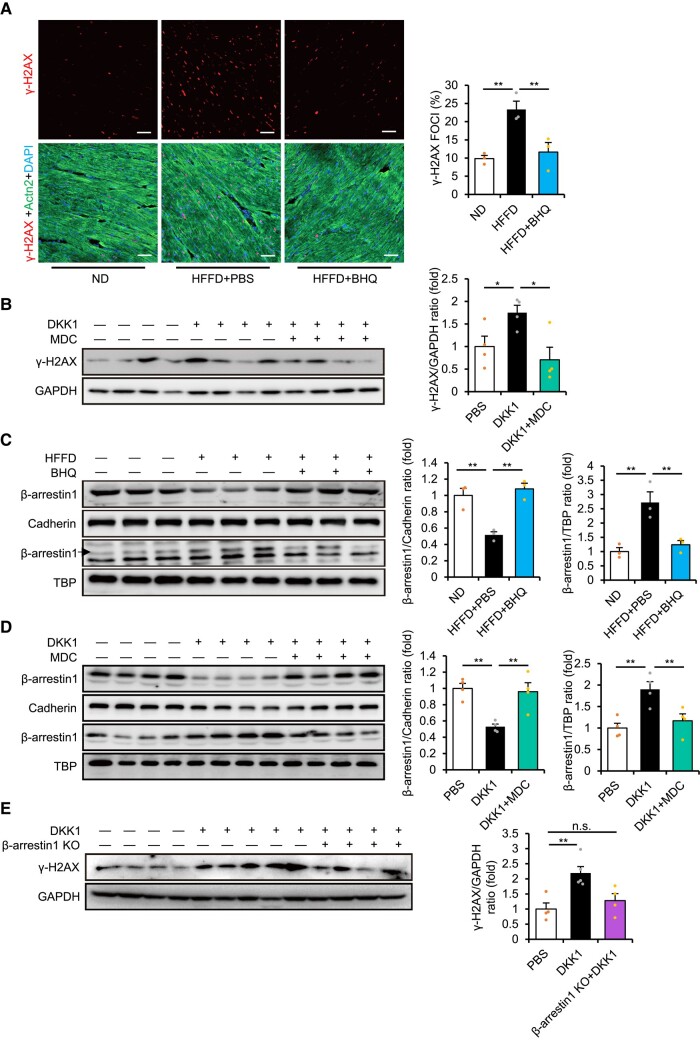
Results: Blood pressure up-regulation positively correlated with serum DKK1 elevations in humans. Notably, LRP5/6 physically and functionally interacted with AT1R. The loss of membrane LRP5/6 caused by injection of a recombinant DKK1 protein or conditional LRP5/6 deletions resulted in AT1R activation and hypertension, as well as β-arrestin1 activation and cardiac impairment, possibly because of multiple GPCR alterations. Importantly, unlike commonly used anti-hypertensive agents, administration of the anti-DKK1 neutralizing antibody effectively prevented diabetic cardiac impairment in mice.

Conclusions: These findings establish a novel DKK1-LRP5/6-GPCR pathway in inducing diabetic injuries and may resolve the long-standing conundrum as to why elevated blood DKK1 has deleterious effects. Thus, monitoring and therapeutic elimination of blood DKK1 may be a promising strategy to attenuate diabetic injuries.

Keywords: AngII/AT1R; DKK1; Diabetes; GPCR; Hypertension; LRP5/6; Metabolic syndrome; β-arrestin1.


Figures

Structured Graphical Abstract
Role of DKK1 inducing the development of hypertension and organ injury in diabetes. Under normal conditions, LRP5/6 bind to and fine-tune GPCRs to maintain normal GPCR signal transduction and organ homeostasis. Under diseased conditions such as type 2 diabetes, elevated circulating DKK1 induces membrane LRP5/6 endocytosis, which leads to deregulations of GPCRs. For example, deregulation of AT1R activation leads to hypertension, while deregulations of other LRP5/6-interacting GPCRs lead to organ injury, and these can be prevented by an anti-DKK1 neutralizing antibody or MDC that prevents DKK1-induced LRP5/6 endocytosis. AT1R, angiotensin II type 1 receptor; DKK1, Dickkopf-1; GPCR, G protein–coupled receptor; LRP5/6, LDL receptor–related proteins 5 and 6; LDLR, LDL receptor; MDC, monodansylcadaverine.
Figure 1
Figure 1
A positive relationship between elevated serum Dickkopf-1 (DKK1) levels and high blood pressure in humans. (A–C) Shanghai cohort. For comparisons of serum DKK1 with blood pressure, multiple regression analysis using least square means was used after adjustment for the following confounders: age, haemoglobin A1c (HbA1c), HDL, LDL, and serum uric acid for the predicted serum DKK1 level from regression model fit. Violin plots (A) showing serum DKK1 levels (left), blood glucose (middle), and HbA1C (right) in elderly participants without hypertensive history (normal, n = 869) vs. hypertensive patients with a history of hypertension (hypertensive, n = 1204). Student’s t-test. ***P < .001. White dot, median; black bars, first and third quartiles; black lines, 1.5× interquartile range. Violin plots (B) showing serum DKK1 levels (left) and systolic blood pressure (SBP) (right) in normal participants without hypertensive or diabetic history or clearly diagnosed hypertension or diabetes (normal, n = 620) vs. participants with diabetes but not taking anti-hyperglycaemic drugs (diabetes, n = 97). Student’s t-test. **P < .01, ***P < .001. Scatter plot (C) showing the moderate positive correlation between increased serum DKK1 with increased SBP but not diastolic blood pressure (DBP) among normal elderly participants without hypertensive history (n = 869). R-squared values for the model were estimated based on the line of best fit using least squares linear regression. (D–F) Fujian cohort. For comparisons of serum DKK1 with blood pressure in Fujian cohort, multiple regression analysis using least square means was used after adjustment for the following confounders: age, blood glucose, HDL, LDL, and triglycerides for the predicted serum DKK1 level from regression model fit. Violin plots (D) showing serum DKK1 levels in younger participants with normal blood pressure (normal, n = 27) vs. those with elevated blood pressure (hypertension, n = 54). Mann–Whitney U-test. ***P < .001. White dot, median; black bars, first and third quartiles; black lines, 1.5× interquartile range. Violin plots (E) showing serum DKK1 levels in younger participants separated according to their blood pressures, ranging from normotensive (DBP < 80 mmHg and SBP < 120 mmHg, n = 27), pre-hypertension (either DBP between 80 and 89 mmHg or SBP 120–139 mmHg, n = 34), or hypertension (either DBP ≥ 90 mmHg or SBP ≥ 140 mmHg, n = 20). Kruskal–Wallis test. **P < .01, ***P < .001. Violin plots (F) showing serum AngII levels in younger participants separated according to their blood pressures, ranging from normotensive (n = 27), pre-hypertension (n = 34), or hypertension (n = 20). Kruskal–Wallis test. n.s., no significance
Figure 2
Figure 2
Dickkopf-1 (DKK1) induces blood pressure up-regulation. (A) Serum DKK1 level (left) at 10 weeks in high-fat/high-fructose diet (HFFD)-fed mice with or without treatment with insulin, compared with those on normal diet. n = 4 or more, *P < .05 vs. HFFD alone. Serum DKK1 level (right) at 6 weeks in streptozocin (STZ)-injected mice with or without treatment with insulin, compared with phosphate buffered saline (PBS)-injected mice. n = 6. One-way ANOVA. Mean ± SEM, **P < .01, *P < .05 vs. STZ alone. (B) Serum DKK1 level in 10-week-old C57BL/6 mice injected with glucose (2 g/kg/h) or PBS for 24 h. n = 8. Mann–Whitney U-test. Mean ± SEM, ***P < .001. (C) Regression analysis of mouse systolic blood pressure vs. serum DKK1 level in diabetic HFFD model, n = 10 (left), and STZ model, n = 11 (right). (D) Systolic blood pressure in HFFD-fed mice with or without treatment with BHQ880 at 10 weeks post-HFFD model (left), n = 5, **P < .01 vs. HFFD alone or in STZ-injected mice at 6 weeks (right), n = 5 or more. One-way ANOVA. Mean ± SEM, *P < .05, **P < .01 vs. STZ alone. (E) Systolic blood pressure following DKK1 injection (1 mg/kg/day) for 4 consecutive days, with or without treatment with BHQ880. n = 5. One-way ANOVA. Mean ± SEM, **P < .01, ***P < .001 vs. DKK1 alone. (F) Serum DKK1 level in 10-week-old C57BL/6 and BALB/c mice (left). n = 7 or more, Student’s t-test. **P < .01. Systolic blood pressure in 10-week-old C57BL/6 and BALB/c mice (right). n = 12 or more. Mann–Whitney U-test. Mean ± SEM, ***P < .001. (G) Systolic blood pressure in 10-week-old C57BL/6 (left) and BALB/c (right) mice with or without treatment with BHQ880 for 2 weeks. n = 6 or more. Student’s t-test. Mean ± SEM, n.s., no significance, *P < .05. (H) Systolic blood pressure (left) and serum DKK1 level (right) in 10-week-old spontaneously hypertensive rats (SHR) injected with PBS or BHQ880, compared with age-matched Wistar Kyoto (WKY) rats. n = 10. One-way ANOVA (left) or Student’s t-test (right). Mean ± SEM, ***P < .001. n.s., no significance. (I) Systolic blood pressure in 6-week-old SHR injected with DKK1 (low, 0.5 mg/kg/day) or (high, 1 mg/kg/day) for 3 consecutive days. n = 6 or more. One-way ANOVA. Mean ± SEM, *P < .05, **P < .01. (J) Serum DKK1 level changes following a single injection of DKK1 (1 mg/kg) in 10-week-old C57BL/6 mice. n = 3
Figure 3
Figure 3
Involvement of DKK1-induced LRP5/6 endocytosis in up-regulating blood pressure via activating angiotensin II type 1 receptor (AT1R). (A) Systolic blood pressure following Dickkopf-1 (DKK1) injection (1 mg/kg/day) with or without monodansylcadaverine (MDC) treatment for 4 days. n = 5. One-way ANOVA. Mean ± SEM, **P < .01 vs. DKK1 alone. (B) Systolic blood pressure at 10 weeks post-HFFD model and treatment with or without MDC (left). n = 5, *P < .05 vs. HFFD alone or at 6 weeks post-streptozocin (STZ) model (right). n = 5 or more. One-way ANOVA. Mean ± SEM, *P < .05 vs. STZ alone. (C) Systolic blood pressure in 10-week-old spontaneously hypertensive rats (SHR) injected with phosphate buffered saline (PBS) or MDC, compared with age-matched Wistar Kyoto (WKY) rats. n = 10. One-way ANOVA. Mean ± SEM, ***P < .001, n.s., no significance. (D) Systolic blood pressure following DKK1 injection (1 mg/kg/day) for 2 days, with or without angiotensin receptor blocker (ARB) (losartan) or angiotensin-converting enzyme inhibitor (ACEI) (captopril). n = 5. One-way ANOVA. Mean ± SEM, *P < .05 vs. DKK1 alone. (E) Vascular contractility was measured ex vivo via wire myography following incubation of the descending thoracic aorta with PBS or DKK1 (1 µg/mL), with or without MDC, ARB (losartan), or ACEI (captopril) for 1 h. Maximum contractility was first induced with high potassium physiological saline solution (KPSS), and results were calculated based on the percentage of maximum contraction. n = 6 or more. One-way ANOVA. Mean ± SEM, ***P < .001, n.s., no significance. (F) Aortic pulse-wave velocity (PWV) based on pulse transit time was measured via echocardiography assessment at 2 weeks following injections with PBS or DKK1 (1 mg/kg/day), with or without MDC or ARB (losartan). n = 6 or more. One-way ANOVA. Mean ± SEM, ***P < .001. (G) Representative H&E staining of descending thoracic aortas (left) and wall thickness (right) at 2 weeks following injections with PBS or DKK1 (1 mg/kg/day), with or without MDC or ARB (losartan). n = 6 or more. One-way ANOVA. Mean ± SEM, ***P < .001. Scale bar, 50 µm
Figure 4
Figure 4
LDL receptor–related protein 6 (LRP6) via its ectodomain directly binds to angiotensin II type 1 receptor (AT1R). (A) Immunoprecipitation (IP) and western blot (WB) showing the expression of Myc-LRP6 following transfection with Flag-AT1R for 24 h followed by treatment with various concentrations of Dickkopf-1 in HEK293 cells for 1 h. n = 3. One-way ANOVA. Mean ± SEM, **P < .01, ***P < .001. (B) Schematic flow chart of Far-WB process (upper). Far-WB analysis showing direct interaction of recombinant LRP6N protein with Flag-AT1R (lower). n = 3. (C) Radioligand saturation assays showing interaction between AngII and AT1R. Each data point from increasing concentrations of I125-AngII incubated with HEK293 cells expressing AT1R (total binding) was subtracted by that from wild-type HEK293 cells (non-specific binding), with final saturation curve (specific binding). (D) Radioligand competition assays showing interaction between LRP6N and AT1R. Increasing amounts (0.2%–100%) of conditioned Myc-LRP6N supernatant and losartan pre-treatment and their effect on the binding of I125-AngII to AT1R-expressing HEK293 cells. Upper immunoblot showed the linear change of Myc-LRP6N supernatant. (E) Schematic illustration showing the effect of LRP6N in preventing AngII binding to AT1R
Figure 5
Figure 5
Neutralizing blood Dickkopf-1 prevents diabetic cardiac impairment. (A) Scheme of mouse high-fat/high-fructose diet (HFFD) model experiments and administrations of anti-hypertensive agents. Eight-week-old C57BL/6 mice were started on a normal diet (ND) or HFFD diet designated as Day 0. Starting at Week 3 following induction of HFFD, administration of phosphate buffered saline (PBS) or anti-hypertensive agents was performed via intraperitoneal injection once every 2 days until Week 10. (Top line) In the first group, after a 7-week halt in treatment, mice were re-administered with the respective anti-hypertensive agents for 4 weeks prior to discontinuation. (Bottom line) In the second group, after a 6.5-month halt in treatment, mice were re-administrated with the respective anti-hypertensive agents for 4 weeks. (B) Ejection fraction at Week 10 in HFFD mice administrated with BHQ880, angiotensin receptor blocker (ARB), angiotensin-converting enzyme inhibitor (ACEI), or PBS. n = 12 or more. Kruskal–Wallis test. Mean ± SEM, ***P < .001, **P < .01, n.s., no significance. (C) Ejection fraction at Week 19 in HFFD mice administrated with BHQ880, ARB, ACEI, or PBS. n = 12 or more. One-way ANOVA. Mean ± SEM, ***P < .001, n.s., no significance. (D–F) Ejection fraction (D), representative Masson’s trichrome–stained sections and quantification of myocyte cross-sectional area and cardiac fibrosis (E), and representative immunoblots and quantifications (F) at Month 10 in HFFD-fed mice administrated with PBS or BHQ880, ARB, or ACEI, followed by 6.5-month halt in treatment and then re-administration with the respective anti-hypertensives for 4 weeks. n = 4 or more. One-way ANOVA. Mean ± SEM, ***P < .001, **P < .01, n.s., no significance
Figure 6
Figure 6
Dickkopf-1 (DKK1) induces DNA damage response via inducing LRP5/6 endocytosis and activating β-arrestin1. (A) Immunofluorescence staining (left) and quantification (right) of γ-H2AX foci, cardiomyocyte-specific α-actinin 2 (Actn2), and 4′,6-diamidino-2-phenylindole (DAPI) in the heart of high-fat/high-fructose diet (HFFD)-fed mice at Week 3 injected with BHQ880 or phosphate buffered saline (PBS) for 2 weeks. n = 3. One-way ANOVA. Mean ± SEM, **P < .01 vs. HFFD alone. Scale bar, 25 µm. (B) Representative immunoblots (left) and quantification (right) of γ-H2AX expression in mice following DKK1 injection (1 mg/kg/day) with or without treatment with monodansylcadaverine (MDC) for 4 days. n = 4. One-way ANOVA. Mean ± SEM, *P < .05 vs. DKK1 alone. (C) Representative immunoblots (left) and quantification (right) of membrane and nuclear β-arrestin1 expression in the heart of HFFD-fed mice at Week 3 injected with BHQ880 or PBS for 2 weeks. n = 3. One-way ANOVA. Mean ± SEM, **P < .01 vs. HFFD alone. (D) Representative immunoblots (left) and quantification (right) of membrane and nuclear β-arrestin1 expression in the heart following injection of DKK1 in combination with MDC treatment for 1 day. n = 4. One-way ANOVA. Mean ± SEM, **P < .01 vs. DKK1 alone. (E) Representative immunoblots (left) and quantification (right) of γ-H2AX expression in control or β-arrestin1 knockout mice following injection with DKK1 (1 mg/kg/day) for 4 days. n = 4 or more. One-way ANOVA. Mean ± SEM, **P < .01 vs. DKK1 alone, n.s., no significance

Similar articles

Cited by

References

    1. Unwin N. The metabolic syndrome. J R Soc Med 2006;99:457–62. 10.1177/014107680609900917 - DOI - PMC - PubMed
    1. Gallagher EJ, Leroith D, Karnieli E. The metabolic syndrome–from insulin resistance to obesity and diabetes. Med Clin North Am 2011;95:855–73. 10.1016/j.mcna.2011.06.001 - DOI - PubMed
    1. Mottillo S, Filion KB, Genest J, Joseph L, Pilote L, Poirier P, et al. . The metabolic syndrome and cardiovascular risk a systematic review and meta-analysis. J Am Coll Cardiol 2010;56:1113–32. 10.1016/j.jacc.2010.05.034 - DOI - PubMed
    1. Ferrannini E, Cushman WC. Diabetes and hypertension: the bad companions. Lancet 2012;380:601–10. 10.1016/S0140-6736(12)60987-8 - DOI - PubMed
    1. James PA, Oparil S, Carter BL, Cushman WC, Dennison-Himmelfarb C, Handler J, et al. . 2014 evidence-based guideline for the management of high blood pressure in adults: report from the panel members appointed to the Eighth Joint National Committee (JNC 8). JAMA 2014;311:507–20. 10.1001/jama.2013.284427 - DOI - PubMed