. 2023 Dec 18;24(24):17628.
doi: 10.3390/ijms242417628.

Correlation of MR-Based Metabolomics and Molecular Profiling in the Tumor Microenvironment of Temozolomide-Treated Orthotopic GL261 Glioblastoma in Mice

Affiliations

Correlation of MR-Based Metabolomics and Molecular Profiling in the Tumor Microenvironment of Temozolomide-Treated Orthotopic GL261 Glioblastoma in Mice

Kai Zhao et al. Int J Mol Sci. .

Abstract

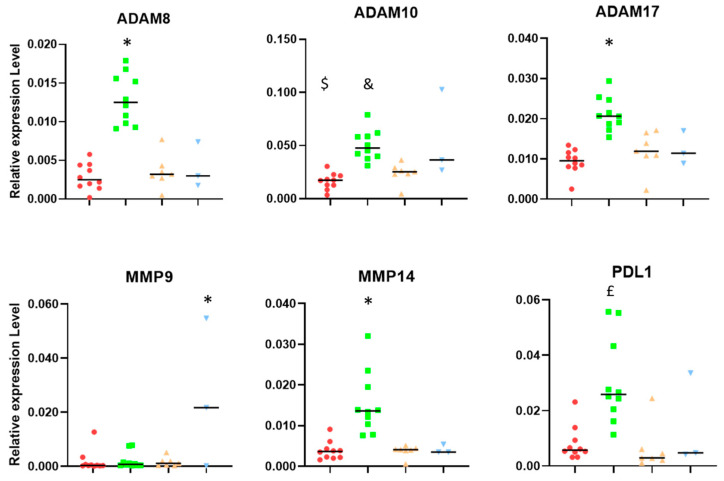
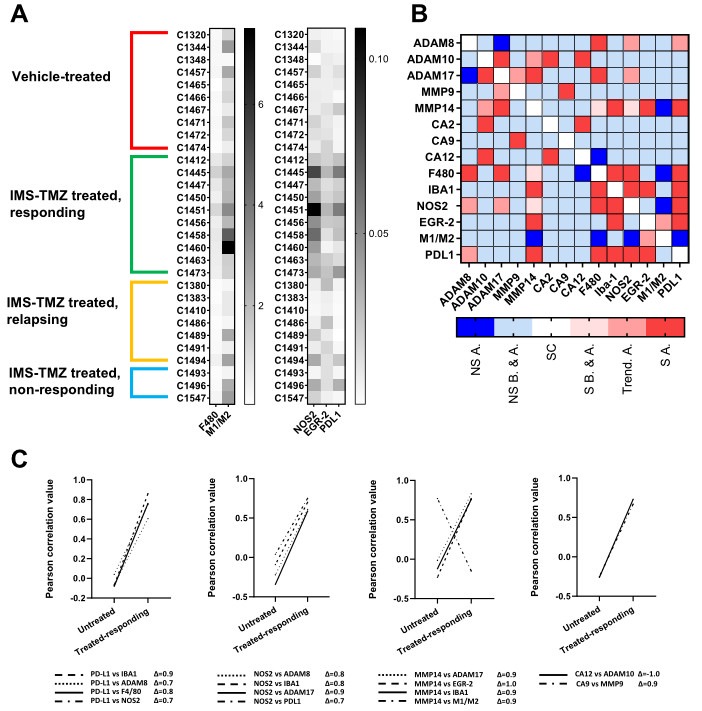
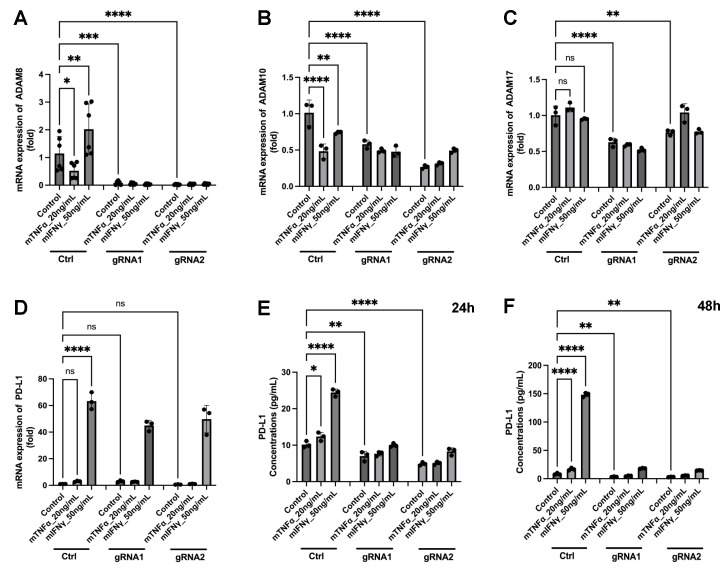
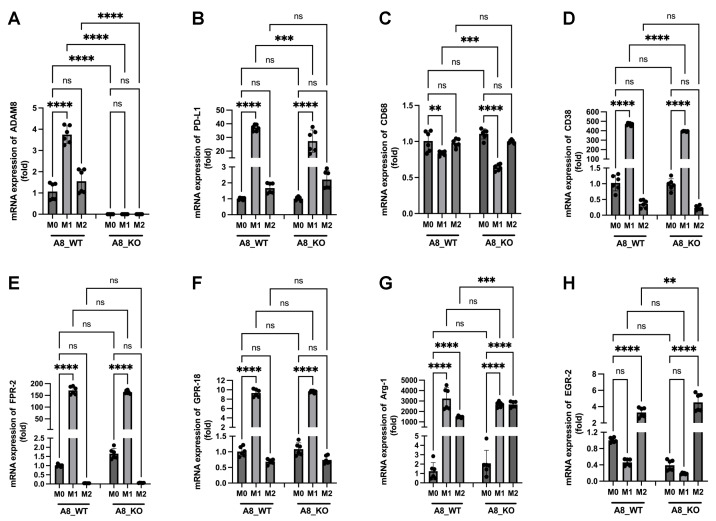
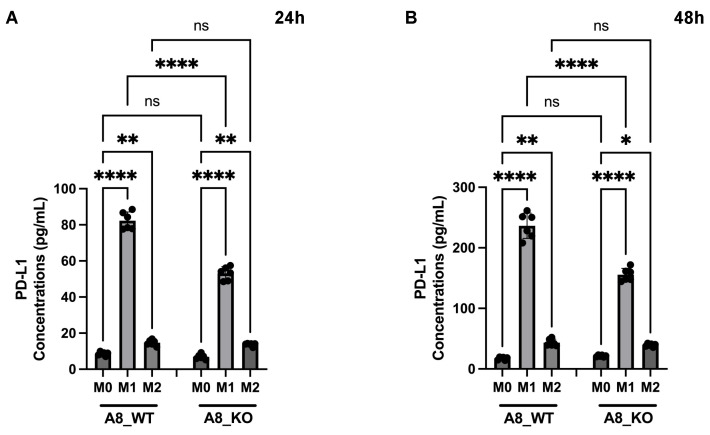
The tumor microenvironment in glioblastoma (GB) is considered to be "cold", i.e., the fraction of cytotoxic T cells, for instance, is low. Instead, macrophages are the major immune cell population in GB, which stem either from tissue response (resident microglia) or recruitment of macrophages from the periphery, thereby undergoing tumor-dependent "imprinting" mechanisms by which macrophages can adapt a tumor-supportive phenotype. In this regard, it is important to describe the nature of macrophages associated with GB, in particular under therapy conditions using the gold standard chemotherapy drug temozolomide (TMZ). Here, we explored the suitability of combining information from in vivo magnetic resonance spectroscopic (MRS) approaches (metabolomics) with in vitro molecular analyses to assess therapy response and characterize macrophage populations in mouse GB using an isogenic GL261 model. For macrophage profiling, expression levels of matrix metalloproteinases (MMPs) and A disintegrin and metalloproteinases (ADAMs) were determined, since their gene products affect macrophage-tumor cell communication by extensive cleavage of immunomodulatory membrane proteins, such as PD-L1. In tumor mice with an overall therapy response, expression of genes encoding the proteases ADAM8, ADAM10, and ADAM17 was increased and might contribute to the immunosuppressive phenotype of GB and immune cells. In tumors responding to therapy, expression levels of ADAM8 were upregulated by TMZ, and higher levels of PD-L1 were correlated significantly. Using a CRISPR/Cas9 knockout of ADAM8 in GL261 cells, we demonstrated that soluble PD-L1 (sPD-L1) is only generated in the presence of ADAM8. Moreover, primary macrophages from WT and ADAM8-deficient mice showed ADAM8-dependent release of sPD-L1, independent of the macrophage polarization state. Since ADAM8 expression is induced in responding tumors and PD-L1 shedding is likely to decrease the anti-tumor activities of T-cells, we conclude that immunotherapy resistance is caused, at least in part, by the increased presence of proteases, such as ADAM8.

Keywords: MR spectroscopic imaging; PD-L1; glioblastoma; macrophages; metalloproteases; shedding; temozolomide; therapy.


Conflict of interest statement

The authors declare no conflict of interest.

Figures

Figure 1
Figure 1
Tumor volume progression in cases used for RT-PCR studies. (A) Tumor volume progression for vehicle-treated mice (top, left, red lines) and TMZ-treated mice (top, right, green lines), treated-relapsing mice (bottom, left, orange lines), and treated-unresponsive mice (bottom, right, blue lines). This color coding for the different groups will be used in subsequent figures. TMZ was administered every 6 days, and IMS-TMZ from day 11 p.i. Volumes were calculated from the T2-weighted MRI (T2w MRI) acquisitions. An example of T2w MRI evolution for each group can be found in Supplementary Figure S2. (B) Nosological images generated from multi-slice MRSI acquisition, after being analyzed and classified with semi-supervised machine learning approaches (analyzed as in [8,20]), from 2 chosen cases marked in “A”, one IMS-TMZ-treated and responding, and another from control, vehicle-treated groups. Color coding: green, treated responding tumors; red, control/untreated tumors; blue, unaffected brain parenchyma. Mice selected for immunohistochemistry studies followed the same inclusion criteria. See Section 4.3 for the calculation of the tumor responding index (TRI). Tumor volume at the euthanasia time point and euthanasia day can be found in the supplementary information file, as well as an explanation of the nosological image formation. Multi-slice MRSI acquisition had 3 or 4 slices, depending on tumor size and coverage. Top and bottom slices had 10 × 10 matrices, and central slices had 12 × 12 matrices. Pixel sizes in nosological images: 0.5 × 0.5 × 1 mm. Adapted and improved from [16].
Figure 2
Figure 2
Relative expression levels (related to housekeeping gene expression) of genes encoding for Ki-67, F4/80, Iba-1, NOS2, and EGR-2. The M1 to M2 ratio was calculated with the relative expression levels of characteristic phenotypic markers NOS2 (M1-like) and EGR-2 (M2-like). Groups were as follows, as described in Figure 1: untreated (red), treated-high TRI (green), relapsing (orange), and non-responding (blue). Please see Section 4.3 for an explanation of high/low TRI and its meaning. * = p < 0.05 vs. all other groups. $ = p < 0.05 vs. control and relapsing;. £ = p < 0.05 vs. responding and relapsing. Black lines represent median values.
Figure 3
Figure 3
Immunostainings for F4/80, NOS2, and Arg1 to indicate macrophage populations in GB sections from untreated (A,C) or TMZ-treated and responding (B,D) mice. Stainings were performed for general macrophage marker F4/80 (green fluorescence, AD), for M1 marker NOS2 (red in A,B), and for M2 marker Arg1 (red in C,D) for use in double stains. Sections were counterstained for nuclei using DAPI. Double-positive macrophages are indicated in the red boxed areas of (AD); the scale bar in (A) is 50 μm and is valid for all images. (E,F) Quantification of macrophage populations based on counting 5 sections in each group. A proportion of M1-like (E) and M2-like (F) macrophages is provided and significant for M1 (p < 0.05) but not for M2-like (p = 0.089).
Figure 4
Figure 4
Relative expression levels (relative to housekeeping gene expression) of carbonic anhydrase CA2, CA12, and CA9. £ = p < 0.05 vs. responding and relapsing, and a trend to significance (0.05 < p < 0.1) vs. unresponsive. Groups were as follows, as described in Figure 1: untreated (red), treated-high TRI (green), relapsing (orange), and non-responding (blue).
Figure 5
Figure 5
Relative expression levels (related to housekeeping gene expression) of ADAM8, ADAM 10, and ADAM17, and MMP9, MMP14, and PD-L1. Groups were as follows, as described in Figure 1: untreated (red), treated-high TRI (green), relapsing (orange), and non-responding (blue). Please see Section 4.3 for an explanation of high/low TRI and its meaning. * = p < 0.05 vs. all other groups. $ = p < 0.05 vs. responding and non-responding. & = p < 0.05 vs. relapsing. £ = p < 0.05 vs. responding and relapsing.
Figure 6
Figure 6
(A) Heatmaps for relative expression levels (relative to housekeeping gene expression) of F4/80, Iba-1, NOS2, EGR-2, and PD-L1. The M1 to M2 ratio was calculated with the relative expression levels of the characteristic phenotypic markers NOS2 and EGR-2. Groups were as follows: untreated (red), treated and responding (green), relapsing (orange), and non-responding (blue). Groups were separated into two different heatmaps due to the difference in relative expression levels. (B) Heatmap expressing how correlation coefficients change after successful treatment (i.e., treated-responding mice). We assumed that the “control” mouse situation is representative of the pre-treatment situation in all cases. (C) Graphs showing the magnitude of change in Pearson correlation coefficient during response to IMS-TMZ treatment for correlations achieving significance, or tending to significance, during response to treatment. Legend for Figure 6B: NS.A. non-significant (loses significance) after therapy; NS B&A, non-significant before and after therapy; SC, self-correlation; S B&A, significant before and after therapy; Trend A. trend to significance after therapy; S.A. achieve significance after therapy.
Figure 7
Figure 7
ADAM8 mediates the release of PD-L1 from mouse glioblastoma GL261 cells. (A-D) Expression of ADAM proteases ADAM8, 10, and 17 and PD-L1 in GL261_Ctrl cell, GL261_ADAM8_gRNA1 knockout cell, and GL261_ADAM8_gRNA2 knockout cell. The mRNA expression of ADAM8 (A), ADAM10 (B), ADAM17 (C), and PD-L1 (D) after mTNFα (20 ng/mL) and mIFNγ (50 ng/mL) stimulation at 24 h was detected by RT-PCR. The mRNA level of ADAM8 in GL261_Ctrl cells increased after mIFNγ stimulation (A). (E,F) PD-L1, detected by ELISA measurement from the conditioned media of the treated cells from RT-qPCR experiments, was strongly released after mIFNγ stimulation in GL261_Ctrl cells at 24 h (E) and 48 h (F) time points. Data are presented as mean ± SD, One-way ANOVA was used for analysis. * p < 0.05; ** p < 0.01; *** p < 0.001; **** p < 0.0001; ns: not significant.
Figure 8
Figure 8
Expression of M1 and M2 polarization macrophage markers in macrophages isolated from the bone marrow of A8 WT mice and A8 KO mice. (A) ADAM8, (B) PD-L1, (C) CD68, (DF) M1-polarization macrophage marker, CD38, FPR2, and CPR-18, (G,H) M2-polarization macrophage marker, Arg-1 and EGR-2 after LPS, mIFNγ, and mIL4 stimulation at 24 h were detected by RT-PCR. Data are presented as mean ± SD. A one-way ANOVA was used. ** p < 0.01; *** p < 0.001; **** p < 0.0001; ns: not significant.
Figure 9
Figure 9
PD-L1 release is dependent on M1 polarization in ADAM8-expressing macrophages. PD-L1 release after LPS, mIFNγ, and mIL4 stimulation at 24 h (A) and 48 h (B) was detected by ELISA measurement. Data are presented as mean ± SD. A one-way ANOVA was used for analysis. * p < 0.05; ** p < 0.01; **** p < 0.0001; ns: not significant.
Figure 10
Figure 10
Metabolome view showing all matched pathways according to the p values from the pathway enrichment analysis and the pathway impact values from the pathway topology analysis. The main potentially affected pathways are shown.

Similar articles

References

    1. Oronsky B., Reid T.R., Oronsky A., Sandhu N., Knox S.J. A Review of Newly Diagnosed Glioblastoma. Front. Oncol. 2020;10:574012. doi: 10.3389/fonc.2020.574012. - DOI - PMC - PubMed
    1. DeCordova S., Shastri A., Tsolaki A.G., Yasmin H., Klein L., Singh S.K., Kishore U. Molecular Heterogeneity and Immunosuppressive Microenvironment in Glioblastoma. Front. Immunol. 2020;11:1402. doi: 10.3389/fimmu.2020.01402. - DOI - PMC - PubMed
    1. Brown N.F., Carter T.J., Ottaviani D., Mulholland P. Harnessing the immune system in glioblastoma. Br. J. Cancer. 2018;119:1171–1181. doi: 10.1038/s41416-018-0258-8. - DOI - PMC - PubMed
    1. Himes B.T., Geiger P.A., Ayasoufi K., Bhargav A.G., Brown D.A., Parney I.F. Immunosuppression in Glioblastoma: Current Understanding and Therapeutic Implications. Front. Oncol. 2021;11:770561. doi: 10.3389/fonc.2021.770561. - DOI - PMC - PubMed
    1. Bikfalvi A., da Costa C.A., Avril T., Barnier J.V., Bauchet L., Brisson L., Cartron P.F., Castel H., Chevet E., Chneiweiss H., et al. Challenges in glioblastoma research: Focus on the tumor microenvironment. Trends Cancer. 2023;9:9–27. doi: 10.1016/j.trecan.2022.09.005. - DOI - PubMed