. 2023 Dec 9;24(24):17294.
doi: 10.3390/ijms242417294.

Positive Regulation of S-Adenosylmethionine on Chondrocytic Differentiation via Stimulation of Polyamine Production and the Gene Expression of Chondrogenic Differentiation Factors

Affiliations

Positive Regulation of S-Adenosylmethionine on Chondrocytic Differentiation via Stimulation of Polyamine Production and the Gene Expression of Chondrogenic Differentiation Factors

Loc Dinh Hoang et al. Int J Mol Sci. .

Abstract

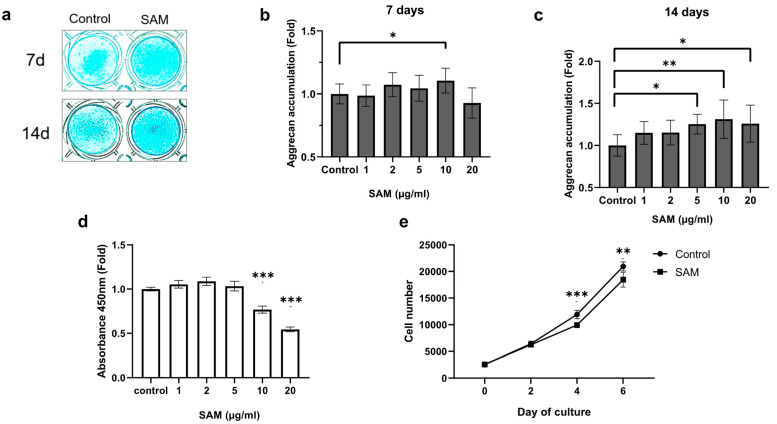
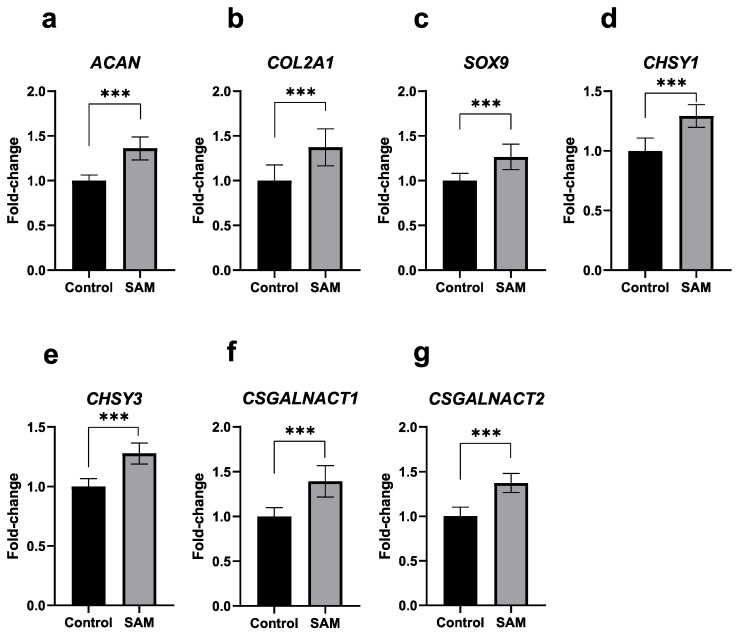
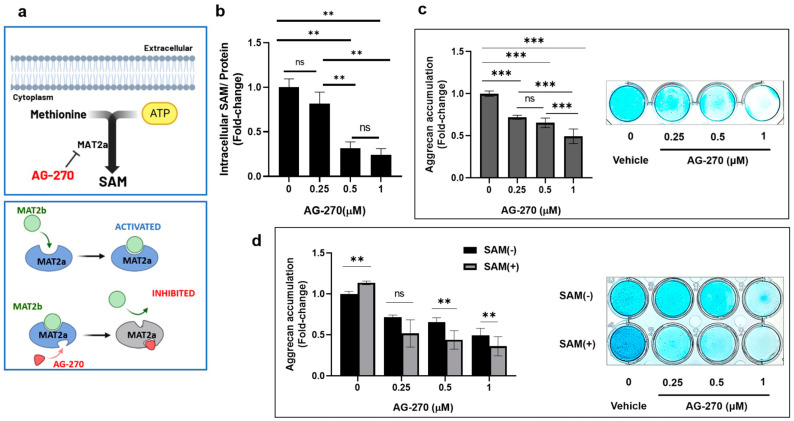
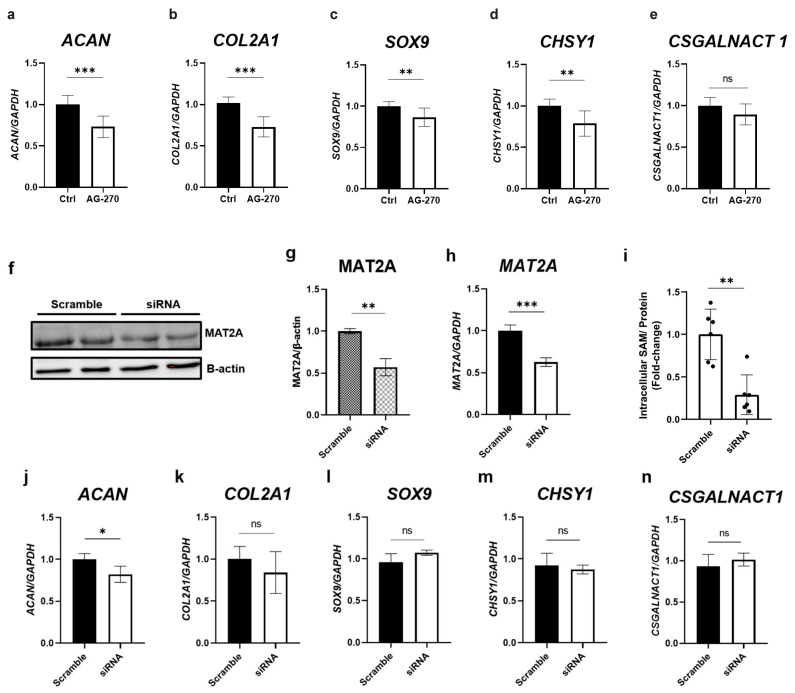
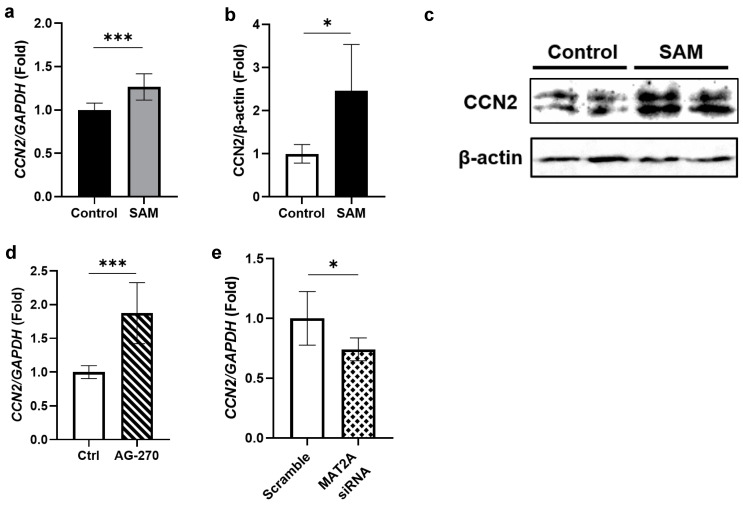
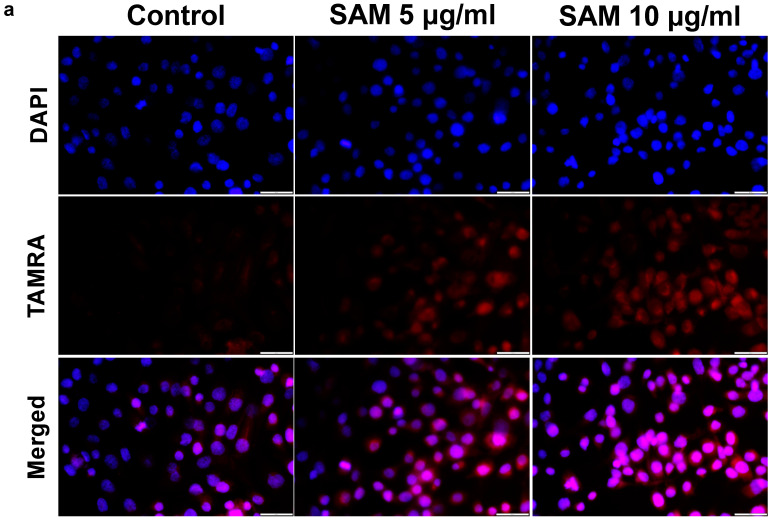
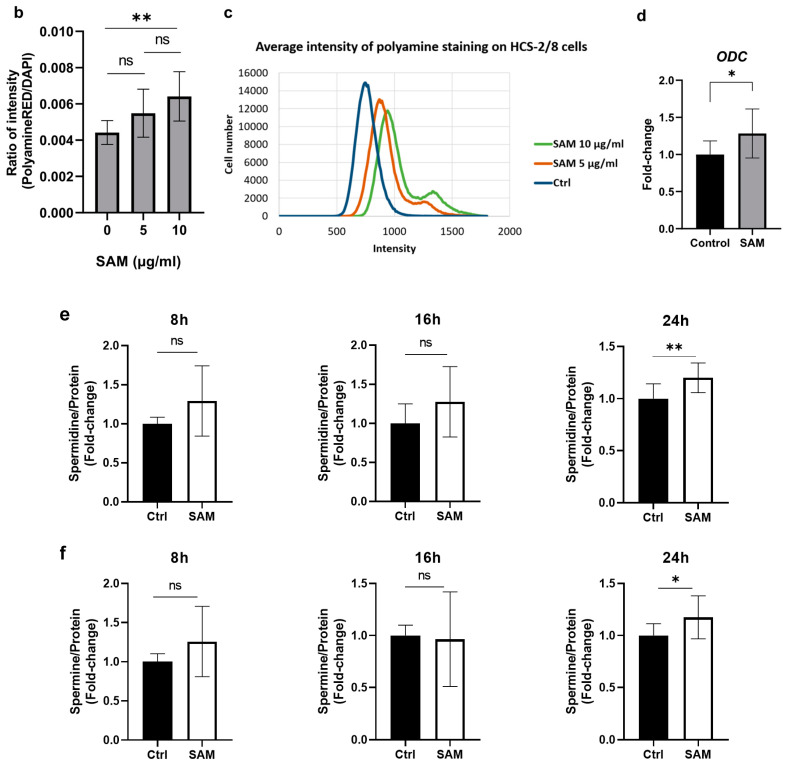
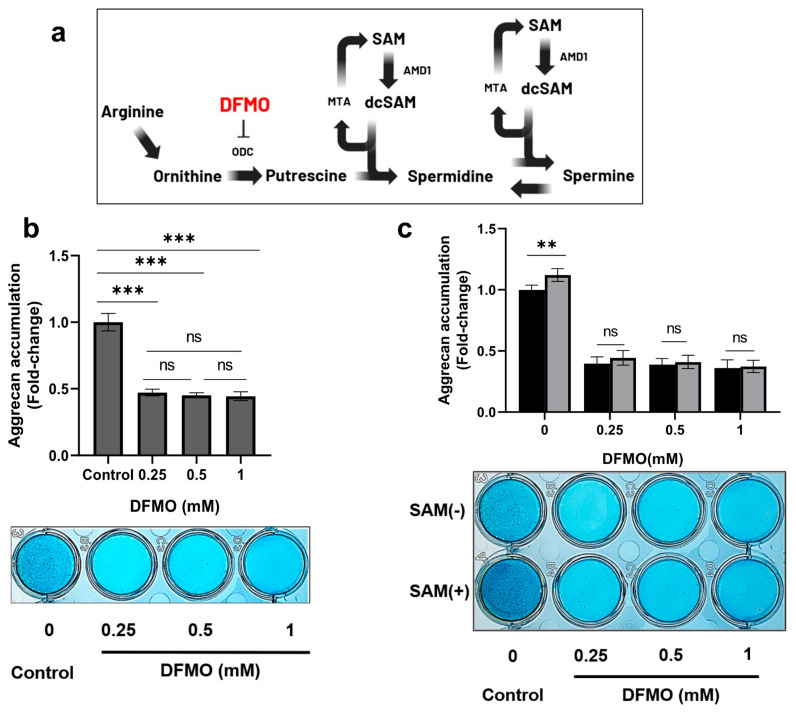
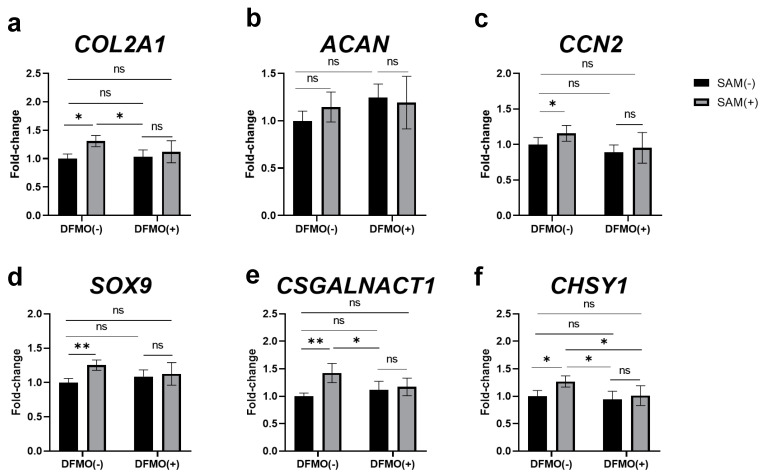
S-adenosylmethionine (SAM) is considered to be a useful therapeutic agent for degenerative cartilage diseases, although its mechanism is not clear. We previously found that polyamines stimulate the expression of differentiated phenotype of chondrocytes. We also found that the cellular communication network factor 2 (CCN2) played a huge role in the proliferation and differentiation of chondrocytes. Therefore, we hypothesized that polyamines and CCN2 could be involved in the chondroprotective action of SAM. In this study, we initially found that exogenous SAM enhanced proteoglycan production but not cell proliferation in human chondrocyte-like cell line-2/8 (HCS-2/8) cells. Moreover, SAM enhanced gene expression of cartilage-specific matrix (aggrecan and type II collagen), Sry-Box transcription factor 9 (SOX9), CCN2, and chondroitin sulfate biosynthetic enzymes. The blockade of the methionine adenosyltransferase 2A (MAT2A) enzyme catalyzing intracellular SAM biosynthesis restrained the effect of SAM on chondrocytes. The polyamine level in chondrocytes was higher in SAM-treated culture than control culture. Additionally, Alcian blue staining and RT-qPCR indicated that the effects of SAM on the production and gene expression of aggrecan were reduced by the inhibition of polyamine synthesis. These results suggest that the stimulation of polyamine synthesis and gene expression of chondrogenic differentiation factors, such as CCN2, account for the mechanism underlying the action of SAM on chondrocytes.

Keywords: CCN2; ODC; S-adenosylmethionine; chondrocyte differentiation; gene expression; polyamine.


Conflict of interest statement

The authors declare no conflict of interest.

Figures

Figure 1
Figure 1
SAM enhances aggrecan production in chondrocytes, but negatively regulated cell proliferation in chondrocytes. Human chondrocyte-like cell line-2/8 (HCS-2/8) cells (1 × 10⁵ cells/well) were inoculated in 24-well plates and allowed to adhere for 24 h. Subsequently, S-adenosylmethionine (SAM) was added to culture at the indicated concentrations and kept incubated for 7 or 14 days. (a) Alcian blue staining revealed an increase of aggrecan accumulation in SAM-treated groups. (b,c) Quantitative measurement of Alcian blue staining on HCS-2/8 cells cultured with 7-day (b) and 14-day (c) of SAM stimulation showed that the addition of SAM significantly enhanced aggrecan production in HCS-2/8 cells (values are represent the fold-changes relative to a non-treated group, one-way ANOVA, Dunnett, n = 12). (d) Cell counting assay in cultures with several concentrations of SAM. HCS-2/8 cells (3000 cells/well) were inoculated in 96-well plates and allowed to adhere for 24 h. Cells were treated with the indicated concentrations of SAM for 2 days, and cell viability was measured with a WST-8 assay kit, as described in the Materials and Methods. The Y axis shows the relative ratio of absorbance to control that was obtained at a wavelength of 450 nm (ratio = 1) (one-way ANOVA, Dunnett, *** p < 0.005, n = 3). (e) Counting the number of cells cultured with SAM at several time points. Cells were treated with 10 μg/mL SAM for the indicated days and stained with DAPI. The number of nuclei was counted as the number of the cells using a Cellomics Array ScanTM High Content Screening System. (The numbers of cells in the SAM-treated group and control group at each time point were compared using Welch’s t test, * p < 0.05, ** p < 0.01, *** p < 0.005, n = 10).
Figure 2
Figure 2
SAM enhances the gene expression of cartilage-specific markers, chondrogenesis associated factors, and enzymes involved in chondroitin sulfate synthesis in chondrocytes. HCS-2/8 cells were placed in 6-well plates at a density of 6 × 10⁵ cells/well and incubated with SAM at a concentration of 10 μg/mL. Three days later, total RNAs were extracted from the cells and subjected to RT-qPCR to detect the effects of SAM stimulation on the gene expression. The results demonstrated that the addition of SAM enhanced the gene expression of cartilage-specific markers: ACAN (a), COL2A1 (b); a chondrogenesis-associated factor: SOX9 and enzymes involved in chondroitin sulfate synthesis: (c); CHSY1 (d); CHSY3 (e); CSGALNACT1 (f) CSGALNACT2 (g) (values represent the fold-change relative to a non-treated group as control, Welch’s t-test, *** p < 0.005, n = 9).
Figure 3
Figure 3
The inhibition of intracellular SAM synthesis impedes aggrecan accumulation in HCS-2/8 chondrocytes. (a) A diagram of AG-270 inhibiting methionine adenosyltransferase 2A (MAT2A), an enzyme catalyzing the production of SAM from methionine and ATP. (b) AG-270 pretreatment decreased intracellular SAM levels in HCS-2/8 cells. Cells were treated with AG-270 at the indicated concentrations for 3 days and the cell lysates were subjected to an ELISA (one-way ANOVA, Dunnett, ** p < 0.01, n = 3). (c) AG-270 pretreatment suppressed aggrecan production in HCS-2/8 cells. Cells were treated with AG-270 at the indicated concentrations for 14 days and then cell layers were stained by Alcian blue (one-way ANOVA, Dunnett, *** p < 0.005, n = 6). The images show the representative result. (d) The addition of SAM aggravated negative effect of AG-270 on aggrecan production. HCS-2/8 cells were cultured with AG-270/vehicle at the indicated concentration with/without SAM (10 μg/mL) for 14 days and then cell layers were stained with Alcian blue (two-way ANOVA, Tukey, ** p < 0.01, n = 6). ns = not significant. The images show the representative result. In all experiments, values represent the fold-change relative to non-treated groups (ratio = 1).
Figure 4
Figure 4
The inhibition of intracellular SAM synthesis decreases the gene expression of cartilage-related factors. HCS-2/8 cells were seeded in 6-well plates at 6 × 10⁵ cells/well and allowed to adhere for 24 h prior to incubation with inhibitor or siRNA, as described in “Materials and Methods.” (ae) The effect of AG-270 on the gene expression of the following cartilage-related factors were analyzed by RT-qPCR: (a) ACAN, (b) COL2A1, (c) SOX9, (d) CHSY1, (e) CSGALNACT1 (n = 9). (f,g) Western blotting and (h) RT-qPCR confirmed the efficiency of knockdown of siRNA targeting MAT2A (n = 5). (i) The amount of intracellular SAM was significantly decreased by the knockdown of MAT2A (n = 6). (jn) The gene expression of cartilage-related factors under the effect of MAT2A knockdown: (j) ACAN, (k) COL2A1, (l) SOX9, (m) CHSY1, and (n) CSGALNACT1 (n = 5). All data are presented as the mean ± SD of fold-change relative to the control group (Welch’s t-test, * p < 0.05, ** p < 0.01, *** p < 0.005). ns = not significant.
Figure 5
Figure 5
Effect of SAM on the gene expression and protein level of CCN2 in HCS-2/8 cells. HCS-2/8 cells were placed in 6-well plates at a density of 6 ×10⁵ cells/well and allowed to settle for 24 h prior to the subsequent experiments. (a) Exogenous SAM enhanced the gene expression of CCN2 (n = 9). Cells were treated with SAM (10 μg/mL) for 3 days, then total RNAs were extracted and subjected to RT-qPCR. (b,c) The addition of SAM enhanced the protein level of CCN2. Cells were cultured with SAM (10 μg/mL) for 6 days, then cell lysates were prepared and analyzed by western blotting (c) with an antibody specific to CCN2. (b) Quantitative values of western blots were calculated from the density of the CCN2 signals and normalized to the signals of β-actin (n = 5). (d)The effect of AG-270 on the gene expression of CCN2 in HCS-2/8 cells. Cells were treated with AG-270 (1 μM) or DSMO, for 3 days and RT-qPCR showed that AG-270 significantly increased the gene expression of CCN2 (n = 9). (e) The effect of siRNA against MAT2A on the gene expression of CCN2 in HCS-2/8 cells. Cells were transfected with siRNA against MAT2A (80 pmol) or scramble siRNA by lipofectamine for 24 h and subjected to RNA extraction and RT-qPCR. The result shows that MAT2A knockdown significantly suppressed the gene expression of CCN2 (n = 5). In these graphs, the Y axis presents the fold-change relative to the control group set up at ratio = 1 (Welch’s t test, * p < 0.05, *** p < 0.005).
Figure 6
Figure 6
Additional SAM promoted polyamine production in chondrocytes. (a) PolyamineRED staining indicated polyamine levels were enhanced by additional SAM in HCS-2/8 cells. HCS-2/8 cells were seeded in 96-well plates at a density of 3000 cells/well and cultured in the presence of SAM (10 μg/mL) for 3 days. Then the cells were stained with PolyamineRED as described in Materials and Methods. The scale bar indicates 500 μm. (b) The intensity levels of stained cells shown in (a) were measured with a fluorescent plate reader. (c) The histogram of PolyamineRED intensity from each cell (X-axis) versus cell numbers (Y-axis). (d) SAM enhanced the expression of ornithine decarboxylase (ODC). HCS-2/8 cells (6 × 10⁵ cells/well) were seeded in 6-well plates and incubated with SAM (10 μg/mL) for 3 days. Total RNAs were extracted from cells and subjected to RT-qPCR. The quantitation was normalized to GAPDH and the level set in control = 1 (Welch’s t-test, * p < 0.05, n = 9). (e,f) An HPLC analysis of spermidine and spermine in HCS-2/8 cells. Cells (6 × 10⁵ cells/well) were seeded in 6-well plates and allowed to adhere for 24 h. Then, SAM was added at the concentrations of 10 μg/mL and incubated for indicated time. Cell lysates were collected at the time indicated and subjected to HPLC as described in Materials and Methods. The levels of spermidine (e) and spermine (f) were normalized to total protein levels. (Welch’s t test, * p < 0.05,** p < 0.01, n = 6). ns = not significant.
Figure 6
Figure 6
Additional SAM promoted polyamine production in chondrocytes. (a) PolyamineRED staining indicated polyamine levels were enhanced by additional SAM in HCS-2/8 cells. HCS-2/8 cells were seeded in 96-well plates at a density of 3000 cells/well and cultured in the presence of SAM (10 μg/mL) for 3 days. Then the cells were stained with PolyamineRED as described in Materials and Methods. The scale bar indicates 500 μm. (b) The intensity levels of stained cells shown in (a) were measured with a fluorescent plate reader. (c) The histogram of PolyamineRED intensity from each cell (X-axis) versus cell numbers (Y-axis). (d) SAM enhanced the expression of ornithine decarboxylase (ODC). HCS-2/8 cells (6 × 10⁵ cells/well) were seeded in 6-well plates and incubated with SAM (10 μg/mL) for 3 days. Total RNAs were extracted from cells and subjected to RT-qPCR. The quantitation was normalized to GAPDH and the level set in control = 1 (Welch’s t-test, * p < 0.05, n = 9). (e,f) An HPLC analysis of spermidine and spermine in HCS-2/8 cells. Cells (6 × 10⁵ cells/well) were seeded in 6-well plates and allowed to adhere for 24 h. Then, SAM was added at the concentrations of 10 μg/mL and incubated for indicated time. Cell lysates were collected at the time indicated and subjected to HPLC as described in Materials and Methods. The levels of spermidine (e) and spermine (f) were normalized to total protein levels. (Welch’s t test, * p < 0.05,** p < 0.01, n = 6). ns = not significant.
Figure 7
Figure 7
DFMO inhibites the SAM-induced aggrecan accumulation in chondrocytes. (a) The position inhibited by difluoromethylornithine (DFMO) in polyamine biosynthesis pathway. (b) Aggrecan accumulation was drastically reduced by DFMO. HCS-2/8 cells (1 × 10⁵ cells/well) were seeded in 24-well plates and allowed to adhere for 24 h. Then cells were cultured with DFMO at the indicated concentrations for 14 days. Alcian blue staining was performed to measure the aggrecan accumulation. (*** p < 0.005, One-way ANOVA, Dunnett, n = 6). (c) The aggrecan enhancement that occurred with the addition of SAM was suppressed by DFMO. HCS-2/8 cells (10 × 104 cells/well) were seeded in 24-well plates and allowed to adhere for 24 h. Then cells were cultured with/without SAM (10 μg/mL) in the presence of DFMO for 14 days. Alcian blue staining was performed to measure the aggrecan accumulation. (** p < 0.01, two-way ANOVA, Tukey, n = 6). ns = not significant. These values represent the relative ratio to the DFMO(-) SAM(-) group as the control (ratio = 1.0).
Figure 8
Figure 8
DFMO inhibited the SAM-induced enhancement of the gene expression in HCS-2/8 cells. HCS-2/8 cells (6 × 10⁵ cells/well) were seeded in 24-well plates and allowed to adhere for 24 h. Then cells were treated with DFMO (0.5 mM) with/without SAM (10 μg/mL) for the next 3 days. Subsequently, total RNAs were extracted from the cells and the expression of (a) COL2A1, (b) ACAN, (c) CCN2, (d) SOX9, (e) CSGALNACT1, and (f) CHSY1 was analyzed by RT-qRCR. In these experiments, SAM(-) DFMO(-) was used as control. In these experiments, SAM(-) DFMO(-) was used as control (* p < 0.05, ** p < 0.01, two-way ANOVA, Tukey, n = 6). ns = not significant.

Similar articles

References

    1. Mato J.M., Martínez-Chantar M.L., Lu S.C. S-Adenosylmethionine Metabolism and Liver Disease. Ann. Hepatol. 2013;12:183–189. doi: 10.1016/S1665-2681(19)31355-9. - DOI - PMC - PubMed
    1. Toennies G. Sulfonium reactions of methionine and their possible metabolic significance. J. Biol. Chem. 1940;132:455–456. doi: 10.1016/S0021-9258(18)73428-5. - DOI
    1. Cantoni G.L. S-Adenosylmethionine: A new intermediate formed enzymatically from l-methionine and adenosinetriphosphate. J. Biol. Chem. 1953;204:403–416. doi: 10.1016/S0021-9258(18)66148-4. - DOI - PubMed
    1. Cuomo A., Beccarini Crescenzi B., Bolognesi S., Goracci A., Koukouna D., Rossi R., Fagiolini A. S-Adenosylmethionine (SAMe) in Major Depressive Disorder (MDD): A Clinician-Oriented Systematic Review. Ann. Gen. Psychiatry. 2020;19:50. doi: 10.1186/s12991-020-00298-z. - DOI - PMC - PubMed
    1. Zhang Y., Ma R., Deng Q., Wang W., Cao C., Yu C., Li S., Shi L., Tian J. S-Adenosylmethionine Improves Cognitive Impairment in D-Galactose-Induced Brain Aging by Inhibiting Oxidative Stress and Neuroinflammation. J. Chem. Neuroanat. 2023;128:102232. doi: 10.1016/j.jchemneu.2023.102232. - DOI - PubMed