. 2023 Dec 20;15(24):15114-15133.
doi: 10.18632/aging.205336. Epub 2023 Dec 20.

Long non-coding RNA signature for predicting gastric cancer survival based on genomic instability

Affiliations

Long non-coding RNA signature for predicting gastric cancer survival based on genomic instability

Jialing Zhang et al. Aging (Albany NY). .

Abstract

Background: Gastric cancer is a prevalent type of tumor with a poor prognosis. Given the high occurrence of genomic instability in gastric cancer, it is essential to investigate the prognostic significance of genes associated with genomic instability in this disease.

Methods: We identified genomic instability-related lncRNAs (GInLncRNAs) by analyzing somatic mutation and transcriptome profiles. We evaluated co-expression and enrichment using various analyses, including univariate COX analysis and LASSO regression. Based on these findings, we established an lncRNA signature associated with genomic instability, which we subsequently assessed for prognostic value, immune cell and checkpoint analysis, drug sensitivity, and external validation. Finally, PCR assay was used to verify the expression of key lncRNAs.

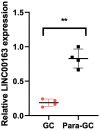
Results: Our study resulted in the establishment of a seven-lncRNA prognostic signature, including PTENP1-AS, LINC00163, RP11-169F17.1, C8ORF87, RP11-389G6.3, LINCO1210, and RP11-115H13.1. This signature exhibited independent prognostic value and was associated with specific immune cells and checkpoints in gastric cancer. Additionally, the model was correlated with somatic mutation and several chemotherapeutic drugs. We further confirmed the prognostic value of LINC00163, which was included in our model, in an independent dataset. Our model demonstrated superior performance compared to other models. PCR showed that LINC00163 was significantly up-regulated in 4 adjacent normal tissues compared with the GC tissues.

Conclusions: Our study resulted in the establishment of a seven-lncRNA signature associated with genomic instability, which demonstrated robust prognostic value in predicting the prognosis of gastric cancer. The signature also identified potential chemotherapeutic drugs, making it a valuable tool for clinical decision-making and medication use.

Keywords: gastric cancer; genomic instability; immune checkpoint; lncRNA; prognosis.


Conflict of interest statement

CONFLICTS OF INTEREST: The authors declare that they have no conflicts of interest.

Figures

Figure 1
Figure 1
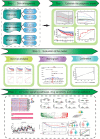
The flow chart.
Figure 2
Figure 2
(A) Expression of differential genes in GS-like group and GU-like group. The darker the red, the higher the expression level, and the darker the blue, the lower the expression level. (B) The display of differential genes in the volcano map: the top five most up-regulated lncRNAs and the top five most down-regulated lncRNAs were labeled respectively. The blue indicated down-regulated lnRNA, and the red indicated up-regulated lncRNAs. (C) The number of somatic mutations in GS-like group and Gu-like group was different (*** p <0.001). (D) The expression of UBQLN4 gene was different between the GS-like group and the Gu-like group (*** p <0.001). (E) The differentially expressed lncRNAs and the top 10 most related mRNAs formed a co-expression network, with yellow representing lncRNAs and green representing mRNAs. (F) GO enrichment analysis in GS-like group and GU-like group. The top five most significantly enriched functions were extracted from BP, CC and MF (p<0.05). (G) KEGG enrichment.
Figure 3
Figure 3
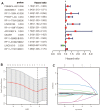
(A) After univariate Cox regression, 11 prognostic related ginlncRNAs were obtained, of which 10 were deleterious genes and one was protective gene. (B, C) Lasso regression results showed that when the best lambda value was 0.01149079, the following curve tended to be stable, and 7 lncRNAs were selected for the model construction.
Figure 4
Figure 4
(AC) Prognostic differences between the high-risk and low-risk groups were investigated in the training set, validation set, and the entire dataset. High risk was found to indicate poor prognosis in all three datasets (p<0.001). (DF) In the training set, validation set and the entire set, the AUC values obtained by the prognostic model to predict the accuracy of the 5-year survival rate of patients were 0.741, 0.798 and 0.747, respectively.
Figure 5
Figure 5
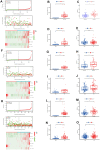
(A) In the training set, we can see the distribution of patient survival and death as the risk score increased, as well as the heat map of lncRNAs expression in the high-risk and low-risk groups. (B, C) In the training set, the number of somatic mutations and the expression of UBQLN4 gene were different between the GS-like group and the Gu-like group (** p<0.01, *** p<0.001). (D, E) In the training set, the number of somatic mutations and the expression of UBQLN4 gene were different between the high-risk group and the low-risk group (** p<0.01, *** p<0.001). (F) In the validation set, we can see the distribution of patient survival and death as the risk score increased, as well as the heat map of lncRNAs expression in the high-risk and low-risk groups. (G, H) In the validation set, the number of somatic mutations and the expression of UBQLN4 gene were different between the GS-like group and the Gu-like group (** p <0.01, *** p<0.001). (I, J) In the validation set, the number of somatic mutations and the expression of UBQLN4 gene were different between the high-risk group and the low-risk group (** p <0.01, *** p <0.001). (K) In the entire set, we can see the distribution of patient survival and death as the risk score increased, as well as the heat map of lncRNAs expression in the high-risk and low-risk groups. (L, M) In the entire set, the number of somatic mutations and the expression of UBQLN4 gene were different between the GS-like group and the Gu-like group (** p<0.01, *** p <0.001). (N, O) In the entire set, the number of somatic mutations and the expression of UBQLN4 gene were different between the high-risk group and the low-risk group (** p <0.01, ***p <0.001).
Figure 6
Figure 6
(A) Univariate Cox regression for risk-score, gender, age, and tumor stage in the training set found that risk score and stage were independent prognostic factors (p<0.05). (B) Multivariate Cox regression for risk-score, gender, age, and tumor stage in the training set found that risk score and stage were independent prognostic factors (p<0.05). (C) Univariate Cox regression for risk-score, gender, age, and tumor stage in the validation set found that risk-score and stage were independent prognostic factors (p<0.05). (D) Multivariate Cox regression for risk-score, gender, age, and tumor stage in the validation set found that risk score, age, and stage were independent prognostic factors (p<0.05). (E) Univariate Cox regression for risk-score, gender, age, and tumor stage in the entire set found that risk-score, age, and stage were independent prognostic factors (p <0.05). (F) Multivariate Cox regression for risk-score, gender, age, and tumor stage in the entire set found that risk score, age, and stage were independent prognostic factors (p <0.05).
Figure 7
Figure 7
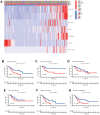
(A) Heat maps of the relationship between ginlncRNAs in high-risk group and low-risk group, GU-like group and GS-like group, tumor stage, age, and sex (* p<0.01, ** p<0.01, *** p<0.001). (B) The risk values of the constructed model were associated with poorer prognosis in male gastric cancer patients (p<0.05). (C) The risk value of the established model was associated with poor prognosis in patients with gastric cancer aged <=65 years (p<0.05). (D) The risk value of the constructed model was associated with poor prognosis in both early gastric cancer patients (p<0.05). (E) In female patients (p<0.05); (F) in aged >65 patients (p<0.05); (G) in late stage patients (p<0.05).
Figure 8
Figure 8
(A) A Nomogram for predicting prognosis based on risk value, age, tumor stage, and sex shows the clinical characteristics of the patient (TCGA-CG-571) and the predicted 1 -, 3 - and 5-year mortality of 0.177, 0.472, and 0.605, respectively. (BD) The 1 -, 3 - and 5-year calibration curve constructed by risk value was used to evaluate the accuracy of prognosis prediction based on risk score, and the results were all satisfactory.
Figure 9
Figure 9
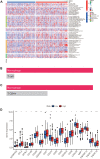
(A) Heat maps of immune cells that differ between the high-risk and low-risk groups. (B, C) Macrophage was the most different immune cells predicted by Dreimt database among the high-risk and low-risk groups (p<0.05). (D) Immune checkpoint genes that were differentially expressed in the high-risk and low-risk groups were selected and presented in a boxplot. (* p< 0.05, **p < 0.01, * * * p< 0.001).
Figure 10
Figure 10
(A) Chemotherapy drugs with differential IC50 expression in the high-risk and low-risk groups predicted by the Prophetic package, and drugs with low IC50 expression in the high risk group were screened out (* * p < 0.01, ***p < 0.001). (B) The drugs predicted by DREMIT website are different in the high and low risk groups, in which the best candidates in the first and second quadrants mean the candidates with more reliable results, while the remaining drugs mean better candidates. (C) Classification of predicted chemotherapeutic drug validation levels. (D) Drug classification of predicted chemotherapeutic agents.
Figure 11
Figure 11
Through GSVA analysis, significant enrichment pathways with differences in the high-risk and low-risk groups were obtained (p <0.05). Pathways enriched in the high-risk group were marked in red, those enriched in the low-risk group were marked in blue, and those enriched in -2<t<2 were marked in gray.
Figure 12
Figure 12
(A) KM survival curve of LINC00163 in gastric cancer:High expression of LINC00163 was associated with poor prognosis (p<0.001). (BD) Expression of LINC00163 in different stages, genders and ages of gastric cancer. (E) Our model was compared with other models by plotting a 5-year ROC curve associated with prognosis.
Figure 13
Figure 13
PCR showed that LINC00163 was significantly up-regulated in 4 adjacent normal tissues compared with the GC tissues. **p<0.01.

Similar articles

Cited by

References

    1. Bailey P, Chang DK, Nones K, Johns AL, Patch AM, Gingras MC, Miller DK, Christ AN, Bruxner TJ, Quinn MC, Nourse C, Murtaugh LC, Harliwong I, et al., and Australian Pancreatic Cancer Genome Initiative. Genomic analyses identify molecular subtypes of pancreatic cancer. Nature. 2016; 531:47–52. 10.1038/nature16965 - DOI - PubMed
    1. Wachsmannova L, Mego M, Stevurkova V, Zajac V, Ciernikova S. Novel strategies for comprehensive mutation screening of the APC gene. Neoplasma. 2017; 64:338–43. 10.4149/neo_2017_303 - DOI - PubMed
    1. Andor N, Maley CC, Ji HP. Genomic Instability in Cancer: Teetering on the Limit of Tolerance. Cancer Res. 2017; 77:2179–85. 10.1158/0008-5472.CAN-16-1553 - DOI - PMC - PubMed
    1. Gerlach SU, Herranz H. Genomic instability and cancer: lessons from Drosophila. Open Biol. 2020; 10:200060. 10.1158/10.1098/rsob.200060 - DOI - PMC - PubMed
    1. Graziano S, Gonzalo S. Mechanisms of oncogene-induced genomic instability. Biophys Chem. 2017; 225:49–57. 10.1016/j.bpc.2016.11.008 - DOI - PMC - PubMed

Publication types

Substances