. 2023 Dec 20;15(24):14996-15024.
doi: 10.18632/aging.205327. Epub 2023 Dec 20.

ATRX is a predictive marker for endocrinotherapy and chemotherapy resistance in HER2-/HR+ breast cancer through the regulation of the AR, GLI3 and GATA2 transcriptional network

Affiliations

ATRX is a predictive marker for endocrinotherapy and chemotherapy resistance in HER2-/HR+ breast cancer through the regulation of the AR, GLI3 and GATA2 transcriptional network

Hongyan Qian et al. Aging (Albany NY). .

Abstract

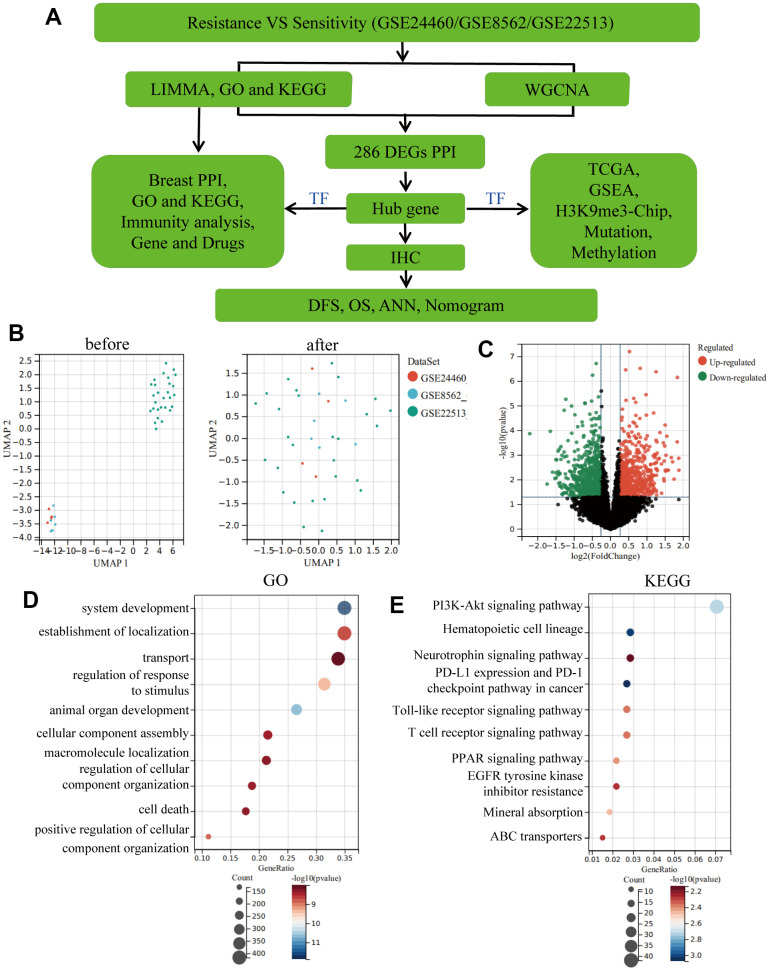
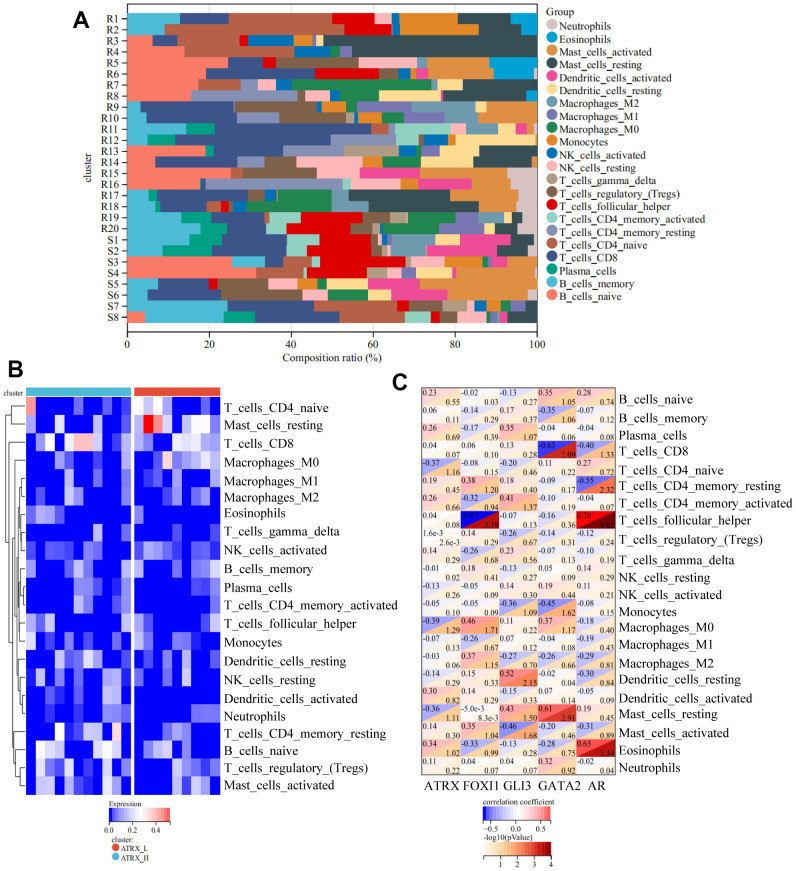
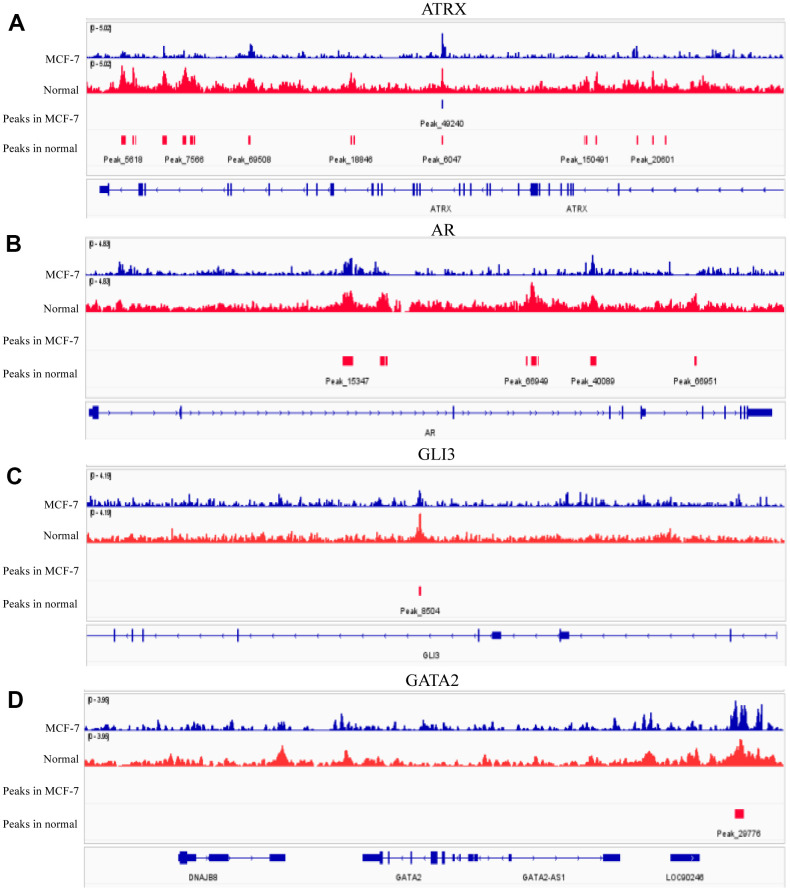
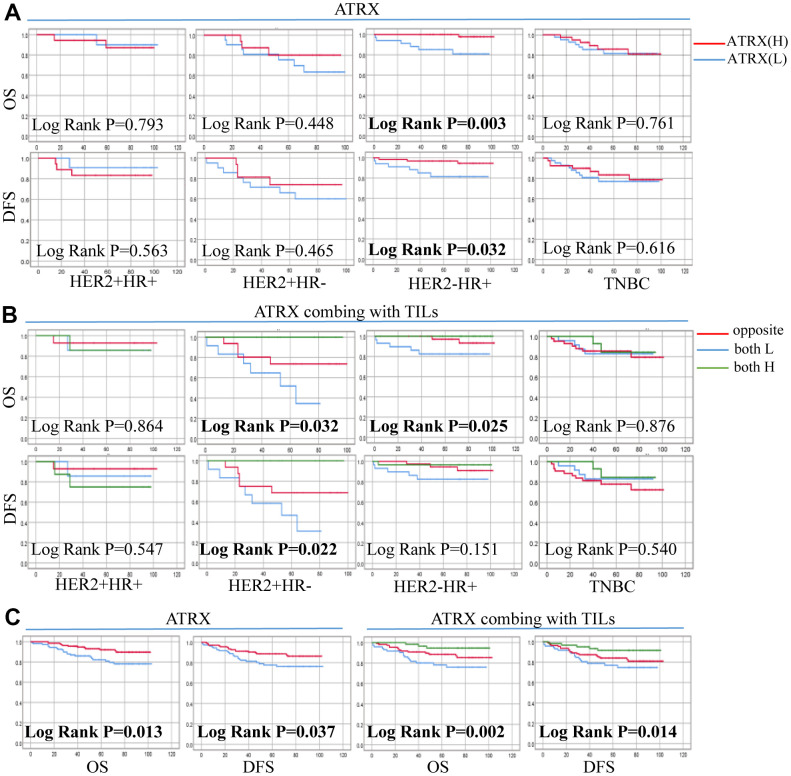
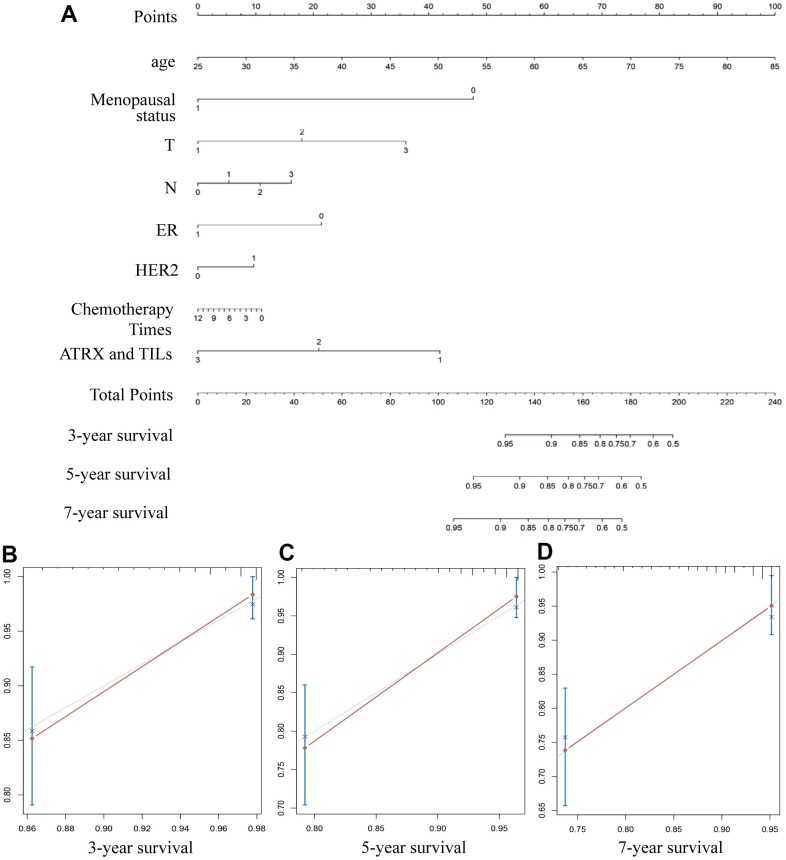
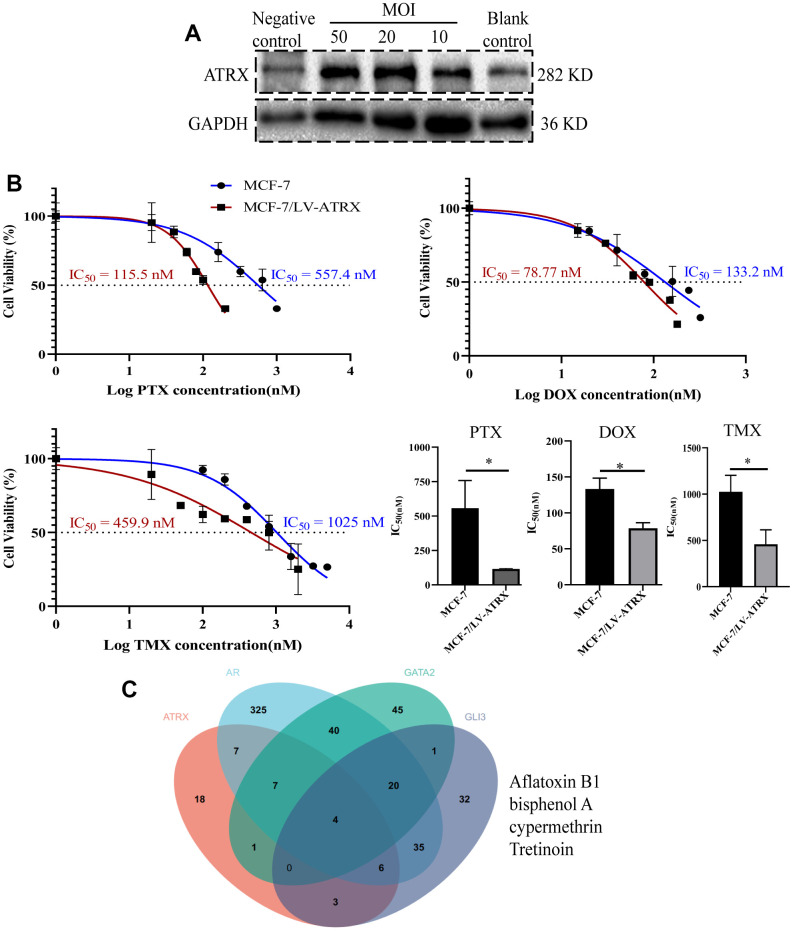
Drug resistance in breast cancer (BC) is a clinical challenge. Exploring the mechanism and identifying a precise predictive biomarker for the drug resistance in BC is critical. Three first-line drug (paclitaxel, doxorubicin and tamoxifen) resistance datasets in BC from GEO were merged to obtain 1,461 differentially expressed genes for weighted correlation network analysis, resulting in identifying ATRX as the hub gene. ATRX is a chromatin remodelling protein, therefore, ATRX-associated transcription factors were explored, thereby identifying the network of AR, GLI3 and GATA2. GO and KEGG analyses revealed immunity, transcriptional regulation and endocrinotherapy/chemotherapy resistance were enriched. Moreover, CIBERSORT revealed immunity regulation was inhibited in the resistance group. ssGSEA showed a significantly lower immune status in the ATRX-Low group compared to the ATRX-High group. Furthermore, the peaks of H3K9me3 ChIP-seq on the four genes were higher in normal tissues than in BC tissues. Notably, the frequency of ATRX mutation was higher than BRCA in BC. Moreover, depressed ATRX revealed worse overall survival and disease-free survival in the human epidermal growth factor receptor 2 (HER2)-/hormone receptor (HR)+ BC. Additionally, depressed ATRX predicted poor results for patients who underwent endocrinotherapy or chemotherapy in the HER2-/HR+ BC subgroup. A nomogram based on ATRX, TILs and ER exhibited a significantly accurate survival prediction ability. Importantly, overexpression of ATRX significantly inhibited the IC50 of the three first-line drugs on MCF-7 cell. Thus, ATRX is an efficient predictive biomarker for endocrinotherapy and chemotherapy resistance in HER2-/HR+ BC and acts by suppressing the AR, GLI3 and GATA2 transcriptional network.

Keywords: ATRX; biomarker; breast cancer; drug resistance; transcription factor.


Conflict of interest statement

CONFLICTS OF INTEREST: We declare that all authors have no conflicts of interest.

Figures

Figure 1
Figure 1
Eliminating batch effect between different sequencing platforms. (A) Workflow of this study. (B) Eliminating the batch effect of GSE24460, GSE862 and GSE22513, and combing the three datasets into a singular dataset, named GSE1. (C) Volcano plots of DEGs in GSE1. (D) TOP10 BP enrichment analysis of DEGs in GSE1. (E) KEGG enrichment of the TOP10 terms in GSE1.
Figure 2
Figure 2
WGCNA. (A) A Scale-free fit index as a function of soft-thresholding power. (B) The mean connectivity is a function of soft-thresholding powers. (C) Highly interconnected groups of genes were clustered and modules are represented by distinct colours in the horizontal bar. (D) Heatmap showed the correlations of module eigengenes with clinical traits. The numbers in each cell represent the correlation coefficients and P-value between clinical trait and module eigengenes.
Figure 3
Figure 3
Screening of hub gene. (A) Network Analyst Database for breast mammary tissue PPI analysis on 286 DEGs, which were filtered by Degree ≥ 15. (B) Venn diagram reveals the hub genes. (C) Venn diagram detected 36 common DEGs of ATRX-associated, TFs and DEGs in GSE1. (D) The name of the 36 common DEGs. (E) STRING and Cytoscape analysis of the common DEGs. (F) Logistic regression analysis of genes related to drug resistance.
Figure 4
Figure 4
Potential role of the hub gene and associated TFs. (A) The expression of the five important genes in GSE1. (B) Network Analyst Database for PPI analysis on the five genes. (C) GO and KEGG analysis of the four genes using the Network Analyst Database.
Figure 5
Figure 5
Immune analyses for GSE22513. (A) CIBERSORT analysis for 22 immunity cells. (B) ssGSEA revealed the difference in the 22 immunity cells between the ATRX-High and ATRX-Low groups. (C) Relationship between the five genes and immunity cells.
Figure 6
Figure 6
Relationship between ATRX and target genes in GSE1. The relationship between ATRX and the target genes of AR (A), GATA2 (B) and GLI3 (C). (D) GSEA analysis of AR’s target genes.
Figure 7
Figure 7
H3K9me3 ChIP-seq for normal breast epithelium tissue and MCF-7 in ENCODE. The signal intensities and peaks of H3K9me3 on ATRX (A), AR (B), GLI3 (C) and GATA2 (D) in normal breast epithelium tissues and 10 MCF-7 cells.
Figure 8
Figure 8
ATRX and TILs on the TMA of BC. Representative images for ATRX low (A) and ATRX high (B) in the samples. Representative images for TILs low (C) and TILs high (D) in the samples. The images of (A, C) came from the same sample, while the ones of (B, D) came from another sample. (E) Statistical analysis of ATRX expression. (F) Univariate analysis screened risk factors for OS in patients with BC.
Figure 9
Figure 9
Correlation between ATRX expression, TILs level and survival outcomes in patients with on the TMA. (A) Correlation between ATRX and OS, DFS in the four BC subtypes. (B) Correlation between ATRX combined with TILs and OS, DFS in the four BC subtypes. (C) Correlation between ATRX (or ATRX combining with TILs) and OS, DFS in patients with BC. ATRX(H): ATRX-High expression group, ATRX(L): ATRX-Low expression group, Opposite: the group with ATRX expression tendency opposited to TILs, both H: both ATRX- and TILs-High group, both L: both ATRX- and TILs-Low group.
Figure 10
Figure 10
Correlation between ATRX expression, TILs level and survival outcomes of patients with HER2-/HR+ BC on the TMA. (A) Correlation between ATRX and OS, DFS in patients with HER2-/HR+ BC who received endocrinotherapy or did not receive endocrinotherapy. (B) Correlation between ATRX and OS, DFS in patients with HER2-/HR+ BC who received chemotherapy or did not receive chemotherapy. (C) Correlation between ATRX combined with TILs and OS, DFS in patients with HER2-/HR+ BC who received endocrinotherapy or did not receive endocrinotherapy. (D) Correlation between ATRX combined with TILs and OS, DFS in patients with HER2-/HR+ BC who received chemotherapy or did not receive chemotherapy. ATRX(H): ATRX-High expression group, ATRX(L): ATRX-Low expression group, Opposite: the group with ATRX expression tendency opposited to TILs, both H: both ATRX- and TILs-High group, both L: both ATRX- and TILs-Low group.
Figure 11
Figure 11
Constructing a nomogram for prognosis prediction. (A) The predicted 3-, 5- and 7-year survival rates of patients with BC are based on the prognostic nomogram. (BD) C-index showed the concordances between predicted and observed 3-, 5- and 7-year survival rates based on the nomogram after bias corrections.
Figure 12
Figure 12
Drug sensitivity analysis and drug prediction. (A) Western blot showed the expression of ATRX when lentivirus was transfected in different concentrations (MOI=10, 20, 50) in MCF-7 cell. Lentivirus without ATRX was served as negative control, and that without lentivirus vector was served as blank control. (B) IC50 of PTX, DOX and TMX (for 48 h) was detected on MCF-7 cell and MCF-7 cell with overexpression of ATRX. The experiment was repeated three times. (C) Venn diagram detected the predicted drugs in CTDbase, which can promote ATRX and also inhibit AR, GLI3 and GATA2.

Similar articles

References

    1. Xia C, Dong X, Li H, Cao M, Sun D, He S, Yang F, Yan X, Zhang S, Li N, Chen W. Cancer statistics in China and United States, 2022: profiles, trends, and determinants. Chin Med J (Engl). 2022; 135:584–90. 10.1097/CM9.0000000000002108 - DOI - PMC - PubMed
    1. Dodson A, Parry S, Ibrahim M, Bartlett JM, Pinder S, Dowsett M, Miller K. Breast cancer biomarkers in clinical testing: analysis of a UK national external quality assessment scheme for immunocytochemistry and in situ hybridisation database containing results from 199 300 patients. J Pathol Clin Res. 2018; 4:262–73. 10.1002/cjp2.112 - DOI - PMC - PubMed
    1. Reid S, Haddad D, Tezak A, Weidner A, Wang X, Mautz B, Moore J, Cadiz S, Zhu Y, Zheng W, Mayer IA, Shu XO, Pal T. Impact of molecular subtype and race on HR+, HER2- breast cancer survival. Breast Cancer Res Treat. 2021; 189:845–52. 10.1007/s10549-021-06342-0 - DOI - PMC - PubMed
    1. Takeshita T, Yan L, Asaoka M, Rashid O, Takabe K. Late recurrence of breast cancer is associated with pro-cancerous immune microenvironment in the primary tumor. Sci Rep. 2019; 9:16942. 10.1038/s41598-019-53482-x - DOI - PMC - PubMed
    1. González-Conde M, Yañez-Gómez C, López-López R, Costa C. Liquid Biopsy: A New Tool for Overcoming CDKi Resistance Mechanisms in Luminal Metastatic Breast Cancer. J Pers Med. 2021; 11:407. 10.3390/jpm11050407 - DOI - PMC - PubMed

Publication types

MeSH terms