

FOXM1/KIF20A axis promotes clear cell renal cell carcinoma progression via regulating EMT signaling and affects immunotherapy response
- PMID: 38125441
- PMCID: PMC10730723
- DOI: 10.1016/j.heliyon.2023.e22734
FOXM1/KIF20A axis promotes clear cell renal cell carcinoma progression via regulating EMT signaling and affects immunotherapy response
Abstract
Background: The correlation between FOXM1 and KIF20A has not been revealed in clear cell renal cell carcinoma (ccRCC).
Methods: Public data was downloaded from The Cancer Genome Atlas (TCGA) database. R software was utilized for the execution of bioinformatic analysis. The expression levels of specific molecules (mRNA and protein) were detected using real-time quantitative PCR (qRT-PCR) and Western blot assays. The capacity of cell growth was assessed by employing CCK8 and colony formation assay. Cell invasion and migration ability were assessed using transwell assay.
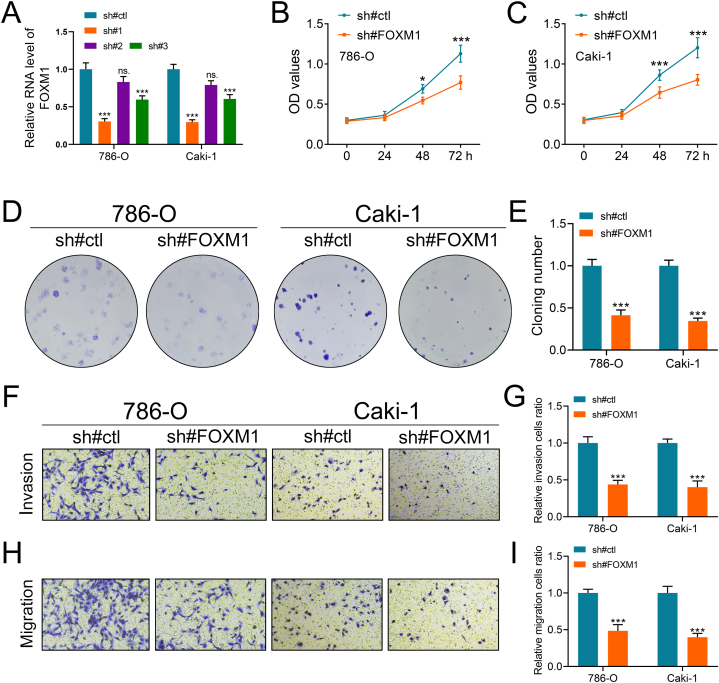
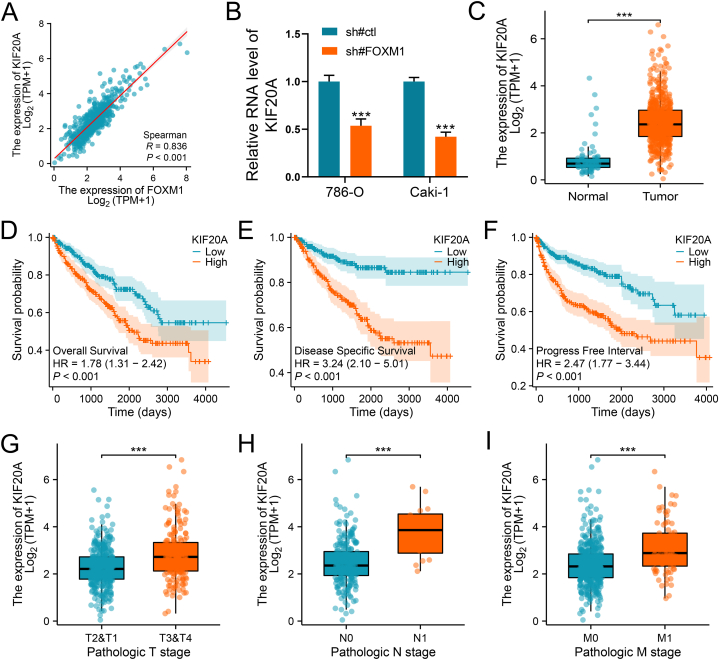
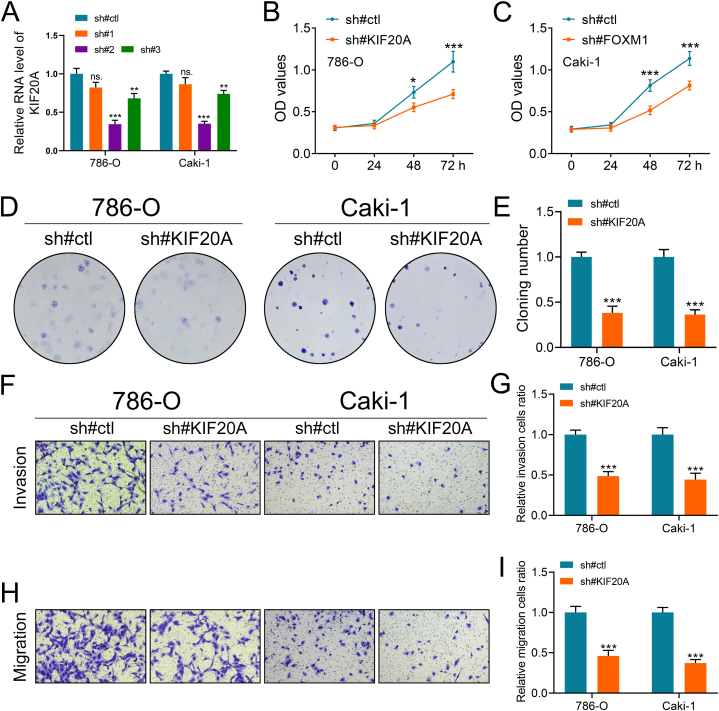
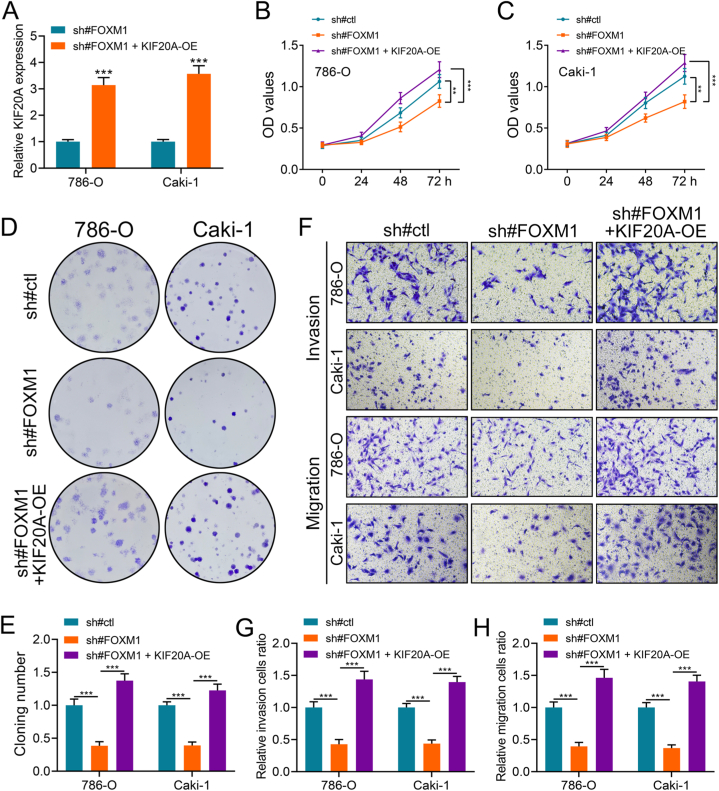
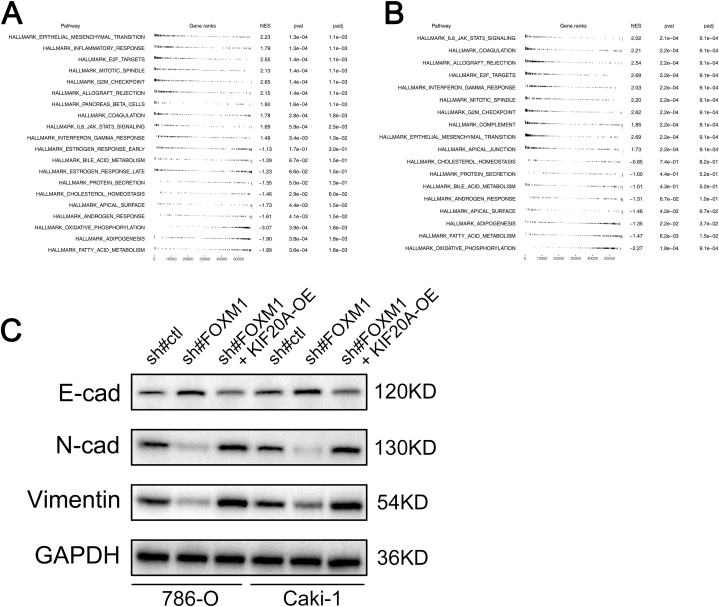
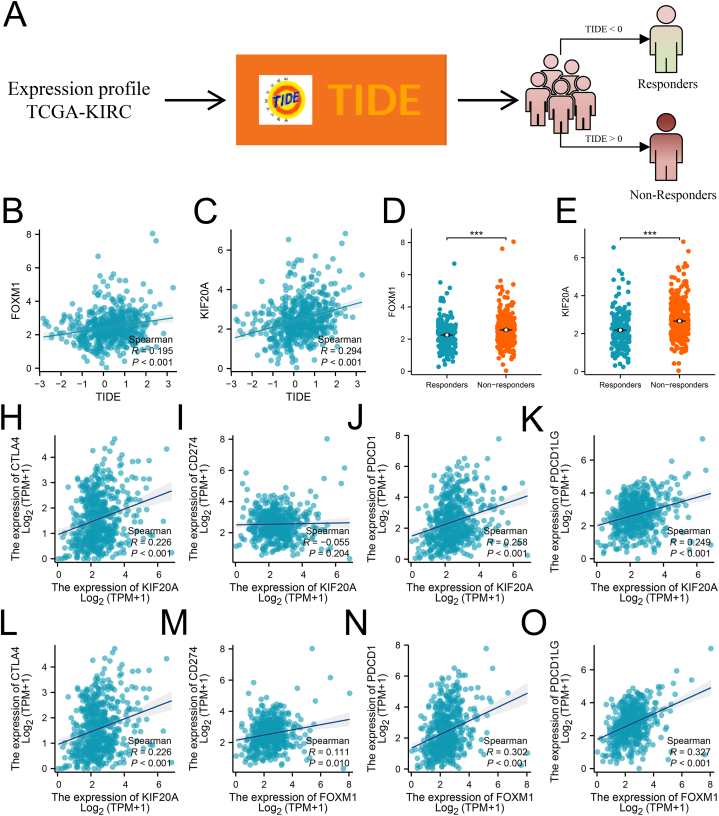
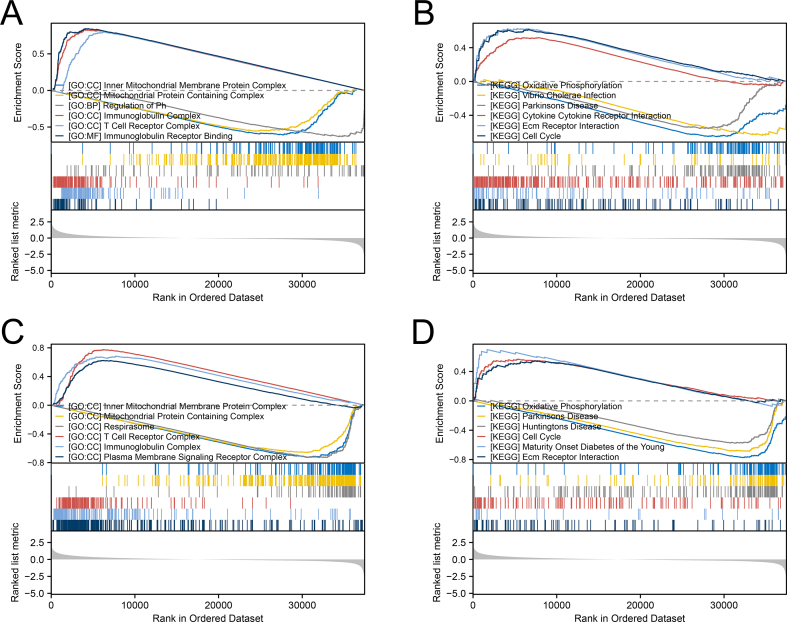
Results: In our study, we illustrated the association between FOXM1 and KIF20A. Our results indicated that both FOXM1 and KIF20A were associated with poor prognosis and clinical performance. The malignant characteristics of ccRCC cells can be significantly suppressed by inhibiting FOXM1 and KIF20A, as demonstrated by in vitro experiments. Moreover, we found that FOXM1 can upregulate KIF20A. Then, EMT signaling was identified as the underlying pathway FOXM1 and KIF20A are involved. WB results indicated that FOXM1/KIF20A axis can activate EMT signaling. Moreover, we noticed that FOXM1 and KIF20A can affect the immunotherapy response and immune microenvironment of ccRCC patients.
Conclusions: Our results identified the role of the FOXM1/KIF20A axis in ccRCC progression and immunotherapy, making it the underlying target for ccRCC.
Keywords: EMT; FOXM; Immunotherapy; KIF20A; ccRCC.
© 2023 The Authors.
Conflict of interest statement
The authors declare that they have no known competing financial interests or personal relationships that could have appeared to influence the work reported in this paper.
Figures


Similar articles
-
Advancing Cancer Therapy: The Role of KIF20A as a Target for Inhibitor Development and Immunotherapy.Cancers (Basel). 2024 Aug 24;16(17):2958. doi: 10.3390/cancers16172958. Cancers (Basel). 2024. PMID: 39272816 Free PMC article. Review.
-
FOXM1 modulates docetaxel resistance in prostate cancer by regulating KIF20A.Cancer Cell Int. 2020 Nov 10;20(1):545. doi: 10.1186/s12935-020-01631-y. Cancer Cell Int. 2020. PMID: 33292277 Free PMC article.
-
Inhibition of KIF20A by transcription factor IRF6 affects the progression of renal clear cell carcinoma.Cancer Cell Int. 2021 May 3;21(1):246. doi: 10.1186/s12935-021-01879-y. Cancer Cell Int. 2021. PMID: 33941190 Free PMC article.
-
Upregulation of KIF20A promotes tumor proliferation and invasion in renal clear cell carcinoma and is associated with adverse clinical outcome.Aging (Albany NY). 2020 Nov 24;12(24):25878-25894. doi: 10.18632/aging.202153. Epub 2020 Nov 24. Aging (Albany NY). 2020. PMID: 33232285 Free PMC article.
-
Downregulation of CLDN7 due to promoter hypermethylation is associated with human clear cell renal cell carcinoma progression and poor prognosis.J Exp Clin Cancer Res. 2018 Nov 14;37(1):276. doi: 10.1186/s13046-018-0924-y. J Exp Clin Cancer Res. 2018. PMID: 30428910 Free PMC article.
Cited by
-
Advancing Cancer Therapy: The Role of KIF20A as a Target for Inhibitor Development and Immunotherapy.Cancers (Basel). 2024 Aug 24;16(17):2958. doi: 10.3390/cancers16172958. Cancers (Basel). 2024. PMID: 39272816 Free PMC article. Review.
-
Overexpression of cyclin F/CCNF as an independent prognostic factor for poor survival in clear cell renal cell carcinoma.Sci Rep. 2024 Apr 23;14(1):9280. doi: 10.1038/s41598-024-59437-1. Sci Rep. 2024. PMID: 38654021 Free PMC article.
References
-
- Makhov P., Joshi S., Ghatalia P., Kutikov A., Uzzo R.G., Kolenko V.M. Resistance to systemic therapies in clear cell renal cell carcinoma: mechanisms and management strategies. Mol. Cancer Therapeut. 2018 Jul;17(7):1355–1364. PubMed PMID: 29967214. Pubmed Central PMCID: PMC6034114. Epub 2018/07/04. eng. - PMC - PubMed
-
- Atkins M.B., Tannir N.M. Current and emerging therapies for first-line treatment of metastatic clear cell renal cell carcinoma. Cancer Treat Rev. 2018 Nov;70:127–137. PubMed PMID: 30173085. Epub 2018/09/03. eng. - PubMed
-
- Kim H., Shim B.Y., Lee S.J., Lee J.Y., Lee H.J., Kim I.H. Loss of von hippel-lindau (VHL) tumor suppressor gene function: VHL-HIF pathway and advances in treatments for metastatic renal cell carcinoma (RCC) Int. J. Mol. Sci. 2021 Sep 10;(18):22. PubMed PMID: 34575959. Pubmed Central PMCID: PMC8470481. Epub 2021/09/29. eng. - PMC - PubMed
LinkOut - more resources
Full Text Sources
Miscellaneous
