

This is a preprint.
Experimental structures of antibody/MHC-I complexes reveal details of epitopes overlooked by computational prediction
- PMID: 38106040
- PMCID: PMC10723347
- DOI: 10.1101/2023.12.01.569627
Experimental structures of antibody/MHC-I complexes reveal details of epitopes overlooked by computational prediction
Update in
-
Experimental Structures of Antibody/MHC-I Complexes Reveal Details of Epitopes Overlooked by Computational Prediction.J Immunol. 2024 Apr 15;212(8):1366-1380. doi: 10.4049/jimmunol.2300839. J Immunol. 2024. PMID: 38456672 Free PMC article.
Abstract
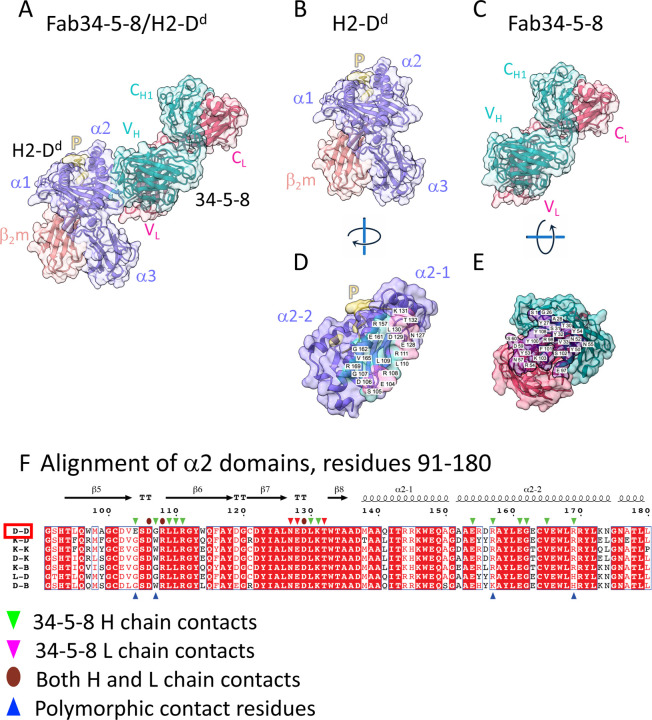
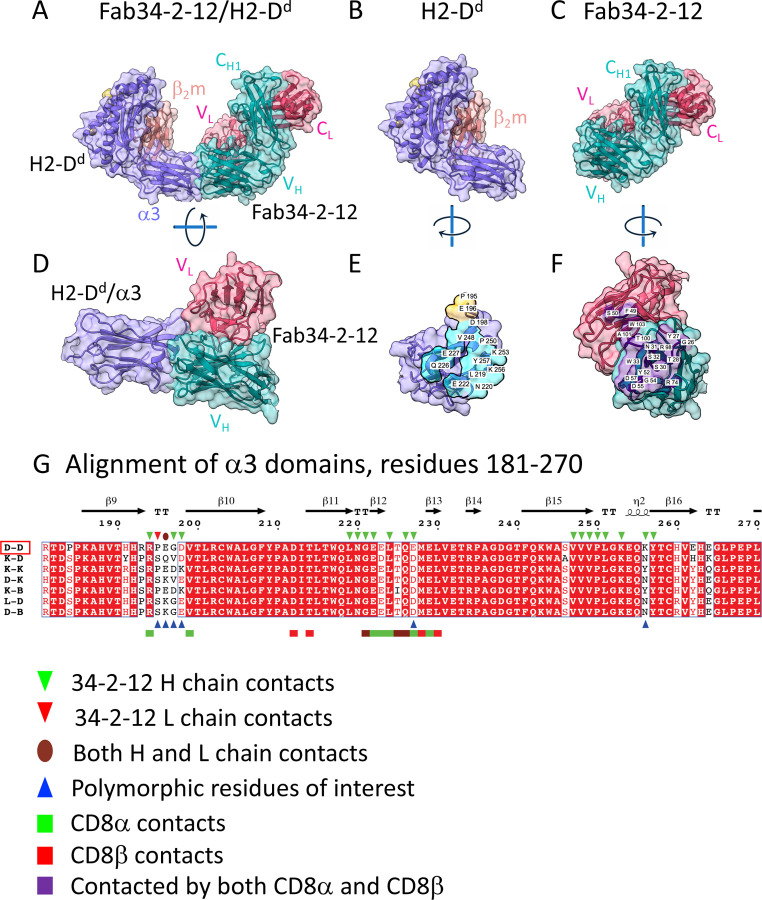
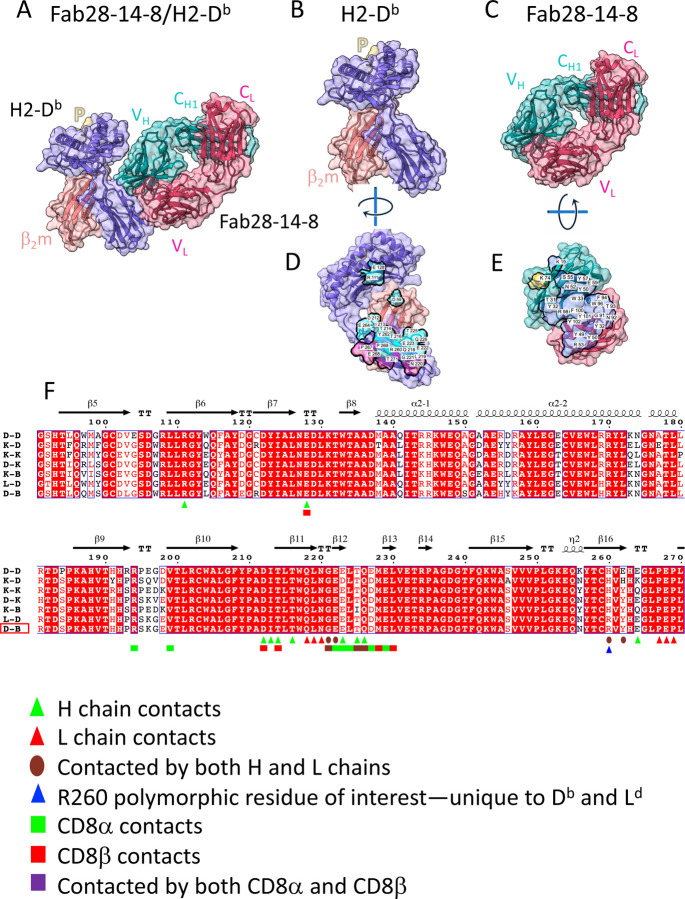
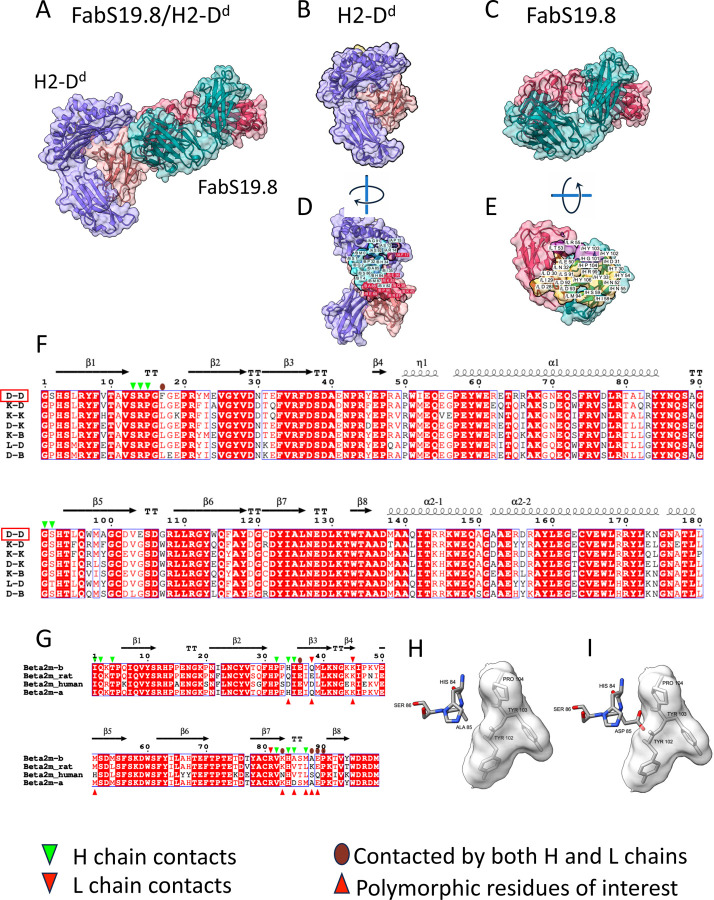
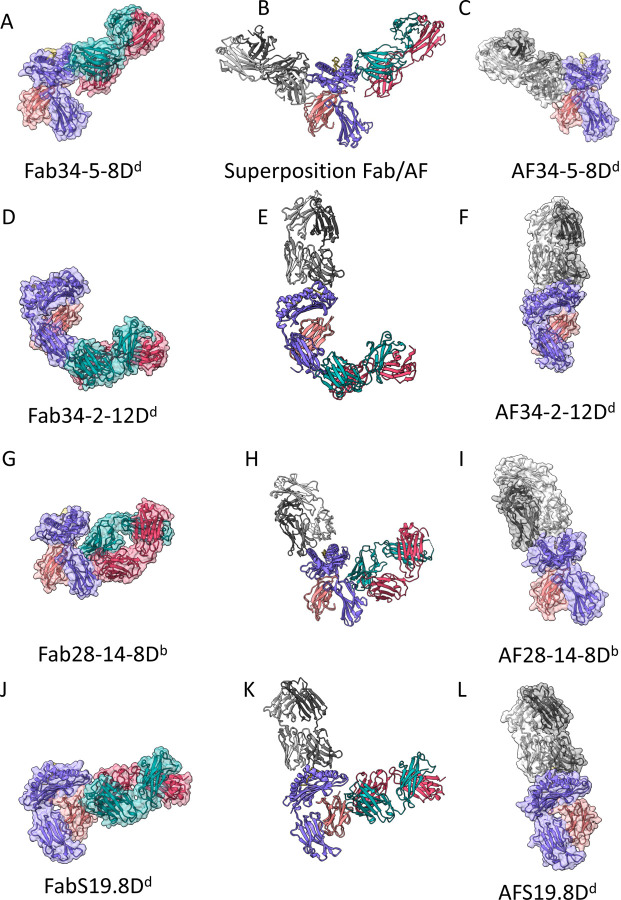
Monoclonal antibodies (mAb) to major histocompatibility complex class I (MHC-I) molecules have proved to be crucial reagents for tissue typing and fundamental studies of immune recognition. To augment our understanding of epitopic sites seen by a set of anti-MHC-I mAb, we determined X-ray crystal structures of four complexes of anti-MHC-I antigen-binding fragments (Fab) bound to peptide/MHC-I/β2m (pMHC-I). An anti-H2-Dd mAb, two anti-MHC-I α3 domain mAb, and an anti-β2-microglobulin (β2m) mAb bind pMHC-I at sites consistent with earlier mutational and functional experiments, and the structures explain allelomorph specificity. Comparison of the experimentally determined structures with computationally derived models using AlphaFold Multimer (AF-M) showed that although predictions of the individual pMHC-I heterodimers were quite acceptable, the computational models failed to properly identify the docking sites of the mAb on pMHC-I. The experimental and predicted structures provide insight into strengths and weaknesses of purely computational approaches and suggest areas that merit additional attention.
Conflict of interest statement
Authors declare that they have no competing interests.
Figures
Similar articles
-
Experimental Structures of Antibody/MHC-I Complexes Reveal Details of Epitopes Overlooked by Computational Prediction.J Immunol. 2024 Apr 15;212(8):1366-1380. doi: 10.4049/jimmunol.2300839. J Immunol. 2024. PMID: 38456672 Free PMC article.
-
Structural Comparison Between MHC Classes I and II; in Evolution, a Class-II-Like Molecule Probably Came First.Front Immunol. 2021 Jun 14;12:621153. doi: 10.3389/fimmu.2021.621153. eCollection 2021. Front Immunol. 2021. PMID: 34194421 Free PMC article.
-
The T-Cell Receptor Can Bind to the Peptide-Bound Major Histocompatibility Complex and Uncomplexed β2-Microglobulin through Distinct Binding Sites.Biochemistry. 2017 Aug 1;56(30):3945-3961. doi: 10.1021/acs.biochem.7b00385. Epub 2017 Jul 19. Biochemistry. 2017. PMID: 28671821
-
Structural Prediction of Peptide-MHC Binding Modes.Methods Mol Biol. 2022;2405:245-282. doi: 10.1007/978-1-0716-1855-4_13. Methods Mol Biol. 2022. PMID: 35298818 Review.
-
Chaperone function in antigen presentation by MHC class I molecules-tapasin in the PLC and TAPBPR beyond.Front Immunol. 2023 Jun 15;14:1179846. doi: 10.3389/fimmu.2023.1179846. eCollection 2023. Front Immunol. 2023. PMID: 37398669 Free PMC article. Review.
References
-
- Kohler G., Milstein C., Continuous cultures of fused cells secreting antibody of predefined specificity. Nature 256, 495–497 (1975). - PubMed
-
- Diamond B. A., Yelton D. E., Scharff M. D., Monoclonal antibodies. A new technique for producing serologic reagents. N Engl J Med 304, 1344–1349 (1981). - PubMed
-
- Scharff M. D., Roberts S., Thammana P., Monoclonal antibodies. J Infect Dis 143, 346–351 (1981). - PubMed
-
- Hammerling G. J. et al., Monoclonal antibodies against murine cell surface antigens: anti-H-2, anti-Ia and anti-T cell antibodies. Curr Top Microbiol Immunol 81, 100–106 (1978). - PubMed
-
- Lemke H., Hammerling G. J., Hammerling U., Fine specificity analysis with monoclonal antibodies of antigens controlled by the major histocompatibility complex and by the Qa/TL region in mice. Immunol Rev 47, 175–206 (1979). - PubMed
Publication types
Grants and funding
LinkOut - more resources
Full Text Sources
Research Materials
Miscellaneous