. 2024 Feb:69:102993.
doi: 10.1016/j.redox.2023.102993. Epub 2023 Dec 12.

M6A demethylase ALKBH5 regulates FOXO1 mRNA stability and chemoresistance in triple-negative breast cancer

Affiliations

M6A demethylase ALKBH5 regulates FOXO1 mRNA stability and chemoresistance in triple-negative breast cancer

Xi Liu et al. Redox Biol. 2024 Feb.

Abstract

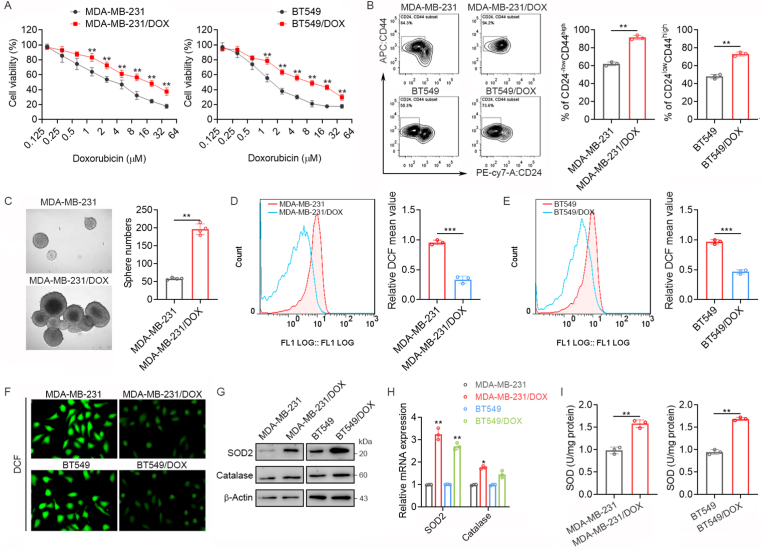
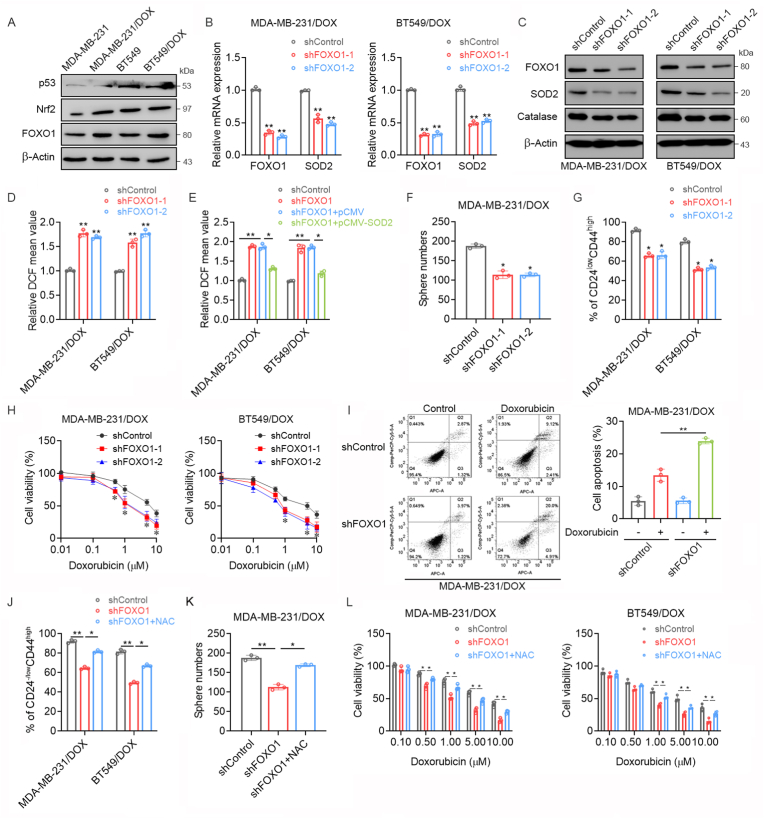
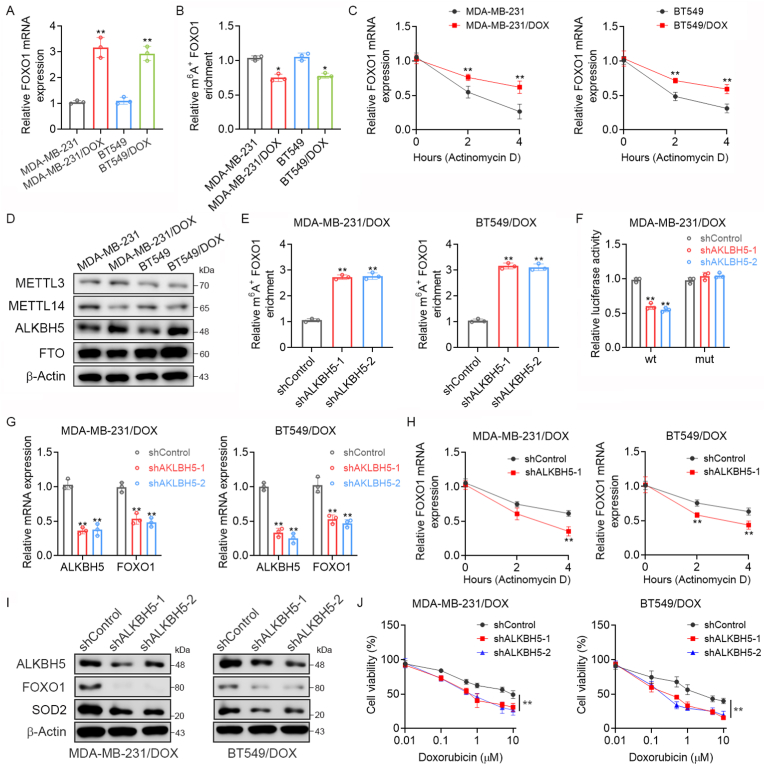
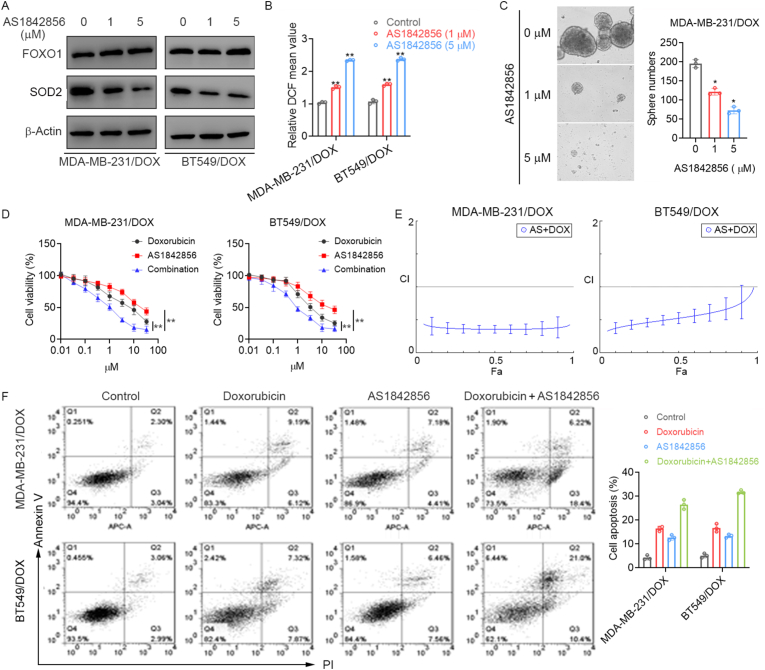
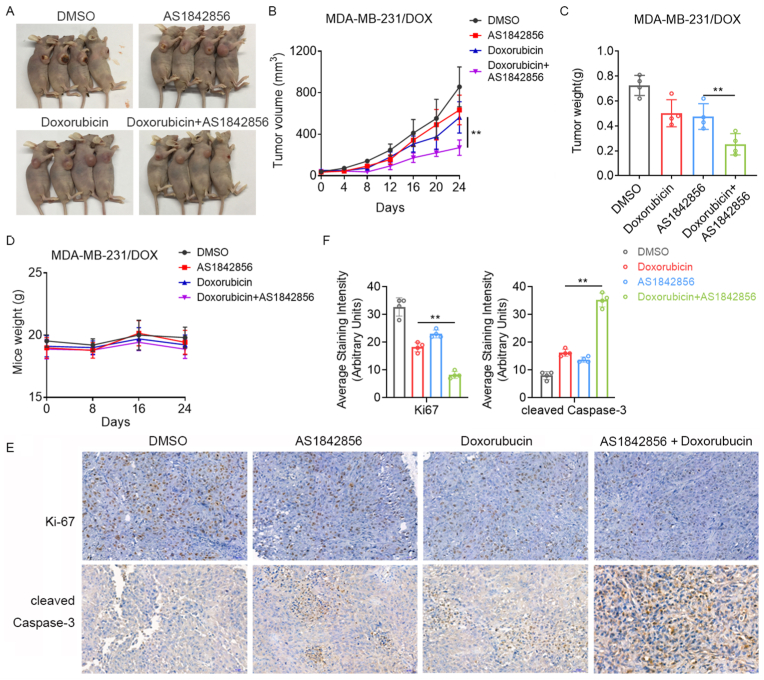
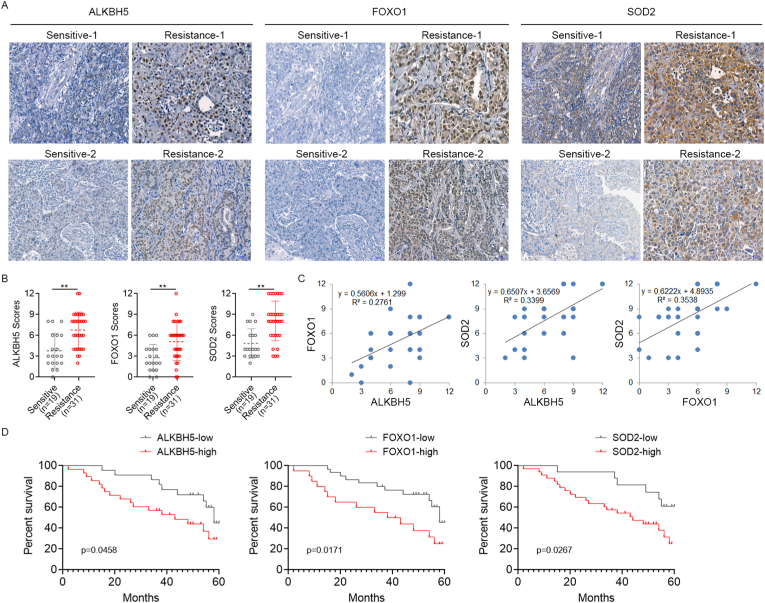
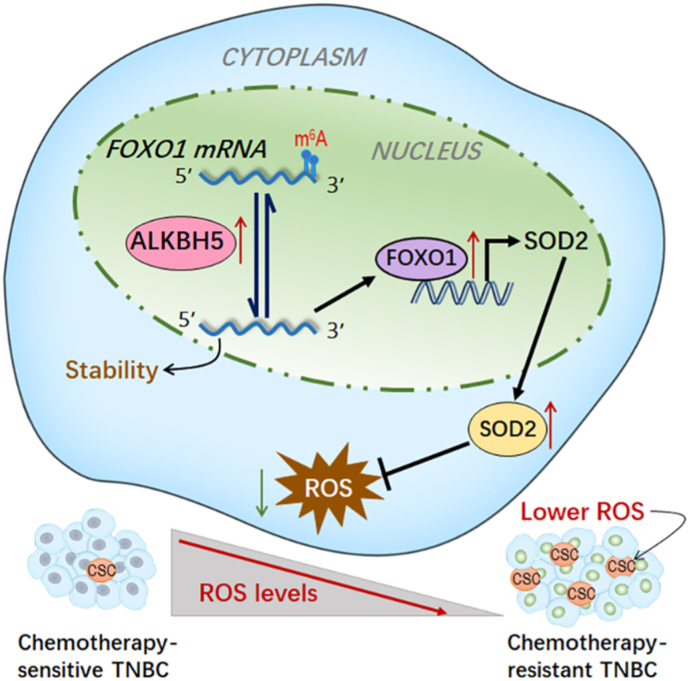
Resistance to chemotherapy is the main reason for treatment failure and poor prognosis in patients with triple-negative breast cancer (TNBC). Although the association of RNA N6-methyladenosine (m6A) modifications with therapy resistance is noticed, its role in the development of therapeutic resistance in TNBC is not well documented. This study aimed to investigate the potential mechanisms underlying reactive oxygen species (ROS) regulation in doxorubicin (DOX)-resistant TNBC. Here, we found that DOX-resistant TNBC cells displayed low ROS levels because of increased expression of superoxide dismutase (SOD2), thus maintaining cancer stem cells (CSCs) characteristics and DOX resistance. FOXO1 is a master regulator that reduces cellular ROS in DOX-resistant TNBC cells, and knockdown of FOXO1 significantly increased ROS levels by inhibiting SOD2 expression. Moreover, the m6A demethylase ALKBH5 promoted m6A demethylation of FOXO1 mRNA and increased FOXO1 mRNA stability in DOX-resistant TNBC cells. The analysis of clinical samples revealed that the increased expression levels of ALKBH5, FOXO1, and SOD2 were significantly positively correlated with chemoresistance and poor prognosis in patients with TNBC. To our knowledge, this is the first study to highlight that ALKBH5-mediated FOXO1 mRNA demethylation contributes to CSCs characteristics and DOX resistance in TNBC cells. Furthermore, pharmacological targeting of FOXO1 profoundly restored the response of DOX-resistant TNBC cells, both in vitro and in vivo. In conclusion, we demonstrated a critical function of ALKBH5-mediated m6A demethylation of FOXO1 mRNA in restoring redox balance, which in turn promoting CSCs characteristics and DOX resistance in TNBC, and suggested that targeting the ALKBH5/FOXO1 axis has therapeutic potential for patients with TNBC refractory to chemotherapy.

Keywords: ALKBH5; Chemoresistance; FOXO1; Reactive oxygen species; Triple-negative breast cancer.


Conflict of interest statement

Declaration of Competing Interest The authors declare no competing interests.

Figures

Fig. 1
Fig. 1
Chemotherapy-Resistant Triple-Negative Breast Cancer (TNBC) displayed low reactive oxygen species (ROS) levels. (A) MDA-MB-231, MDA-MB-231/DOX, BT549, and BT549/DOX cells were treated with doxorubicin (DOX) at the indicated concentrations for 72 h, and cell viability was evaluated using MTS assays. (B) The percentages of CD44+/CD24-/LOW cells in MDA-MB-231, MDA-MB-231/DOX, BT549, and BT549/DOX cells were measured by flow cytometry. (C) Self-renewal of CSCs in MDA-MB-231, and MDA-MB-231/DOX cells as measured by mammosphere formation assay. (D–E) ROS levels were analyzed using flow cytometry after exposing oxidation sensitive fluorescent probe (CM-H2DCFDA) in MDA-MB-231/DOX and MDA-MB-231 cells (D), BT549/DOX and BT549 cells (E). (F) Immunofluorescence was performed to analyze ROS levels in MDA-MB-231, MDA-MB-231/DOX, BT549, and BT549/DOX cells. (G–H) The expression levels of SOD2 and catalase in MDA-MB-231, BT549, MDA-MB-231/DOX, and BT549/DOX cells were determined using Western blot (G) and qRT-PCR (H), respectively. (I) The activities of SOD2 in MDA-MB-231/DOX and BT549/DOX cells were evaluated. Each point represents the mean ± standard deviation (SD). *p < 0.05, **p < 0.01, ***p < 0.001.
Fig. 2
Fig. 2
FOXO1 is required for redox homeostasis in chemotherapy-resistant TNBC. (A) The expressions of p53, Nrf2, and FOXO1 in MDA-MB-231, BT549, MDA-MB-231/DOX, and BT549/DOX cells were determined using Western blot analysis. (B–C) MDA-MB-231/DOX and BT549/DOX cells were transfected with FOXO1 short hairpin RNA (shRNA) or control shRNA, the expressions of SOD2 and FOXO1 were determined using qRT-PCR (B) and Western blot (C). (D) MDA-MB-231/DOX and BT549/DOX cells were transfected with FOXO1 shRNA or control shRNA, the ROS levels were analyzed using flow cytometry. (E) MDA-MB-231/DOX and BT549/DOX cells were co-transfected with FOXO1 shRNA or control shRNA and pCMV or pCMV-SOD2, the ROS levels were analyzed using flow cytometry. (F) MDA-MB-231/DOX cells were transfected with FOXO1 shRNA or control shRNA, self-renewal of CSCs was measured by a mammosphere formation assay. (G) MDA-MB-231/DOX and BT549/DOX cells were transfected with FOXO1 shRNA or control shRNA, the percentages of CD44+/CD24-/low cells were measured by flow cytometry. (H) MDA-MB-231/DOX and BT549/DOX cells transfected with FOXO1 shRNA or control shRNA were treated with DOX at the indicated concentrations for 72h; cell viability was evaluated using the MTS assay. (I) MDA-MB-231/DOX cells transfected with FOXO1 shRNA or control shRNA were treated with 2 μM DOX for 48 h; cells were then stained with Annexin V-APC and propidium iodide. Cell apoptosis was analyzed using flow cytometry. (J) MDA-MB-231/DOX and BT549/DOX cells transfected with FOXO1 shRNA were pretreated with 5 mM NAC for 24 h, the percentages of CD44+/CD24-/low cells were measured by flow cytometry. (K) MDA-MB-231/DOX transfected with FOXO1 shRNA were pretreated with 5 mM NAC for 24 h, self-renewal of CSCs was measured by a mammosphere formation assay. (L) MDA-MB-231/DOX and BT549/DOX cells transfected with FOXO1 shRNA were pretreated with 5 mM NAC for 24h, and then treated with DOX at indicated concentrations for 72h, cell viability was evaluated by MTS assays. Each point represents the mean ± SD. *p < 0.05, **p < 0.01.
Fig. 3
Fig. 3
ALKBH5 increased FOXO1 mRNA stability in chemotherapy-resistant TNBC. (A) The expression levels of FOXO1 mRNA in MDA-MB-231, BT549, MDA-MB-231/DOX, and BT549/DOX cells were determined using qRT-PCR. (B) M6A immunoprecipitation (MeRIP)-qPCR assays were performed to determine the change of FOXO1 mRNA with m6A methylation in MDA-MB-231, MDA-MB-231/DOX, BT549, and BT549/DOX cells. (C) MDA-MB-231, BT549, MDA-MB-231/DOX, and BT549/DOX cells were treated with actinomycin D (2 μg/mL) at the indicated time points; the mRNA levels of FOXO1 were determined using qRT-PCR. (D) The expression of m6A modification-related protein METTL3, METTL14, ALKBH5, and FTO in MDA-MB-231, MDA-MB-231/DOX, BT549, and BT549/DOX cells were determined using Western blot. (E) MDA-MB-231/DOX and BT549/DOX cells were stably transfected with ALKBH5 shRNA or control shRNA, the m6A modifications of FOXO1 mRNA were measured by MeRIP-qPCR. (F) MDA-MB-231/DOX cells were co-transfected with ALKBH5 shRNA or control shRNA and wild-type (WT) or mutant (Mt) pmirGLO-FOXO1-3′-UTR reporter for 24 h, the relative luciferase activity was measured. (G) MDA-MB-231/DOX and BT549/DOX cells were transfected with ALKBH5 shRNA or control shRNA, the expression levels of ALKBH5 and FOXO1 were determined using qRT-PCR. (H) MDA-MB-231/DOX and BT549/DOX cells were transfected with ALKBH5 shRNA or control shRNA followed by treatment with actinomycin D (2 μg/mL) at the indicated time points; the mRNA levels of FOXO1 were determined using qRT-PCR. (I) MDA-MB-231/DOX and BT549/DOX cells were transfected with ALKBH5 shRNA or control shRNA, the expression levels of ALKBH5, FOXO1, and SOD2 were determined using Western blot. (J) MDA-MB-231/DOX and BT549/DOX cells transfected with ALKBH5 shRNA or control shRNA were treated with DOX at the indicated concentrations for 72 h, cell viability was evaluated using the MTS assay. Each point represents the mean ± SD. *p < 0.05, **p < 0.01.
Fig. 4
Fig. 4
Inhibition of FOXO1 abrogates chemoresistance in TNBC in vitro. (A) MDA-MB-231/DOX and BT549/DOX cells were treated with FOXO1 inhibitor AS1842856 at indicated concentrations for 48 h, the expression levels of FOXO1 and SOD2 were determined using Western blot. (B) MDA-MB-231/DOX and BT549/DOX cells were treated with FOXO1 inhibitor AS1842856 at indicated concentrations for 24 h, the ROS levels were analyzed using flow cytometry. (C) MDA-MB-231/DOX and BT549/DOX cells were treated with FOXO1 inhibitor AS1842856 at indicated concentrations, self-renewal of CSCs was measured by mammosphere formation assay. (D) MDA-MB-231/DOX and BT549/DOX cells were treated with DOX, AS1842856, or their combinations at the indicated concentrations for 72 h, cell viability was evaluated using MTS assays. (E) The combination index (CI) curves were calculated using the Calcusyn software, according to the Chou–Talalay equation. (F) MDA-MB-231/DOX and BT549/DOX cells were treated with 2 μM DOX in combination with 5 μM AS1842856 for 48 h, cells were then stained with Annexin V-APC and propidium iodide. Cell apoptosis was analyzed using flow cytometry. Each point represents the mean ± SD. *p < 0.05, **p < 0.01.
Fig. 5
Fig. 5
Inhibition of FOXO1 abrogates chemoresistance in TNBC in vivo. (A–C) 5 × 106 MDA-MB-231/DOX cells were injected into nude mice and palpable tumors were allowed to develop for 7 days. Mice were randomly divided into four groups (n = 4) and treated with vehicle control (0.01 % dimethylsulfoxide in phosphate buffered saline), DOX (5 mg/kg/day, intraperitoneal (i.p.)), AS1842856 (20 mg/kg/day, i. p.) or a combination of DOX and AS1842856 every alternate day. (A–B) The tumor size was measured at indicated time intervals and calculated. (C) Measurement of tumor weights. (D) Body weight of the experimental mice during treatment. (E–F) Tumor tissues were fixed, sectioned, and placed on slides. Tumor specimens were subjected to immunohistochemical (IHC) staining for Ki-67 and cleaved caspase-3 (E), Quantification of IHC staining were analyzed by ImageJ and ImageJ plugin IHC profiler (F). Each point represents the mean ± SD. **p < 0.01.
Fig. 6
Fig. 6
The clinical significance of ALKBH5/FOXO1/SOD2 axis in chemoresistance of TNBC. (A) Representative images of ALKBH5, FOXO1, and SOD2 staining using IHC analysis in TNBC specimens. (B) IHC staining scores for ALKBH5, FOXO1, and SOD2 in chemotherapy-sensitive and chemotherapy-resistant TNBC specimens. (C) Correlation between the expression of ALKBH5, FOXO1, and SOD2 in TNBC tissues. (D) Kaplan–Meier analysis of relapse-free survival in patients with TNBC in relation to the expression of ALKBH5, FOXO1, and SOD2. Each point represents the mean ± SD. **p < 0.01.
Fig. 7
Fig. 7
Proposed model of the mechanism underlying the ALKBH5/FOXO1/SOD2 in maintaining low ROS levels and chemoresistance of TNBC.

Similar articles

Cited by

References

    1. Onkar S.S., Carleton N.M., Lucas P.C., Bruno T.C., Lee A.V., Vignali D.A.A., et al. The great immune escape: understanding the divergent immune response in breast cancer subtypes. Cancer Discov. 2023;13:23–40. - PMC - PubMed
    1. Nolan E., Lindeman G.J., Visvader J.E. Deciphering breast cancer: from biology to the clinic. Cell. 2023;186:1708–1728. - PubMed
    1. Yin L., Duan J.J., Bian X.W., Yu S.C. Triple-negative breast cancer molecular subtyping and treatment progress. Breast Cancer Res. 2020;22:61. - PMC - PubMed
    1. Won K.A., Spruck C. Triple-negative breast cancer therapy: current and future perspectives. Int. J. Oncol. 2020;57:1245–1261. (Review) - PMC - PubMed
    1. Metzger O., Bozovic-Spasojevic I., Cardoso F. Treatment of metastatic breast cancer: an overview. EJHP Pract. 2011;17:20–23.

MeSH terms