Validation of potential RNA biomarkers for prostate cancer diagnosis and monitoring in plasma and urinary extracellular vesicles
- PMID: 38099195
- PMCID: PMC10720733
- DOI: 10.3389/fmolb.2023.1279854
Validation of potential RNA biomarkers for prostate cancer diagnosis and monitoring in plasma and urinary extracellular vesicles
Abstract
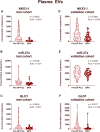
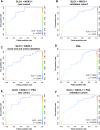
Introduction: Prostate cancer (PCa), one of the most prevalent malignancies affecting men worldwide, presents significant challenges in terms of early detection, risk stratification, and active surveillance. In recent years, liquid biopsies have emerged as a promising non-invasive approach to complement or even replace traditional tissue biopsies. Extracellular vesicles (EVs), nanosized membranous structures released by various cells into body fluids, have gained substantial attention as a source of cancer biomarkers due to their ability to encapsulate and transport a wide range of biological molecules, including RNA. In this study, we aimed to validate 15 potential RNA biomarkers, identified in a previous EV RNA sequencing study, using droplet digital PCR. Methods: The candidate biomarkers were tested in plasma and urinary EVs collected before and after radical prostatectomy from 30 PCa patients and their diagnostic potential was evaluated in a test cohort consisting of 20 benign prostate hyperplasia (BPH) and 20 PCa patients' plasma and urinary EVs. Next, the results were validated in an independent cohort of plasma EVs from 31 PCa and 31 BPH patients. Results: We found that the levels of NKX3-1 (p = 0.0008) in plasma EVs, and tRF-Phe-GAA-3b (p < 0.0001) tRF-Lys-CTT-5c (p < 0.0327), piR-28004 (p = 0.0081) and miR-375-3p (p < 0.0001) in urinary EVs significantly decreased after radical prostatectomy suggesting that the main tissue source of these RNAs is prostate and/or PCa. Two mRNA biomarkers-GLO1 and NKX3-1 showed promising diagnostic potential in distinguishing between PCa and BPH with AUC of 0.68 and 0.82, respectively, in the test cohort and AUC of 0.73 and 0.65, respectively, in the validation cohort, when tested in plasma EVs. Combining these markers in a biomarker model yielded AUC of 0.85 and 0.71 in the test and validation cohorts, respectively. Although the PSA levels in the blood could not distinguish PCa from BPH in our cohort, adding PSA to the mRNA biomarker model increased AUC from 0.71 to 0.76. Conclusion: This study identified two novel EV-enclosed RNA biomarkers-NKX3-1 and GLO1-for the detection of PCa, and highlights the complementary nature of GLO1, NKX3-1 and PSA as combined biomarkers in liquid biopsies of PCa.
Keywords: RNA biomarkers; droplet digital PCR; extracellular vesicles; liquid biopsies; prostate cancer.
Copyright © 2023 Brokāne, Bajo-Santos, Zayakin, Belovs, Jansons, Lietuvietis, Martens-Uzunova, Jenster and Linē.
Conflict of interest statement
The authors declare that the research was conducted in the absence of any commercial or financial relationships that could be construed as a potential conflict of interest.
Figures


Similar articles
-
Plasma and urinary extracellular vesicles as a source of RNA biomarkers for prostate cancer in liquid biopsies.Front Mol Biosci. 2023 Feb 3;10:980433. doi: 10.3389/fmolb.2023.980433. eCollection 2023. Front Mol Biosci. 2023. PMID: 36818049 Free PMC article.
-
MiR-145 detection in urinary extracellular vesicles increase diagnostic efficiency of prostate cancer based on hydrostatic filtration dialysis method.Prostate. 2017 Jul;77(10):1167-1175. doi: 10.1002/pros.23376. Epub 2017 Jun 15. Prostate. 2017. PMID: 28617988
-
Urinary extracellular vesicle-derived miR-126-3p predicts lymph node invasion in patients with high-risk prostate cancer.Res Sq [Preprint]. 2024 Mar 29:rs.3.rs-4164213. doi: 10.21203/rs.3.rs-4164213/v1. Res Sq. 2024. Update in: Med Oncol. 2024 Jun 5;41(7):169. doi: 10.1007/s12032-024-02400-x. PMID: 38585988 Free PMC article. Updated. Preprint.
-
Extracellular vesicles: the next generation of biomarkers for liquid biopsy-based prostate cancer diagnosis.Theranostics. 2020 Jan 16;10(5):2309-2326. doi: 10.7150/thno.39486. eCollection 2020. Theranostics. 2020. PMID: 32089744 Free PMC article. Review.
-
Prostate cancer-derived extracellular vesicles metabolic biomarkers: Emerging roles for diagnosis and prognosis.J Control Release. 2024 Jul;371:126-145. doi: 10.1016/j.jconrel.2024.05.029. Epub 2024 May 24. J Control Release. 2024. PMID: 38768661 Review.
Cited by
-
Circulating serum exosomes i-tRF-AspGTC and tRF-1-SerCGA as diagnostic indicators for non-small cell lung cancer.Clin Transl Oncol. 2024 Aug;26(8):1988-1997. doi: 10.1007/s12094-024-03423-6. Epub 2024 Mar 19. Clin Transl Oncol. 2024. PMID: 38502292
-
Semen sEV tRF-Based Models Increase Non-Invasive Prediction Accuracy of Clinically Significant Prostate Cancer among Patients with Moderately Altered PSA Levels.Int J Mol Sci. 2024 Sep 20;25(18):10122. doi: 10.3390/ijms251810122. Int J Mol Sci. 2024. PMID: 39337607 Free PMC article.
-
Advancements in Biomarkers of Prostate Cancer: A Review.Technol Cancer Res Treat. 2024 Jan-Dec;23:15330338241290029. doi: 10.1177/15330338241290029. Technol Cancer Res Treat. 2024. PMID: 39440372 Free PMC article. Review.
References
-
- Baunacke M., Horn L.-C., Trettner S., Engel K. M. Y., Hemdan N. Y. A., Wiechmann V., et al. (2014). Exploring glyoxalase 1 expression in prostate cancer tissues: targeting the enzyme by ethyl pyruvate defangs some malignancy-associated properties. Prostate 74 (1), 48–60. 10.1002/pros.22728 - DOI - PubMed
-
- Blijdorp C. J., Tutakhel O. A. Z., Hartjes T. A., van den Bosch T. P. P., van Heugten M. H., Rigalli J. P., et al. (2021). Comparing approaches to normalize, quantify, and characterize urinary extracellular vesicles. J. Am. Soc. Nephrol. 32 (5), 1210–1226. 10.1681/ASN.2020081142 - DOI - PMC - PubMed
Grants and funding
LinkOut - more resources
Full Text Sources
Research Materials
Miscellaneous

