. 2023 Dec;624(7992):602-610.
doi: 10.1038/s41586-023-06842-7. Epub 2023 Dec 13.

The landscape of genomic structural variation in Indigenous Australians

Collaborators, Affiliations

The landscape of genomic structural variation in Indigenous Australians

Andre L M Reis et al. Nature. 2023 Dec.

Abstract

Indigenous Australians harbour rich and unique genomic diversity. However, Aboriginal and Torres Strait Islander ancestries are historically under-represented in genomics research and almost completely missing from reference datasets1-3. Addressing this representation gap is critical, both to advance our understanding of global human genomic diversity and as a prerequisite for ensuring equitable outcomes in genomic medicine. Here we apply population-scale whole-genome long-read sequencing4 to profile genomic structural variation across four remote Indigenous communities. We uncover an abundance of large insertion-deletion variants (20-49 bp; n = 136,797), structural variants (50 b-50 kb; n = 159,912) and regions of variable copy number (>50 kb; n = 156). The majority of variants are composed of tandem repeat or interspersed mobile element sequences (up to 90%) and have not been previously annotated (up to 62%). A large fraction of structural variants appear to be exclusive to Indigenous Australians (12% lower-bound estimate) and most of these are found in only a single community, underscoring the need for broad and deep sampling to achieve a comprehensive catalogue of genomic structural variation across the Australian continent. Finally, we explore short tandem repeats throughout the genome to characterize allelic diversity at 50 known disease loci5, uncover hundreds of novel repeat expansion sites within protein-coding genes, and identify unique patterns of diversity and constraint among short tandem repeat sequences. Our study sheds new light on the dimensions and dynamics of genomic structural variation within and beyond Australia.


Conflict of interest statement

This project receives partial in-kind support from Oxford Nanopore Technologies (ONT) under an ongoing collaboration agreement. A.L.M.R., J.M.H., H.G., H.R.P. and I.W.D. have previously received travel and accommodation expenses from ONT to speak at conferences. H.G. and I.W.D. have paid consultant roles with Sequin Pty Ltd. O.M.S. and A.W.H. hold equity in Seonix Pty Ltd. The authors declare no other competing interests.

Figures

Fig. 1
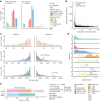
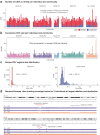
Fig. 1. Long-read sequencing in Indigenous Australian communities.
a, Study design and analysis workflow. DNA samples were collected from four Indigenous communities: Tiwi Islands (NCIG-P1), Galiwin’ku (P2), Titjikala (P3) and Yarrabah (P4), and from unrelated European individuals (non-NCIG). The map shows geographic locations, with population sizes and participant numbers underneath. ONT sequencing was performed and reads aligned to the T2T-chm13 genome. SVs were called for each individual, then joint calling was performed to generate a non-redundant set of SVs, genotyped for each individual. SVs were characterized by type, size and context and compared to existing SV datasets. SVs were compared between individuals and communities, with non-NCIG individuals as an outgroup. Short tandem repeat (STR) alleles were genotyped to assess variation. Chr, chromosome; DEL, deletions; INS, insertions; ME, mobile elements. b, Average genomic coverage as sequencing reads were filtered by a minimum read-length cut-off. Each line represents one individual. Pie charts show the proportion of male and female participants from each community. c, Percentage of genome with zero coverage for Illumina short-read and ONT long-read libraries from HG001 and HG002, aligned to either hg38 or T2T-chm13. d, Percentage of genome covered by alignments with low mapping quality (MAPQ < 5). e, Number of SVs detected.
Fig. 2
Fig. 2. Landscape of genomic structural variation.
a, Number of non-redundant variants identified across the cohort (n = 141). Large indels (left; 20–49 bp) and SVs (right; ≥50 bp) are shown separately and parsed by type: non-repetitive, tandem repeats (homopolymer (HOMO), STR and TR) and mobile elements (long terminal repeat (LTR), long interspersed nuclear elements (LINE), short interspersed nuclear element (SINE), retroposon and DNA/DNA transposon (DNA)). Light shades represent deletions and dark shades represent insertions. b, Frequency of non-redundant SVs relative to distance from the nearest telomere. c, Size distribution of insertions (positive values) and deletions (negative values), parsed by type (colour scheme as in a). Characteristic peaks for Alu elements (280 bp) and L1 elements (6 kb) are marked. d, Size distributions for each variant type. Mobile element SVs are classified as ‘complete’ if they encompass one or more complete annotated element or ‘fragment’ if they encompass only part of an annotated element. e, Number of non-redundant SVs found in a search performed against a combination of the gnomAD, deCODE and HGSVC (freeze 4) SV annotations. SVs were first lifted from T2T-chm13 to hg38. Some could not be lifted because they were deleted or partially deleted in hg38. SVs that could be lifted were categorized as ‘annotated’ or ‘unannotated’ on the basis of reciprocal overlap to any single annotated SV. High (>80%) and moderate (50–80%) overlaps were considered as annotated, whereas low (<50%; beige) and no overlap were considered as unannotated.
Fig. 3
Fig. 3. Distribution of SVs in Indigenous and non-Indigenous individuals.
a, Number of SVs identified in individuals from each group, parsed by type. Colour scheme as in b. b, Proportional representation of different types for SVs identified within a given number of individuals (degree of sharedness). SVs were labelled as private (1 individual), polymorphic (more than one individual and less than 50% of individuals), major (≥50%, but not all individuals) and shared (all individuals). c, Proportion of SVs in each individual that were found exclusively in NCIG individuals (NCIG-only), or exclusively in non-NCIG individuals (NCIG-absent), or across both (global). Colour scheme as in d. d, Proportional representation of NCIG-only, NCIG-absent and global SVs according to degree of sharedness.
Fig. 4
Fig. 4. Distribution of SVs between Indigenous communities.
a, PCOA representing the distance between individuals in the cohort based on their SV compositions. The percentage of variance is indicated in parentheses for each principal coordinate axis (PCOA1 and PCOA2). Individuals are coloured according to their group. b, Distribution of NCIG-only variants (Fig. 3) shared among the four NCIG communities. SVs were classified as private (n = 1 individual), community-specific (n > 1 individual in 1 community), widespread (n > 1 individual in more than 1 community) or shared (n > 1 individual in all 4 communities). c, Proportion of private, community-specific, widespread and shared NCIG-only variants among individuals, grouped by community. A total of n = 141 individuals (41 NCIG-P1, 32 NCIG-P2, 9 NCIG-P3, 39 NCIG-P4 and 20 non-NCIG individuals) were examined. The centre line shows the median, box edges delineate the interquartile range (IQR) and whiskers extend to 1.5× IQR from the hinge. d, SV discovery curve in which, starting with a single NCIG individual, the number of new non-redundant SVs is counted as new individuals are iteratively added. SVs shared among all previously added samples are shown as green portions of each bar.
Fig. 5
Fig. 5. Functional relevance of genomic structural variation.
a, Proportion of variant types identified within CDS exons, non-CDS regions of protein-coding genes (introns, UTRs and ±2 kb proximal regulatory regions) and intergenic regions, for large indels (left; 20–49 bp) and SVs (right; ≥50 bp). Variants are classified as: non-repetitive, STR, TR and mobile element (fragment or complete). b, Left, variant density in CDS and non-CDS regions of protein-coding genes in different LOEUF deciles, which quantify intolerance to loss-of-function variation (first decile corresponds to the highest constraint). b, Right, variant density in non-CDS parsed by variant type and normalized to their 10th decile. c, Sequence bar chart shows ATXN3 STR alleles, including 20 bp of upstream flanking sequence, genotyped for every individual (two alleles each). Dashed lines show STR size cut-offs for intermediate and fully pathogenic alleles. A single pathogenic allele was identified in an NCIG-P2 individual. All others are in the ‘normal’ range.
Fig. 6
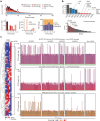
Fig. 6. Landscape of STR expansions.
a, Top, length distribution of all non-redundant TR and STR insertions (that is, expansions) detected across the cohort (n = 141), broken down by period size. Bottom left, number of non-redundant STR expansions in each period. Bottom centre, relative frequency of each period within CDS exons. Bottom right, proportional composition of each period based on genomic context. b, Frequency of every possible triplet (top) and pentanucleotide (bottom) motif among non-redundant STR expansions. Selected motifs known to cause different repeat disorders are highlighted. For triplet disorders, pathogenic motifs with gain-of-function mechanisms are shown in red, those with loss-of-function mechanisms are shown in blue. c, Left, normalized standard deviation (range 0–1) of allele sizes observed within each community group (matrix columns) for different STR sites (matrix rows). All expanded sites of period ≥3 bp within protein-coding genes, in which allelic composition was significantly different between groups are shown (one-way ANOVA, P < 0.05). Hierarchical clustering groups STR sites on the basis of patterns of variability between groups. c, Right, all STR alleles (two per individual) for three example sites showing distinct patterns of variation. BLOC1S2 (top) has an intronic STR with higher allelic diversity in NCIG versus non-NCIG individuals. AC012531 (middle) has lower allelic diversity in NCIG versus non-NCIG individuals. PRRC2B (bottom) shows community-specific patterns, with NCIG-P1 and NCIG-P4 exhibiting heterogeneity.
Extended Data Fig. 1
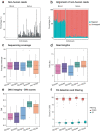
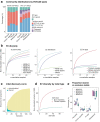
Extended Data Fig. 1. Genomic library characteristics across different groups.
(a) Barchart shows the proportion of non-human reads in sequencing libraries derived from blood or saliva samples. (b) Barchart shows the proportion of mapped (green) and unmapped (orange) non-human reads in sequencing libraries derived from blood or saliva samples. (c) Boxplot shows the average depth of coverage per individual grouped by their communities (NCIGP1 = pink, P2 = purple, P3 = blue, P4 = green & non-NCIG = orange). The horizontal dashed line indicates the average coverage across all libraries in the cohort. (d) Boxplot shows the N50 distribution of individual libraries in the different communities. The horizontal dashed line indicates the average N50 across all libraries in the cohort. (e) Boxplot shows the distribution of DNA Integrity Number (DIN), which indicates the level of fragmentation of a genomic DNA sample, for individual libraries across the different communities. (f) Boxplot shows the distribution of the number of high-quality (PASS=orange) and low-quality (q5=green) structural variants (SVs) per individual grouped by community after quality filtering (Quality ≥ 5). The horizontal dashed lines indicate the average number of high-quality (top) and low-quality (bottom) SVs across all libraries in the cohort. A total of n = 141 individuals (NCIGP1 = 41, NCIGP2 = 32, NCIGP3 = 9, NCIGP4 = 39 and non-NCIG = 20) were examined from independent sequencing experiments in figures c-f. In the boxplots, the middle line is the median, the box represents the interquartile range (IQR), the whiskers extend 1.5 times the IQR from the hinge, and any data points beyond the whiskers are shown individually.
Extended Data Fig. 2
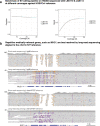
Extended Data Fig. 2. Structural variation detection performance and genomic alignments for HG002 samples.
(a) Line plots show precision and recall of SV calls detected with cuteSV for HG002 samples sequenced with LSK110/R9.4.1 or LSK114/R10.4.1 ONT chemistry and subsampled to different coverages compared against HGSVCv4 reference calls for HG002 (taken as a ‘truth set’). (b) Genome browser views show comparison of short-read and long-read alignments to either the hg38 or chm13-T2T reference genomes at MUC1, an example of a repetitive medically relevant gene. Both datasets are from the HG002 reference sample. The gene contains a large tandem repeat region that is best resolved by alignment of long-reads to chm13-T2T.
Extended Data Fig. 3
Extended Data Fig. 3. Copy number variation analysis across different groups.
(a) Bar chart shows the number of large CNVs (> 50 kb) identified in individuals from each group, broken down by type: deletion (red) and duplication (blue). (b) Bar chart shows the cumulative size of CNVs identified in individuals from each group. The horizontal dashed line indicates the average cumulative CNV size across the entire cohort. (c) Histograms show the size distribution of unique CNV regions (> 50 kb) containing deletions (red) and duplications (blue). The vertical dashed lines indicate the average size for deletions and duplications, respectively. (d) Genome browser views show coverage tracks for 2 individuals from NCIG-P2 (purple) and 1 non-NCIG individual (orange) across chromosomes 11 and 2 of chm13-T2T. In the first panel, the non-NCIG individual has the longest deletion identified, which is indicated by the blue segment and visible in the coverage track for that individual, but missing in the other 2 NCIG-P2 individuals. In the second panel, the 2 NCIG-P2 individuals have the largest duplication identified, also indicated by the blue segment and visible in the respective coverage tracks, but missing in the non-NCIG individual. Centromeric repeats are labeled and represented as red segments.
Extended Data Fig. 4
Extended Data Fig. 4. Genomic distribution and classification of structural variants.
(a) Line plots show LOESS curves of the number of large indels (> 20 & <50 bp) and structural variants (≥ 50 bp) per 500 Kb fixed window relative to the distance to the nearest telomere, parsed by variant type (non-repetitive = teal, short tandem repeat = red, tandem repeat = blue & mobile element = purple). (b) Dot plots show the number of structural variants per 500 Kb fixed window, relative to the distance of the window to the nearest telomere, for acrocentric and metacentric autosomes. The vertical dashed lines indicate a distance of 5 MB from the telomere. (c) Bar chart shows the proportion of SVs that could be lifted (green) or not (orange) from T2T-chm13 to hg38. (d) Bar chart shows the proportion of SVs classified according to reciprocal overlap as high (>80%; pink), moderate (50-80%; brown), low (<50%; beige) or no overlap (purple) in comparison to reference databases (gnomAD, deCODE & HGSVCv4; see Fig. 2e), parsed by SV type.
Extended Data Fig. 5
Extended Data Fig. 5. Distribution and sharedness of large indels and structural variants across the cohort.
(a) Bar chart shows the number of large indels (20-49 bp) identified in individuals from each group (NCIGP1, P2, P3, P4 & non-NCIG), broken down by type: non-repeat (teal) and tandem repeat (STR = red & TR = blue). (b) Bar plot shows the number of non-redundant structural variants identified within a given number of individuals in the cohort (degree of sharedness). Variants were classified as private (1 individual), polymorphic (> 2 & <50% of individuals), major (≥ 50% of individuals &
Extended Data Fig. 6
Extended Data Fig. 6. Population distribution and annotation of large indels and structural variants.
(a) Bar chart shows the proportion of large indels in each individual that were only found in NCIG individuals (NCIG-only = purple), only found in non-NCIG individuals (NCIG-absent = green) and found in both NCIG & non-NCIG individuals (Global = light blue). (b) Bar chart shows the proportion of NCIG-only, NCIG-absent and Global large indels (same colour scheme as Fig. 3a) for all the variants identified within a given number of individuals in the cohort (degree of sharedness). (c) Proportion of NCIG-only, NCIG-absent or Global SVs in each individual that were previously annotated in gnomAD, deCODE or HGSVCv4 SV catalogs (see Fig. 2e). Accompanying boxplot shows the distribution of ratios between the proportion of SVs ‘unannotated’ (high & moderate overlap) to the proportion of SVs ‘annotated’ (low and no overlap) against at least one of the databases. A total of n = 141 individuals (NCIG-only = 121, NCIG-absent = 20 and Global = all individuals) were examined from independent sequencing experiments in figure c. In the boxplot, the middle line is the median, the box represents the interquartile range (IQR), the whiskers extend 1.5 times the IQR from the hinge, and any data points beyond the whiskers are shown individually.
Extended Data Fig. 7
Extended Data Fig. 7. Distribution and diversity of genomic variation across different indigenous communities.
(a) Matrix shows pairwise FST calculated using a random set of 10,000 SV loci found among NCIG communities and the non-NCIG group. In the accompanying scale, the intensity of red increases with the FST values. (b) Upset plot shows the distribution of NCIG-only large indels (20-49 bp) shared among the four indigenous communities (NCIGP1, P2, P3 & P4). Variants were classified as private (n = 1 individual; blue), community-specific (n > 1 individual in 1 community; yellow), widespread (n > 1 individual in more than 1 community; red) or shared (n > 1 individual in all 4 communities; green) according to the number of communities in which they were identified. (c) Upset plot shows the distribution of NCIG SNVs shared among the four indigenous communities (NCIGP1, P2, P3 & P4). Community specific variants were highlighted in yellow. (d) Upset plot shows the comparison of NCIG SNVs against the Simon Genome Diversity Project (SGDP), gnomAD and dbSNP154. NCIG specific SNVs were highlighted in green.
Extended Data Fig. 8
Extended Data Fig. 8. Genomic variation distribution and sampling dynamics across the cohort.
(a) Proportion of different SV types for NCIG-only variants classified as private, community-specific, widespread or shared. Types are non-repetitive (teal), tandem repeat (STR = red & TR = blue) and mobile element (fragment = light purple & complete = dark purple). (b) Log regression models predicting the number of non-redundant SVs identified, given the number of individuals sampled. The models are broken down by community (left panel), by geographical distribution (centre panel) and SV type (NCIG individuals; right panel). (c) Bar chart shows a discovery curve, in which starting with a single NCIG individual, the number of new non-redundant large indels is counted by iteratively adding the unique calls from additional NCIG individuals. Indels shared among all previously added samples are shown as green portions of each bar. The growth rate of the nonredundant set declines as the number of samples increases. (d) Log regression model showing the predicted number of non-redundant large indels identified given the number of individuals sampled. The model was broken down by variant type (Non-repetitive = teal, Tandem repeats = red). (e) Proportion of private, community-specific, widespread & shared NCIG-only variants among individuals, grouped by community. A total of n = 141 individuals (NCIGP1 = 41, NCIGP2 = 32, NCIGP3 = 9, NCIGP4 = 39 and non-NCIG = 20) were examined from independent sequencing experiments in figure e. In the boxplot, the middle line is the median, the box represents the interquartile range (IQR), the whiskers extend 1.5 times the IQR from the hinge, and any data points beyond the whiskers are shown individually.
Extended Data Fig. 9
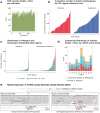
Extended Data Fig. 9. Genomic variation impact on protein-coding genes.
(a) Bar plot shows the number of variants per individual impacting CDS exons of protein-coding genes. The horizontal dashed line indicates the average number of variants in CDS regions across the entire cohort. (b) Bar plots show the cumulative number of whole-genes contained within CNV regions sorted by size in increasing order for deletions and duplications. (c) Bar plots show for each CNV region, the number of different individuals that had a CNV identified within that region and were either intergenic or intersected whole genes. Different CNV regions are classified as singleton (light purple;1 individual), polymorphic (green; > 2 & <50% of individuals) and major (pink; ≥ 50% of individuals &  1 individual in 1 community; yellow), widespread (n > 1 individual in more than 1 community; red) or shared (n > 1 individual in all 4 communities; green) according to the number of communities in which they were identified. (e) Genome browser view shows sequencing alignments to ATXN3. A ‘CAG’ STR expansion, known to cause Machado-Joseph Disease (MJD), was identified in one NCIG-P2 individual. ONT reads span the expansion (left panel; purple markers indicate insertions). Illumina short-reads do not span the expansion, and are soft-clipped (right panel).
Extended Data Fig. 10
Extended Data Fig. 10. Analysis of STR expansion characteristics and community-specific variability.
(a) Dot plots show the number of repeat units versus the relative size increase of STR expansions of different period sizes. The horizontal dashed line indicates the minimum relative size increase (0.5) and the vertical dashed line indicates the minimum number of repeat units (10) required for an STR expansion to be further genotyped across all individuals in the cohort. (b) Matrix shows the normalised standard deviation (range 0:1) of allele sizes within each community for all STR sites with expansions in one or more individuals, in which allelic composition between the groups was significantly different. Hierarchical clustering was performed to group the STR sites based on the different patterns of variability between communities.

Similar articles

Cited by

References

    1. 1000 Genomes Project Consortium. A global reference for human genetic variation. Nature. 2015;526:68–74. doi: 10.1038/nature15393. - DOI - PMC - PubMed
    1. Karczewski KJ, et al. The mutational constraint spectrum quantified from variation in 141,456 humans. Nature. 2020;581:434–443. doi: 10.1038/s41586-020-2308-7. - DOI - PMC - PubMed
    1. Liao W-W, et al. A draft human pangenome reference. Nature. 2023;617:312–324. doi: 10.1038/s41586-023-05896-x. - DOI - PMC - PubMed
    1. De Coster W, Weissensteiner MH, Sedlazeck FJ. Towards population-scale long-read sequencing. Nat. Rev. Genet. 2021;22:572–587. doi: 10.1038/s41576-021-00367-3. - DOI - PMC - PubMed
    1. Chintalaphani SR, Pineda SS, Deveson IW, Kumar KR. An update on the neurological short tandem repeat expansion disorders and the emergence of long-read sequencing diagnostics. Acta Neuropathol. Commun. 2021;9:98. doi: 10.1186/s40478-021-01201-x. - DOI - PMC - PubMed

MeSH terms

Supplementary concepts