. 2023 Dec 19;82(25):2350-2473.
doi: 10.1016/j.jacc.2023.11.007.

Global Burden of Cardiovascular Diseases and Risks, 1990-2022

Collaborators, Affiliations

Global Burden of Cardiovascular Diseases and Risks, 1990-2022

George A Mensah et al. J Am Coll Cardiol. .
No abstract available


Conflict of interest statement

Funding Support and Author Disclosures Funding was provided by the Bill and Melinda Gates Foundation, and the American College of Cardiology Foundation. The authors have reported that they have no relationships relevant to the contents of this paper to disclose. The contents and views expressed in this report are those of the authors and do not necessarily reflect the official views of the National Institutes of Health, the Department of Health and Human Services, the U.S. Government, or the affiliated institutions.

Figures

Figure 1
Figure 1
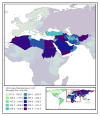
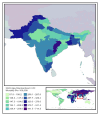
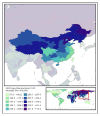
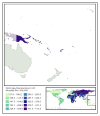
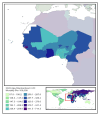
Global map of 2022 age-standardized cardiovascular disease mortality rate per 100,000 with quantile classification
Figure 2
Figure 2
Global cardiovascular disease mortality rate per 100,000 by age and sex in 1990 vs. 2022
Figure 3
Figure 3
Age-standardized cardiovascular disease mortality rate per 100,000 by country (circle) in 2022 by socio-demographic index (0-100), a composite indicator of fertility, income, and education. Global estimate indicated by a triangle, loess line in blue with shaded 95% uncertainty interval.
Figure 4
Figure 4
Age-standardized disability-adjusted life years (DALYs) per 100,000 in 2022 for (A) cardiovascular diseases by region and (B) burden attributable to selected risk factors, globally, compared to the theoretical minimum risk exposure level
Figure 5
Figure 5
Age-standardized mortality rate per 100,000 for cardiovascular diseases in 2022 by cause of death and region. Boxplot shows first quartile, median, and third quartile of mortality range.
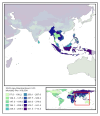
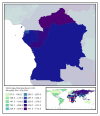
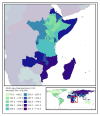
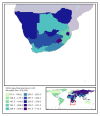
Figure 1
Figure 1
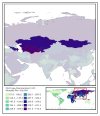
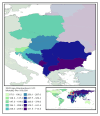
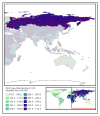
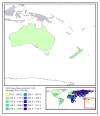
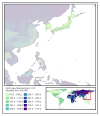
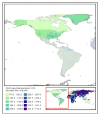
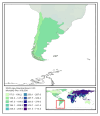
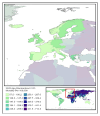
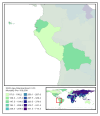
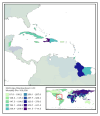
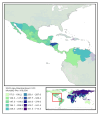
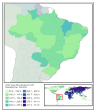
Regional map of 2022 age-standardized cardiovascular disease mortality rate per 100,000 with quantile classification
Figure 2
Figure 2
Regional cardiovascular disease mortality rate per 100,000 by age and sex in 1990 vs. 2022
Figure 3
Figure 3
Age-standardized cardiovascular disease mortality rate per 100,000 by country (circle) in 2022 by socio-demographic index (0-100), a composite indicator of fertility, income, and education. Focus region countries indicated by triangles, loess line in blue with shaded 95% uncertainty interval.
Figure 4
Figure 4
Age-standardized disability-adjusted life years (DALYs) per 100,000 in 2022 for (A) cardiovascular diseases by country and (B) burden attributable to selected risk factors, for the region, compared to the theoretical minimum risk exposure level
Figure 5
Figure 5
Age-standardized mortality rate per 100,000 for cardiovascular diseases in 2022 by cause of death and country. Boxplot shows first quartile, median, and third quartile of mortality range.
Figure 1
Figure 1
Global map of age–standardized cardiovascular disease mortality rate per 100,000 in 2022 with equal interval classification
Figure 2
Figure 2
Global cardiovascular disease estimates per 100,000 by measure with shaded 95% uncertainty interval, 1990-2022
Figure 3
Figure 3
Cardiovascular disease age-standardized disability-adjusted life years (DALYs) per 100,000 by Global Burden of Disease region and sex in 2022, 95% uncertainty interval indicated by black bar
Figure 4
Figure 4
Global cardiovascular disease age-specific estimates per 100,000 by sex in 2022, difference in sex estimates indicated by gray bar
Figure 1
Figure 1
Global map of age-standardized rheumatic heart disease mortality rate per 100,000 in 2022 with equal interval classification
Figure 2
Figure 2
Global rheumatic heart disease estimates per 100,000 by measure with shaded 95% uncertainty interval, 1990-2022
Figure 3
Figure 3
Rheumatic heart disease age-standardized disability-adjusted life years (DALYs) per 100,000 by Global Burden of Disease region and sex in 2022, 95% uncertainty interval indicated by black bar
Figure 4
Figure 4
Global rheumatic heart disease age-specific estimates per 100,000 by sex in 2022, difference in sex estimates indicated by gray bar
Figure 1
Figure 1
Global map of age-standardized ischemic heart disease mortality rate per 100,000 in 2022 with equal interval classification
Figure 2
Figure 2
Global ischemic heart disease estimates per 100,000 by measure with shaded 95% uncertainty interval, 1990-2022
Figure 3
Figure 3
Ischemic heart disease age-standardized disability-adjusted life years (DALYs) per 100,000 by Global Burden of Disease region and sex in 2022, 95% uncertainty interval indicated by black bar
Figure 4
Figure 4
Global ischemic heart disease age-specific estimates per 100,000 by sex in 2022, difference in sex estimates indicated by gray bar
Figure 1
Figure 1
Global map of age-standardized stroke mortality rate per 100,000 in 2022 with equal interval classification
Figure 2
Figure 2
Global stroke estimates per 100,000 by measure with shaded 95% uncertainty interval, 1990-2022
Figure 3
Figure 3
Stroke age-standardized disability-adjusted life years (DALYs) per 100,000 by Global Burden of Disease region and sex in 2022, 95% uncertainty interval indicated by black bar
Figure 4
Figure 4
Global stroke age-specific estimates per 100,000 by sex in 2022, difference in sex estimates indicated by gray bar
Figure 1
Figure 1
Global map of age-standardized ischemic stroke mortality rate per 100,000 in 2022 with equal interval classification
Figure 2
Figure 2
Global ischemic stroke estimates per 100,000 by measure with shaded 95% uncertainty interval, 1990-2022
Figure 3
Figure 3
Ischemic stroke age-standardized disability-adjusted life years (DALYs) per 100,000 by Global Burden of Disease region and sex in 2022, 95% uncertainty interval indicated by black bar
Figure 4
Figure 4
Global ischemic stroke age-specific estimates per 100,000 by sex in 2022, difference in sex estimates indicated by gray bar
Figure 1
Figure 1
Global map of age-standardized intracerebral hemorrhage mortality rate per 100,000 in 2022 with equal interval classification
Figure 2
Figure 2
Global intracerebral hemorrhage estimates per 100,000 by measure with shaded 95% uncertainty interval, 1990-2022
Figure 3
Figure 3
Intracerebral hemorrhage age-standardized disability-adjusted life years (DALYs) per 100,000 by Global Burden of Disease region and sex in 2022, 95% uncertainty interval indicated by black bar
Figure 4
Figure 4
Global intracerebral hemorrhage age-specific estimates per 100,000 by sex in 2022, difference in sex estimates indicated by gray bar
Figure 1
Figure 1
Global map of age-standardized subarachnoid hemorrhage mortality rate per 100,000 in 2022 with equal interval classification
Figure 2
Figure 2
Global subarachnoid hemorrhage estimates per 100,000 by measure with shaded 95% uncertainty interval, 1990-2022
Figure 3
Figure 3
Subarachnoid hemorrhage age-standardized disability-adjusted life years (DALYs) per 100,000 by Global Burden of Disease region and sex in 2022, 95% uncertainty interval indicated by black bar
Figure 4
Figure 4
Global subarachnoid hemorrhage age-specific estimates per 100,000 by sex in 2022, difference in sex estimates indicated by gray bar
Figure 1
Figure 1
Global map of age-standardized hypertensive heart disease mortality rate per 100,000 in 2022 with equal interval classification
Figure 2
Figure 2
Global hypertensive heart disease estimates per 100,000 by measure with shaded 95% uncertainty interval, 1990-2022
Figure 3
Figure 3
Hypertensive heart disease age-standardized disability-adjusted life years (DALYs) per 100,000 by Global Burden of Disease region and sex in 2022, 95% uncertainty interval indicated by black bar
Figure 4
Figure 4
Global hypertensive heart disease age-specific estimates per 100,000 by sex in 2022, difference in sex estimates indicated by gray bar
Figure 1
Figure 1
Global map of age-standardized non-rheumatic valvular heart disease mortality rate per 100,000 in 2022 with equal interval classification
Figure 2
Figure 2
Global non-rheumatic valvular heart disease estimates per 100,000 by measure with shaded 95% uncertainty interval, 1990-2022
Figure 3
Figure 3
Non-rheumatic valvular heart disease age-standardized disability-adjusted life years (DALYs) per 100,000 by Global Burden of Disease region and sex in 2022, 95% uncertainty interval indicated by black bar
Figure 4
Figure 4
Global non-rheumatic valvular heart disease age-specific estimates per 100,000 by sex in 2022, difference in sex estimates indicated by gray bar
Figure 1
Figure 1
Global map of age-standardized non-rheumatic calcific aortic valve disease mortality rate per 100,000 in 2022 with equal interval classification
Figure 2
Figure 2
Global non-rheumatic calcific aortic valve disease estimates per 100,000 by measure with shaded 95% uncertainty interval, 1990-2022
Figure 3
Figure 3
Non-rheumatic calcific aortic valve disease age-standardized disability-adjusted life years (DALYs) per 100,000 by Global Burden of Disease region and sex in 2022, 95% uncertainty interval indicated by black bar
Figure 4
Figure 4
Global non-rheumatic calcific aortic valve disease age-specific estimates per 100,000 by sex in 2022, difference in sex estimates indicated by gray bar
Figure 1
Figure 1
Global map of age-standardized non-rheumatic degenerative mitral valve disease mortality rate per 100,000 in 2022 with equal interval classification
Figure 2
Figure 2
Global non-rheumatic degenerative mitral valve disease estimates per 100,000 by measure with shaded 95% uncertainty interval, 1990-2022
Figure 3
Figure 3
Non-rheumatic degenerative mitral valve disease age-standardized disability-adjusted life years (DALYs) per 100,000 by Global Burden of Disease region and sex in 2022, 95% uncertainty interval indicated by black bar
Figure 4
Figure 4
Global non-rheumatic degenerative mitral valve disease age-specific estimates per 100,000 by sex in 2022, difference in sex estimates indicated by gray bar
Figure 1
Figure 1
Global map of age-standardized other non-rheumatic valve diseases mortality rate per 100,000 in 2022 with equal interval classification
Figure 2
Figure 2
Global other non-rheumatic valve diseases estimates per 100,000 by measure with shaded 95% uncertainty interval, 1990-2022
Figure 3
Figure 3
Other non-rheumatic valve diseases age-standardized disability-adjusted life years (DALYs) per 100,000 by Global Burden of Disease region and sex in 2022, 95% uncertainty interval indicated by black bar
Figure 4
Figure 4
Global other non-rheumatic valve diseases age-specific estimates per 100,000 by sex in 2022, difference in sex estimates indicated by gray bar
Figure 1
Figure 1
Global map of age-standardized cardiomyopathy and myocarditis mortality rate per 100,000 in 2022 with equal interval classification
Figure 2
Figure 2
Global cardiomyopathy and myocarditis estimates per 100,000 by measure with shaded 95% uncertainty interval, 1990-2022
Figure 3
Figure 3
Cardiomyopathy and myocarditis age-standardized disability-adjusted life years (DALYs) per 100,000 by Global Burden of Disease region and sex in 2022, 95% uncertainty interval indicated by black bar
Figure 4
Figure 4
Global cardiomyopathy and myocarditis age-specific estimates per 100,000 by sex in 2022, difference in sex estimates indicated by gray bar
Figure 1
Figure 1
Global map of age-standardized myocarditis mortality rate per 100,000 in 2022 with equal interval classification
Figure 2
Figure 2
Global myocarditis estimates per 100,000 by measure with shaded 95% uncertainty interval, 1990-2022
Figure 3
Figure 3
Myocarditis age-standardized disability-adjusted life years (DALYs) per 100,000 by Global Burden of Disease region and sex in 2022, 95% uncertainty interval indicated by black bar
Figure 4
Figure 4
Global myocarditis age-specific estimates per 100,000 by sex in 2022, difference in sex estimates indicated by gray bar
Figure 1
Figure 1
Global map of age-standardized alcoholic cardiomyopathy mortality rate per 100,000 in 2022 with equal interval classification
Figure 2
Figure 2
Global alcoholic cardiomyopathy estimates per 100,000 by measure with shaded 95% uncertainty interval, 1990-2022
Figure 3
Figure 3
Alcoholic cardiomyopathy age-standardized disability-adjusted life years (DALYs) per 100,000 by Global Burden of Disease region and sex in 2022, 95% uncertainty interval indicated by black bar
Figure 4
Figure 4
Global alcoholic cardiomyopathy age-specific estimates per 100,000 by sex in 2022, difference in sex estimates indicated by gray bar
Figure 1
Figure 1
Global map of age-standardized other cardiomyopathy mortality rate per 100,000 in 2022 with equal interval classification
Figure 2
Figure 2
Global other cardiomyopathy estimates per 100,000 by measure with shaded 95% uncertainty interval, 1990-2022
Figure 3
Figure 3
Other cardiomyopathy age-standardized disability-adjusted life years (DALYs) per 100,000 by Global Burden of Disease region and sex in 2022, 95% uncertainty interval indicated by black bar
Figure 4
Figure 4
Global other cardiomyopathy age-specific estimates per 100,000 by sex in 2022, difference in sex estimates indicated by gray bar
Figure 1
Figure 1
Global map of age-standardized pulmonary arterial hypertension mortality rate per 100,000 in 2022 with equal interval classification
Figure 2
Figure 2
Global pulmonary arterial hypertension estimates per 100,000 by measure with shaded 95% uncertainty interval, 1990-2022
Figure 3
Figure 3
Pulmonary arterial hypertension age-standardized disability-adjusted life years (DALYs) per 100,000 by Global Burden of Disease region and sex in 2022, 95% uncertainty interval indicated by black bar
Figure 4
Figure 4
Global pulmonary arterial hypertension age-specific estimates per 100,000 by sex in 2022, difference in sex estimates indicated by gray bar
Figure 1
Figure 1
Global map of age-standardized atrial fibrillation and flutter mortality rate per 100,000 in 2022 with equal interval classification
Figure 2
Figure 2
Global atrial fibrillation and flutter estimates per 100,000 by measure with shaded 95% uncertainty interval, 1990-2022
Figure 3
Figure 3
Atrial fibrillation and flutter age-standardized disability-adjusted life years (DALYs) per 100,000 by Global Burden of Disease region and sex in 2022, 95% uncertainty interval indicated by black bar
Figure 4
Figure 4
Global atrial fibrillation and flutter age-specific estimates per 100,000 by sex in 2022, difference in sex estimates indicated by gray bar
Figure 1
Figure 1
Global map of age-standardized aortic aneurysm mortality rate per 100,000 in 2022 with equal interval classification
Figure 2
Figure 2
Global aortic aneurysm estimates per 100,000 by measure with shaded 95% uncertainty interval, 1990-2022
Figure 3
Figure 3
Aortic aneurysm age-standardized disability-adjusted life years (DALYs) per 100,000 by Global Burden of Disease region and sex in 2022, 95% uncertainty interval indicated by black bar
Figure 4
Figure 4
Global aortic aneurysm age-specific estimates per 100,000 by sex in 2022, difference in sex estimates indicated by gray bar
Figure 1
Figure 1
Global map of age-standardized lower extremity peripheral arterial disease mortality rate per 100,000 in 2022 with equal interval classification
Figure 2
Figure 2
Global lower extremity peripheral arterial disease estimates per 100,000 by measure with shaded 95% uncertainty interval, 1990-2022
Figure 3
Figure 3
Lower extremity peripheral arterial disease age-standardized disability-adjusted life years (DALYs) per 100,000 by Global Burden of Disease region and sex in 2022, 95% uncertainty interval indicated by black bar
Figure 4
Figure 4
Global lower extremity peripheral arterial disease age-specific estimates per 100,000 by sex in 2022, difference in sex estimates indicated by gray bar
Figure 1
Figure 1
Global map of age-standardized endocarditis mortality rate per 100,000 in 2022 with equal interval classification
Figure 2
Figure 2
Global endocarditis estimates per 100,000 by measure with shaded 95% uncertainty interval, 1990-2022
Figure 3
Figure 3
Endocarditis age-standardized disability-adjusted life years (DALYs) per 100,000 by Global Burden of Disease region and sex in 2022, 95% uncertainty interval indicated by black bar
Figure 4
Figure 4
Global endocarditis age-specific estimates per 100,000 by sex in 2022, difference in sex estimates indicated by gray bar
Figure 1
Figure 1
Global map of age-standardized other cardiovascular and circulatory diseases mortality rate per 100,000 in 2022 with equal interval classification
Figure 2
Figure 2
Global other cardiovascular and circulatory diseases estimates per 100,000 by measure with shaded 95% uncertainty interval, 1990-2022
Figure 3
Figure 3
Other cardiovascular and circulatory diseases age-standardized disability-adjusted life years (DALYs) per 100,000 by Global Burden of Disease region and sex in 2022, 95% uncertainty interval indicated by black bar
Figure 4
Figure 4
Global other cardiovascular and circulatory diseases age-specific estimates per 100,000 by sex in 2022, difference in sex estimates indicated by gray bar
Figure 1
Figure 1
Global map of cardiovascular disease mortality attributable to ambient particulate matter pollution per 100,000 in 2022 with equal interval classification
Figure 2
Figure 2
Global cardiovascular disease attributable to ambient particulate matter pollution estimates per 100,000 by measure with shaded 95% uncertainty interval, 1990-2022
Figure 3
Figure 3
Cardiovascular disease age-standardized disability-adjusted life years (DALYs) attributable to ambient particulate matter pollution per 100,000 by Global Burden of Disease region and sex in 2022, 95% uncertainty interval indicated by black bar
Figure 4
Figure 4
Global cardiovascular disease age-specific estimates attributable to ambient particulate matter pollution per 100,000 by sex in 2022, difference in sex estimates indicated by gray bar
Figure 1
Figure 1
Global map of cardiovascular disease mortality attributable to household air pollution from solid fuels per 100,000 in 2022 with equal interval classification
Figure 2
Figure 2
Global cardiovascular disease attributable to household air pollution from solid fuels estimates per 100,000 by measure with shaded 95% uncertainty interval, 1990-2022
Figure 3
Figure 3
Cardiovascular disease age-standardized disability-adjusted life years (DALYs) attributable to household air pollution from solid fuels per 100,000 by Global Burden of Disease region and sex in 2022, 95% uncertainty interval indicated by black bar
Figure 4
Figure 4
Global cardiovascular disease age-specific estimates attributable to household air pollution from solid fuels per 100,000 by sex in 2022, difference in sex estimates indicated by gray bar
Figure 1
Figure 1
Global map of cardiovascular disease mortality attributable to high temperature per 100,000 in 2022 with equal interval classification
Figure 2
Figure 2
Global cardiovascular disease attributable to high temperature estimates per 100,000 by measure with shaded 95% uncertainty interval, 1990-2022
Figure 3
Figure 3
Cardiovascular disease age-standardized disability-adjusted life years (DALYs) attributable to high temperature per 100,000 by Global Burden of Disease region and sex in 2022, 95% uncertainty interval indicated by black bar
Figure 4
Figure 4
Global cardiovascular disease age-specific estimates attributable to high temperature per 100,000 by sex in 2022, difference in sex estimates indicated by gray bar
Figure 1
Figure 1
Global map of cardiovascular disease mortality attributable to low temperature per 100,000 in 2022 with equal interval classification
Figure 2
Figure 2
Global cardiovascular disease attributable to low temperature estimates per 100,000 by measure with shaded 95% uncertainty interval, 1990-2022
Figure 3
Figure 3
Cardiovascular disease age-standardized disability-adjusted life years (DALYs) attributable to low temperature per 100,000 by Global Burden of Disease region and sex in 2022, 95% uncertainty interval indicated by black bar
Figure 4
Figure 4
Global cardiovascular disease age-specific estimates attributable to low temperature per 100,000 by sex in 2022, difference in sex estimates indicated by gray bar
Figure 1
Figure 1
Global map of cardiovascular disease mortality attributable to lead exposure per 100,000 in 2022 with equal interval classification
Figure 2
Figure 2
Global cardiovascular disease attributable to lead exposure estimates per 100,000 by measure with shaded 95% uncertainty interval, 1990-2022
Figure 3
Figure 3
Cardiovascular disease age-standardized disability-adjusted life years (DALYs) attributable to lead exposure per 100,000 by Global Burden of Disease region and sex in 2022, 95% uncertainty interval indicated by black bar
Figure 4
Figure 4
Global cardiovascular disease age-specific estimates attributable to lead exposure per 100,000 by sex in 2022, difference in sex estimates indicated by gray bar
Figure 1
Figure 1
Global map of cardiovascular disease mortality attributable to smoking per 100,000 in 2022 with equal interval classification
Figure 2
Figure 2
Global cardiovascular disease attributable to smoking estimates per 100,000 by measure with shaded 95% uncertainty interval, 1990-2022
Figure 3
Figure 3
Cardiovascular disease age-standardized disability-adjusted life years (DALYs) attributable to smoking per 100,000 by Global Burden of Disease region and sex in 2022, 95% uncertainty interval indicated by black bar
Figure 4
Figure 4
Global cardiovascular disease age-specific estimates attributable to smoking per 100,000 by sex in 2022, difference in sex estimates indicated by gray bar
Figure 1
Figure 1
Global map of cardiovascular disease mortality attributable to secondhand smoke per 100,000 in 2022 with equal interval classification
Figure 2
Figure 2
Global cardiovascular disease attributable to secondhand smoke estimates per 100,000 by measure with shaded 95% uncertainty interval, 1990-2022
Figure 3
Figure 3
Cardiovascular disease age-standardized disability-adjusted life years (DALYs) attributable to secondhand smoke per 100,000 by Global Burden of Disease region and sex in 2022, 95% uncertainty interval indicated by black bar
Figure 4
Figure 4
Global cardiovascular disease age-specific estimates attributable to secondhand smoke per 100,000 by sex in 2022, difference in sex estimates indicated by gray bar
Figure 1
Figure 1
Global map of cardiovascular disease mortality attributable to high alcohol use per 100,000 in 2022 with equal interval classification
Figure 2
Figure 2
Global cardiovascular disease attributable to high alcohol use estimates per 100,000 by measure with shaded 95% uncertainty interval, 1990-2022
Figure 3
Figure 3
Cardiovascular disease age-standardized disability-adjusted life years (DALYs) attributable to high alcohol use per 100,000 by Global Burden of Disease region and sex in 2022, 95% uncertainty interval indicated by black bar
Figure 4
Figure 4
Global cardiovascular disease age-specific estimates attributable to high alcohol use per 100,000 by sex in 2022, difference in sex estimates indicated by gray bar
Figure 1
Figure 1
Global map of cardiovascular disease mortality attributable to dietary risks per 100,000 in 2022 with equal interval classification
Figure 2
Figure 2
Global cardiovascular disease attributable to dietary risks estimates per 100,000 by measure with shaded 95% uncertainty interval, 1990-2022
Figure 3
Figure 3
Cardiovascular disease age-standardized disability-adjusted life years (DALYs) attributable to dietary risks per 100,000 by Global Burden of Disease region and sex in 2022, 95% uncertainty interval indicated by black bar
Figure 4
Figure 4
Global cardiovascular disease age-specific estimates attributable to dietary risks per 100,000 by sex in 2022, difference in sex estimates indicated by gray bar
Figure 1
Figure 1
Global map of cardiovascular disease mortality attributable to low physical activity per 100,000 in 2022 with equal interval classification
Figure 2
Figure 2
Global cardiovascular disease attributable to low physical activity estimates per 100,000 by measure with shaded 95% uncertainty interval, 1990-2022
Figure 3
Figure 3
Cardiovascular disease age-standardized disability-adjusted life years (DALYs) attributable to low physical activity per 100,000 by Global Burden of Disease region and sex in 2022, 95% uncertainty interval indicated by black bar
Figure 4
Figure 4
Global cardiovascular disease age-specific estimates attributable to low physical activity per 100,000 by sex in 2022, difference in sex estimates indicated by gray bar
Figure 1
Figure 1
Global map of cardiovascular disease mortality attributable to high fasting plasma glucose per 100,000 in 2022 with equal interval classification
Figure 2
Figure 2
Global cardiovascular disease attributable to high fasting plasma glucose estimates per 100,000 by measure with shaded 95% uncertainty interval, 1990-2022
Figure 3
Figure 3
Cardiovascular disease age-standardized disability-adjusted life years (DALYs) attributable to high fasting plasma glucose per 100,000 by Global Burden of Disease region and sex in 2022, 95% uncertainty interval indicated by black bar
Figure 4
Figure 4
Global cardiovascular disease age-specific estimates attributable to high fasting plasma glucose per 100,000 by sex in 2022, difference in sex estimates indicated by gray bar
Figure 1
Figure 1
Global map of cardiovascular disease mortality attributable to high LDL cholesterol per 100,000 in 2022 with equal interval classification
Figure 2
Figure 2
Global cardiovascular disease attributable to high LDL cholesterol estimates per 100,000 by measure with shaded 95% uncertainty interval, 1990-2022
Figure 3
Figure 3
Cardiovascular disease age-standardized disability-adjusted life years (DALYs) attributable to high LDL cholesterol per 100,000 by Global Burden of Disease region and sex in 2022, 95% uncertainty interval indicated by black bar
Figure 4
Figure 4
Global cardiovascular disease age-specific estimates attributable to high LDL cholesterol per 100,000 by sex in 2022, difference in sex estimates indicated by gray bar
Figure 1
Figure 1
Global map of cardiovascular disease mortality attributable to high systolic blood pressure per 100,000 in 2022 with equal interval classification
Figure 2
Figure 2
Global cardiovascular disease attributable to high systolic blood pressure estimates per 100,000 by measure with shaded 95% uncertainty interval, 1990-2022
Figure 3
Figure 3
Cardiovascular disease age-standardized disability-adjusted life years (DALYs) attributable to high systolic blood pressure per 100,000 by Global Burden of Disease region and sex in 2022, 95% uncertainty interval indicated by black bar
Figure 4
Figure 4
Global cardiovascular disease age-specific estimates attributable to high systolic blood pressure per 100,000 by sex in 2022, difference in sex estimates indicated by gray bar
Figure 1
Figure 1
Global map of cardiovascular disease mortality attributable to high body mass index per 100,000 in 2022 with equal interval classification
Figure 2
Figure 2
Global cardiovascular disease attributable to high body mass index estimates per 100,000 by measure with shaded 95% uncertainty interval, 1990-2022
Figure 3
Figure 3
Cardiovascular disease age-standardized disability-adjusted life years (DALYs) attributable to high body mass index per 100,000 by Global Burden of Disease region and sex in 2022, 95% uncertainty interval indicated by black bar
Figure 4
Figure 4
Global cardiovascular disease age-specific estimates attributable to high body mass index per 100,000 by sex in 2022, difference in sex estimates indicated by gray bar
Figure 1
Figure 1
Global map of cardiovascular disease mortality attributable to kidney dysfunction per 100,000 in 2022 with equal interval classification
Figure 2
Figure 2
Global cardiovascular disease attributable to kidney dysfunction estimates per 100,000 by measure with shaded 95% uncertainty interval, 1990-2022
Figure 3
Figure 3
Cardiovascular disease age-standardized disability-adjusted life years (DALYs) attributable to kidney dysfunction per 100,000 by Global Burden of Disease region and sex in 2022, 95% uncertainty interval indicated by black bar
Figure 4
Figure 4
Global cardiovascular disease age-specific estimates attributable to kidney dysfunction per 100,000 by sex in 2022, difference in sex estimates indicated by gray bar

Similar articles

Cited by

References

    1. Murray CJL. Protocol for the Global Burden of Diseases, Injuries, And Risk Factors Study (GBD) [Accessed November 10, 2023]. https://www.healthdata.org/sites/default/files/files/Projects/GBD/March2... .
    1. Stevens GA, Alkema L, Black RE, et al. Guidelines for accurate and transparent health estimates reporting: the GATHER statement. The Lancet. 2016;388:e19–e23. - PubMed
    1. Wang H, Abbas KM, Abbasifard M, et al. Global age-sex-specific fertility, mortality, healthy life expectancy (HALE), and population estimates in 204 countries and territories, 1950-2019: a comprehensive demographic analysis for the Global Burden of Disease Study 2019. The Lancet. 2020;396:1160–1203. - PMC - PubMed
    1. Gibson G, Blumer V, Mentz RJ, Lala A. Universal Definition and Classification of Heart Failure: A Step in the Right Direction from Failure to Function. [Accessed November 8, 2023]. https://www.acc.org/Latest-in-Cardiology/Articles/2021/07/12/12/31/Unive... .
    1. Johnson SC, Cunningham M, Dippenaar IN, et al. Public health utility of cause of death data: applying empirical algorithms to improve data quality. [Accessed November 8, 2023]; https://bmcmedinformdecismak.biomedcentral.com/articles/10.1186/s12911-0... . - DOI - PMC - PubMed

Publication types

LinkOut - more resources