

Lymphoid tissues contribute to plasma viral clonotypes early after antiretroviral therapy interruption in SIV-infected rhesus macaques
- PMID: 38091409
- PMCID: PMC11244655
- DOI: 10.1126/scitranslmed.adi9867
Lymphoid tissues contribute to plasma viral clonotypes early after antiretroviral therapy interruption in SIV-infected rhesus macaques
Abstract
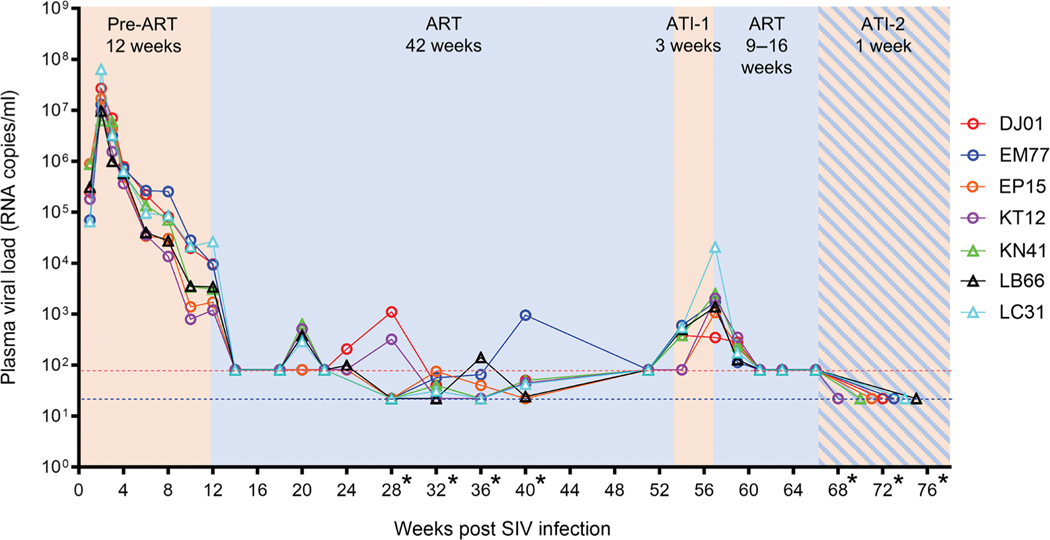
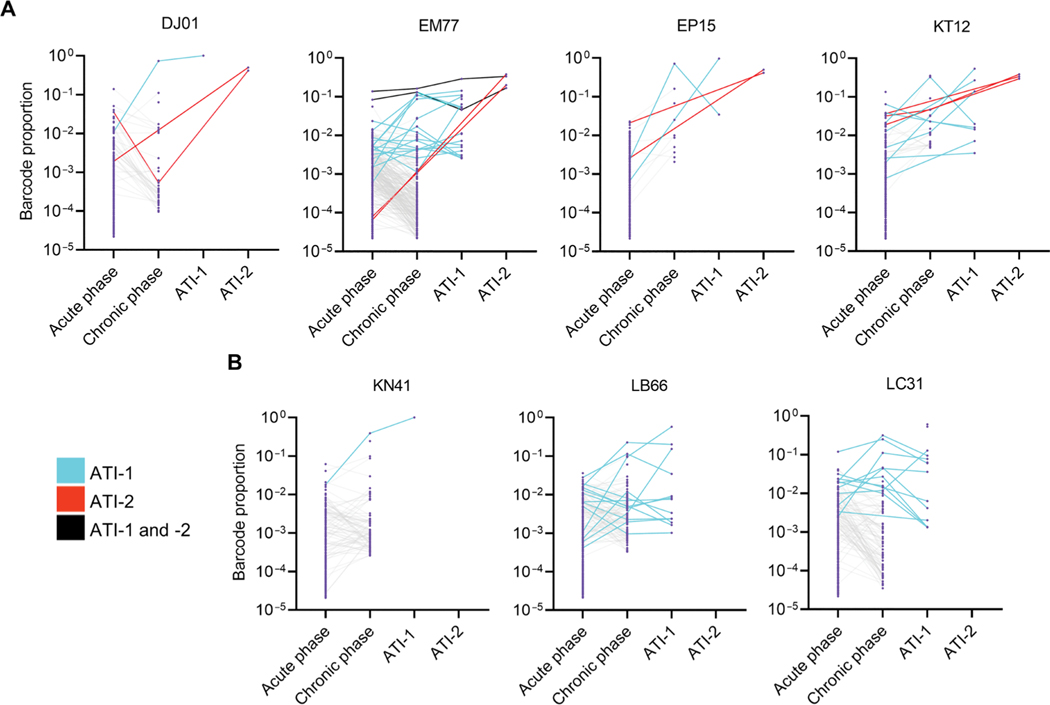
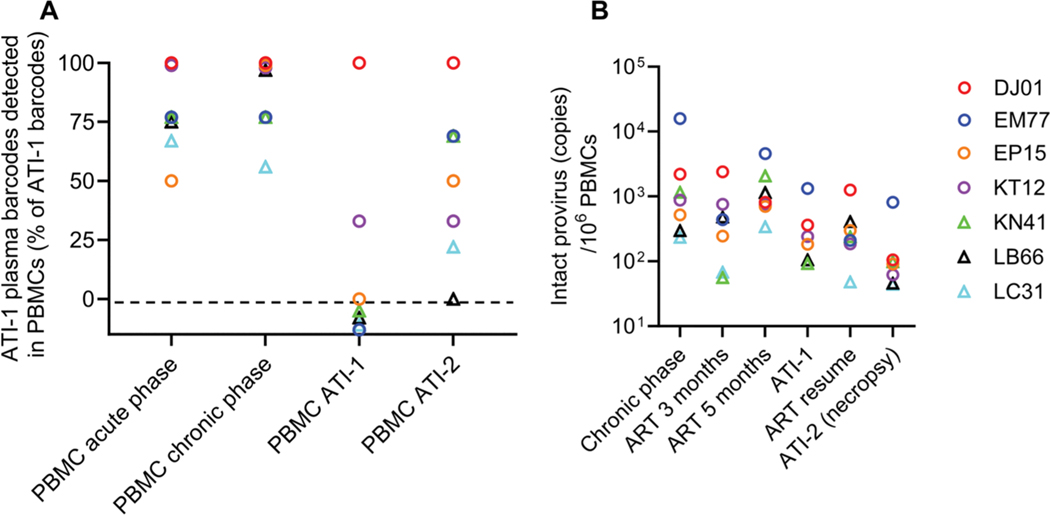
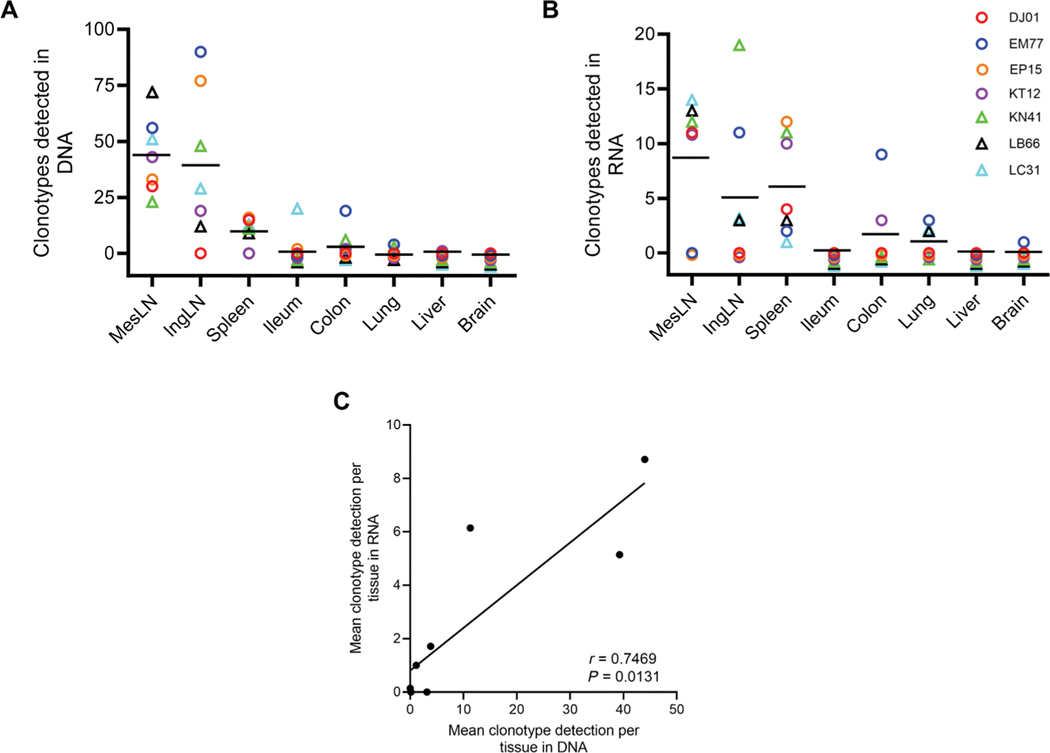
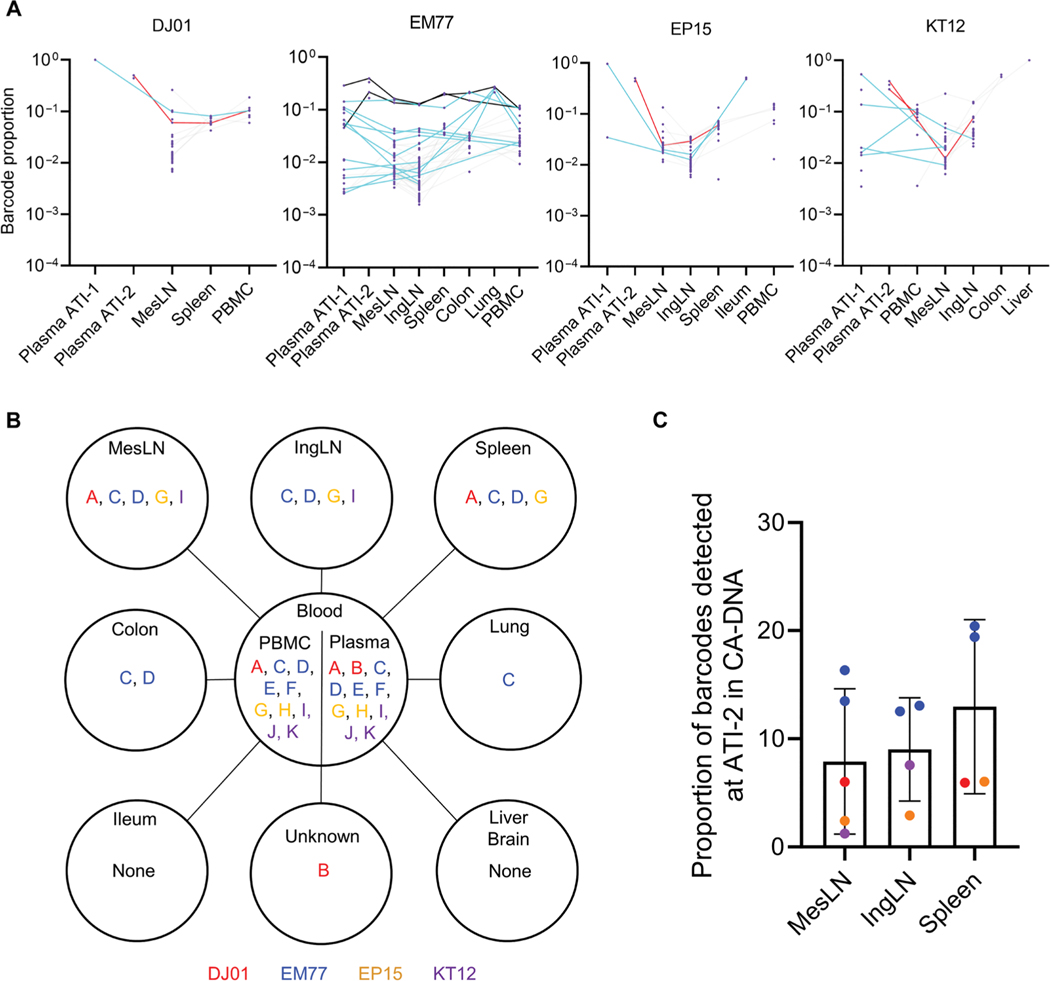
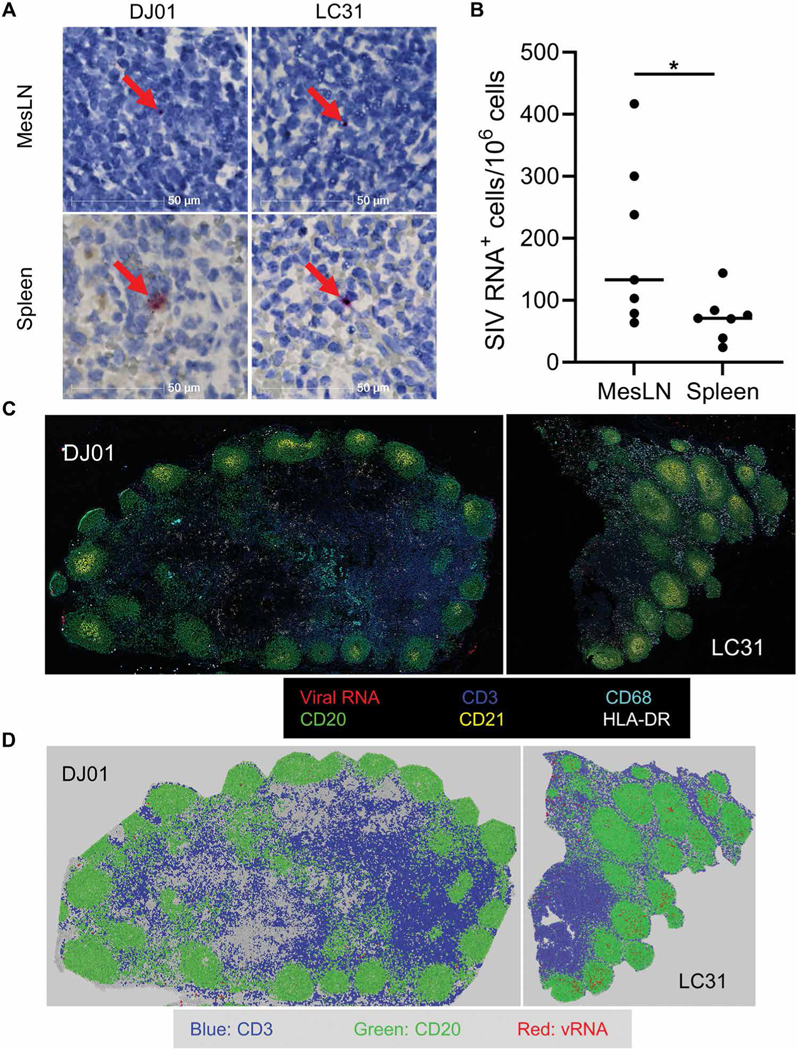
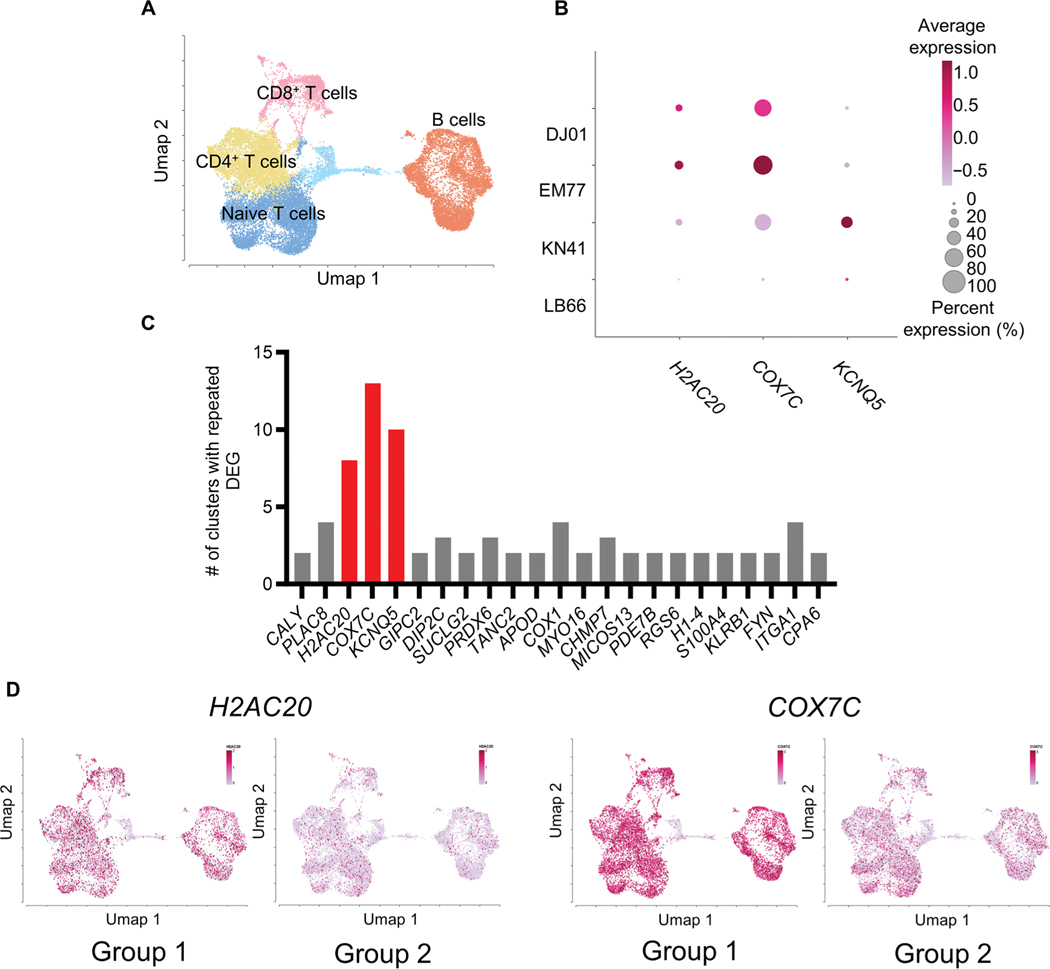
The rebound-competent viral reservoir, composed of a virus that is able to persist during antiretroviral therapy (ART) and mediate reactivation of systemic viral replication and rebound viremia after ART interruption (ATI), remains the biggest obstacle to treating HIV infection. A better understanding of the cellular and tissue origins and the dynamics of viral populations that initiate rebound upon ATI could help develop therapeutic strategies for reducing the rebound-competent viral reservoir. In this study, barcoded simian immunodeficiency virus (SIV), SIVmac239M, was used to infect rhesus macaques to enable monitoring of viral barcode clonotypes contributing to virus detectable in plasma after ATI. Blood and tissues from secondary lymphoid organs (spleen, mesenteric lymph nodes, and inguinal lymph nodes) and from the colon, ileum, lung, liver, and brain were analyzed using viral barcode sequencing, intact proviral DNA assay, single-cell RNA sequencing, and combined CODEX and RNAscope in situ hybridization. Four of seven animals had viral barcodes detectable by deep sequencing of plasma at necropsy, although plasma viral RNA remained below 22 copies per milliliter. Among the tissues studied, mesenteric lymph nodes, inguinal lymph nodes, and spleen contained viral barcodes detected in plasma. CD4+ T cells were the main cell type harboring viral RNA after ATI. Furthermore, T cell zones in lymphoid tissues showed higher viral RNA abundance than B cell zones for most animals. These findings are consistent with lymphoid tissues contributing to the virus present in plasma early after ATI.
Conflict of interest statement
Figures

Update of
-
Lymphoid tissues contribute to viral clonotypes present in plasma at early post-ATI in SIV-infected rhesus macaques.bioRxiv [Preprint]. 2023 May 30:2023.05.30.542512. doi: 10.1101/2023.05.30.542512. bioRxiv. 2023. Update in: Sci Transl Med. 2023 Dec 13;15(726):eadi9867. doi: 10.1126/scitranslmed.adi9867. PMID: 37398418 Free PMC article. Updated. Preprint.
Similar articles
-
Spatial technologies to evaluate the HIV-1 reservoir and its microenvironment in the lymph node.mBio. 2024 Aug 14;15(8):e0190924. doi: 10.1128/mbio.01909-24. Epub 2024 Jul 26. mBio. 2024. PMID: 39058091 Free PMC article. Review.
-
Early antiretroviral therapy in SIV-infected rhesus macaques reveals a multiphasic, saturable dynamic accumulation of the rebound competent viral reservoir.PLoS Pathog. 2024 Apr 9;20(4):e1012135. doi: 10.1371/journal.ppat.1012135. eCollection 2024 Apr. PLoS Pathog. 2024. PMID: 38593120 Free PMC article.
-
Lymphoid tissues contribute to viral clonotypes present in plasma at early post-ATI in SIV-infected rhesus macaques.bioRxiv [Preprint]. 2023 May 30:2023.05.30.542512. doi: 10.1101/2023.05.30.542512. bioRxiv. 2023. Update in: Sci Transl Med. 2023 Dec 13;15(726):eadi9867. doi: 10.1126/scitranslmed.adi9867. PMID: 37398418 Free PMC article. Updated. Preprint.
-
CD8+ cells and small viral reservoirs facilitate post-ART control of SIV replication in M3+ Mauritian cynomolgus macaques initiated on ART two weeks post-infection.PLoS Pathog. 2023 Sep 25;19(9):e1011676. doi: 10.1371/journal.ppat.1011676. eCollection 2023 Sep. PLoS Pathog. 2023. PMID: 37747933 Free PMC article.
-
Platelet-rich therapies for musculoskeletal soft tissue injuries.Cochrane Database Syst Rev. 2014 Apr 29;2014(4):CD010071. doi: 10.1002/14651858.CD010071.pub3. Cochrane Database Syst Rev. 2014. PMID: 24782334 Free PMC article. Review.
Cited by
-
Spatial technologies to evaluate the HIV-1 reservoir and its microenvironment in the lymph node.mBio. 2024 Aug 14;15(8):e0190924. doi: 10.1128/mbio.01909-24. Epub 2024 Jul 26. mBio. 2024. PMID: 39058091 Free PMC article. Review.
References
-
- Deeks SG, Archin N, Cannon P, Collins S, Jones RB, de Jong M, Lambotte O, Lamplough R, Ndung’u T, Sugarman J, Tiemessen CT, Vandekerckhove L, Lewin SR; International AIDS Society (IAS) Global Scientific Strategy working group, Research priorities for an HIV cure: international AIDS society global scientific strategy 2021. Nat Med 27, 2085–2098 (2021). - PubMed
-
- Cadena AM, Ventura JD, Abbink P, Borducchi EN, Tuyishime H, Mercado NB, Walker-Sperling V, Siamatu M, Liu PT, Chandrashekar A, Nkolola JP, McMahan K, Kordana N, Hamza V, Bondzie EA, Fray E, Kumar M, Fischinger S, Shin SA, Lewis MG, Siliciano RF, Alter G, Barouch DH, Persistence of viral RNA in lymph nodes in ART-suppressed SIV/SHIV-infected rhesus macaques. Nat. Commun. 12, 1474 (2021). - PMC - PubMed
-
- Rabezanahary H, Moukambi F, Palesch D, Clain J, Racine G, Andreani G, Benmadid-Laktout G, Zghidi-Abouzid O, Soundaramourty C, Tremblay C, Silvestri G, Estaquier J, Despite early antiretroviral therapy effector memory and follicular helper CD4 T cells are major reservoirs in visceral lymphoid tissues of SIV-infected macaques. Mucosal Immunol. 13, 149–160 (2020). - PMC - PubMed
MeSH terms
Substances
Grants and funding
- R01 MH130193/MH/NIMH NIH HHS/United States
- 75N91019D00024/CA/NCI NIH HHS/United States
- U42 OD024282/OD/NIH HHS/United States
- R01 MH116844/MH/NIMH NIH HHS/United States
- R01 AI093307/AI/NIAID NIH HHS/United States
- HHSN261201500003I/CA/NCI NIH HHS/United States
- P51 OD011133/OD/NIH HHS/United States
- R01 NS104016/NS/NINDS NIH HHS/United States
- S10 OD028732/OD/NIH HHS/United States
- U42 OD010442/OD/NIH HHS/United States
- P51 RR000164/RR/NCRR NIH HHS/United States
- S10 OD028653/OD/NIH HHS/United States
- P51 OD011104/OD/NIH HHS/United States
- HHSN261201500003C/CA/NCI NIH HHS/United States
LinkOut - more resources
Full Text Sources
Medical
Research Materials
