Homer1 ameliorates ischemic stroke by inhibiting necroptosis-induced neuronal damage and neuroinflammation
- PMID: 38091015
- PMCID: PMC10776472
- DOI: 10.1007/s00011-023-01824-x
Homer1 ameliorates ischemic stroke by inhibiting necroptosis-induced neuronal damage and neuroinflammation
Abstract
Objective: Proinflammatory necroptosis is the main pathological mechanism of ischemic stroke. Homer scaffolding protein 1 (Homer1) is a postsynaptic scaffolding protein that exerts anti-inflammatory effects in most central nervous system diseases. However, the relationship between Homer1 and proinflammatory necroptosis in ischemic stroke remains unclear.
Aim: This study aimed to investigate the role of Homer1 in ischemia-induced necroptosis.
Methods: C57BL/6 mice were used to establish a model of permanent middle cerebral artery occlusion model (pMCAO). Homer1 knockdown mice were generated using adeno-associated virus (AAV) infection to explore the role of Homer1 and its impact on necroptosis in pMCAO. Finally, Homer1 protein was stereotaxically injected into the ischemic cortex of Homer1flox/flox/Nestin-Cre +/- mice, and the efficacy of Homer1 was investigated using behavioral assays and molecular biological assays to explore potential mechanisms.
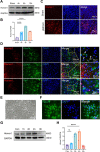
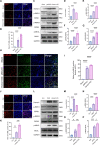
Results: Homer1 expression peaked at 8 h in the ischemic penumbral cortex after pMCAO and colocalized with neurons. Homer1 knockdown promoted neuronal death by enhancing necroptotic signaling pathways and aggravating ischemic brain damage in mice. Furthermore, the knockdown of Homer1 enhanced the expression of proinflammatory cytokines. Moreover, injection of Homer1 protein reduced necroptosis-induced brain injury inhibited the expression of proinflammatory factors, and ameliorated the outcomes in the Homer1flox/flox/Nestin-Cre+/- mice after pMCAO.
Conclusions: Homer1 ameliorates ischemic stroke by inhibiting necroptosis-induced neuronal damage and neuroinflammation. These data suggested that Homer1 is a novel regulator of neuronal death and neuroinflammation.
Keywords: Homer1; Ischemic stroke; Necroptosis; Neuroinflammation.
© 2023. The Author(s).
Conflict of interest statement
The authors have declared that no competing interest exists.
Figures


Similar articles
-
Homer1 promotes the conversion of A1 astrocytes to A2 astrocytes and improves the recovery of transgenic mice after intracerebral hemorrhage.J Neuroinflammation. 2022 Mar 14;19(1):67. doi: 10.1186/s12974-022-02428-8. J Neuroinflammation. 2022. PMID: 35287697 Free PMC article.
-
Homer1 Protects against Retinal Ganglion Cell Pyroptosis by Inhibiting Endoplasmic Reticulum Stress-Associated TXNIP/NLRP3 Inflammasome Activation after Middle Cerebral Artery Occlusion-Induced Retinal Ischemia.Int J Mol Sci. 2023 Nov 27;24(23):16811. doi: 10.3390/ijms242316811. Int J Mol Sci. 2023. PMID: 38069134 Free PMC article.
-
Infiltrating myeloid cell-derived properdin markedly promotes microglia-mediated neuroinflammation after ischemic stroke.J Neuroinflammation. 2023 Nov 11;20(1):260. doi: 10.1186/s12974-023-02946-z. J Neuroinflammation. 2023. PMID: 37951917 Free PMC article.
-
The Role of Necroptosis in Cerebral Ischemic Stroke.Mol Neurobiol. 2024 Jul;61(7):3882-3898. doi: 10.1007/s12035-023-03728-7. Epub 2023 Dec 1. Mol Neurobiol. 2024. PMID: 38038880 Review.
-
The role of RhoA/ROCK pathway in the ischemic stroke-induced neuroinflammation.Biomed Pharmacother. 2023 Sep;165:115141. doi: 10.1016/j.biopha.2023.115141. Epub 2023 Jul 10. Biomed Pharmacother. 2023. PMID: 37437375 Review.
Cited by
-
Polyploid cancer cells reveal signatures of chemotherapy resistance.bioRxiv [Preprint]. 2024 Aug 23:2024.08.19.608632. doi: 10.1101/2024.08.19.608632. bioRxiv. 2024. Update in: Oncogene. 2024 Nov 22. doi: 10.1038/s41388-024-03212-z PMID: 39229204 Free PMC article. Updated. Preprint.
-
Polyploid cancer cells reveal signatures of chemotherapy resistance.Oncogene. 2024 Nov 22. doi: 10.1038/s41388-024-03212-z. Online ahead of print. Oncogene. 2024. PMID: 39578659
-
Polyploid cancer cells reveal signatures of chemotherapy resistance.Res Sq [Preprint]. 2024 Oct 14:rs.3.rs-4921634. doi: 10.21203/rs.3.rs-4921634/v1. Res Sq. 2024. Update in: Oncogene. 2024 Nov 22. doi: 10.1038/s41388-024-03212-z PMID: 39483900 Free PMC article. Updated. Preprint.
-
Serum Homer1 is a Novel Biomarker for Predicting the Clinical Outcomes of Acute Ischemic Stroke Patients [Letter].J Inflamm Res. 2024 Mar 15;17:1685-1686. doi: 10.2147/JIR.S466792. eCollection 2024. J Inflamm Res. 2024. PMID: 38504694 Free PMC article. No abstract available.
References
MeSH terms
Substances
Grants and funding
LinkOut - more resources
Full Text Sources
Medical
Research Materials

