. 2023 Oct;2(10):899-916.
doi: 10.1038/s44161-023-00336-5. Epub 2023 Sep 28.

SARS-CoV-2 infection triggers pro-atherogenic inflammatory responses in human coronary vessels

Affiliations

SARS-CoV-2 infection triggers pro-atherogenic inflammatory responses in human coronary vessels

Natalia Eberhardt et al. Nat Cardiovasc Res. 2023 Oct.

Abstract

Patients with coronavirus disease 2019 (COVID-19) present increased risk for ischemic cardiovascular complications up to 1 year after infection. Although the systemic inflammatory response to severe acute respiratory syndrome coronavirus 2 (SARS-CoV-2) infection likely contributes to this increased cardiovascular risk, whether SARS-CoV-2 directly infects the coronary vasculature and attendant atherosclerotic plaques remains unknown. Here we report that SARS-CoV-2 viral RNA is detectable and replicates in coronary lesions taken at autopsy from severe COVID-19 cases. SARS-CoV-2 targeted plaque macrophages and exhibited a stronger tropism for arterial lesions than adjacent perivascular fat, correlating with macrophage infiltration levels. SARS-CoV-2 entry was increased in cholesterol-loaded primary macrophages and dependent, in part, on neuropilin-1. SARS-CoV-2 induced a robust inflammatory response in cultured macrophages and human atherosclerotic vascular explants with secretion of cytokines known to trigger cardiovascular events. Our data establish that SARS-CoV-2 infects coronary vessels, inducing plaque inflammation that could trigger acute cardiovascular complications and increase the long-term cardiovascular risk.


Conflict of interest statement

The M.S. laboratory has received unrelated research funding in sponsored research agreements from ArgenX N.V., Moderna and Phio Pharmaceuticals which has no competing interest with this work. The authors declare no other competing interests.

Figures
Extended Data Fig. 1:
Extended Data Fig. 1:. Pathology assessment and RNA-FISH analysis of coronary arteries from deceased individuals with COVID-19
a) Bar plot (left) shows the number of adaptive intimal thickening (AIT; blue, n = 4), pathological intimal thickening (PIT; magenta, n = 10), fibrocalcific (orange, n = 10) and fibroatheroma (red, n = 3) specimens. Bar plot (right) shows the proportion of coronaries that presented pathological features of lipid pool, calcification, necrotic core, adventitial inflammation, and thrombus. b) Bar plot showing the percentage of CD68+ area. Non-parametric Kruskal-Wallis test with Dunn’s test for multiple comparisons was performed. c) Bar plot showing the quantification of frequency and total count of CD68+ cells in AIT (n = 4), PIT (n = 10), fibrocalcific (n = 8) and fibroatheroma (n = 3). Data are presented as mean values ± s.e.m. Non-parametric Kruskal-Wallis test with Dunn’s test for multiple comparisons was performed. d) Bar plots of total cell number normalized by the area (mm2 ) of vasculature and perivascular fat. Each dot represents a tissue section from AIT (n = 12), PIT (n = 15), fibrocalcific (n = 24) and fibroatheroma (n = 9). Data are presented as mean values ± s.e.m. One-way ANOVA with post-hoc Tukey’s test for multiple comparisons was performed. e) Bar plots of total number of CD68 RNA+ cells quantified in the arterial wall and perivascular fat. Dots represent individual tissue sections from AIT (n = 6), PIT (n = 12), fibrocalcific (n = 16) and fibroatheroma (n = 6). Data are presented as mean values ± s.e.m. One-way ANOVA followed by Holm-Šídák’s test for multiple comparisons was performed. f ) Bar plots of frequency of CD68+ SARS-CoV-2 Spike+ and CD68+ Spike antisense+ cells in AIT (n = 3), PIT (n = 6), fibrocalcific (n = 8) and fibroatheroma (n = 3) coronaries. Non-parametric Kruskal-Wallis test followed by uncorrected Dunn’s test for multiple comparisons was performed. g) Scatter plot of Spearman’s rank correlation (95% confidence interval) of total CD68 RNA copies with total SARS-CoV-2 spike and Spike antisense copies (n = 20). h) SARS-CoV-2 S and S antisense quantification in total tissue, vasculature, and perivascular fat from patients with (n = 7 samples) versus without CV manifestations (n = 13 samples). Data were normalized by tissue area (mm2 ) and presented as mean values ± s.e.m. Rout method (Q = 1%) was used to remove outliers. Unpaired Mann-Whitney test was performed.
Extended Data Fig. 2:
Extended Data Fig. 2:. Analysis of SARS-CoV-2 tropism for human vascular smooth muscle cells.
a) Differential gene expression analysis of ACTA2 and CD68 in vascular smooth muscle cells (VSMCs) and myeloid cell clusters from seven atherosclerotic coronary samples. Wilcoxon Rank-Sum test was used to compare groups and adjusted p-values with Benjamini-Hochberg correction method are shown. b) Differential gene expression analysis of Acta2 mRNA and Cd68 mRNA in lineage-tagged (Tdt+ ) SMC-derived cells dissociated from the aortic arches of atherosclerotic single-color Tomato reporter (Myh11-CreERT2, Rosa26tdTomato/ tdTomato, ApoE−/− mice) mice fed high fat diet (HFD) for 18 weeks versus control mice. Wilcoxon Rank-Sum test was used to compare groups and adjusted p-values with BH correction method are shown. c) Representative images of spatial analysis of PIT coronary samples, and fibrocalcific and fibroatheroma (FCFA) samples showing the location of ACTA2+ cells, ACTA2+ SARS-CoV-2 Spike+ cells or ACTA2+ SARS-CoV-2 Spike antisense+ cells. Bar plots showing the number and frequencies of ACTA2+ cells/mm2 , ACTA2+ SARS-CoV-2 Spike vRNA+ and ACTA2+ SARS-CoV-2 S antisense+ cells normalized by tissue area (mm2 ) in intimal thickening (PIT; n = 6) versus fibrocalcific and fibroatheroma (n = 3) coronaries. Mann-Whitney test (two-tailed) was performed. d) Representative images of Oil Red-O staining of human VSMCs treated with 10 μg/mL of Cholesterol– methyl-β-cyclodextrin (Chol:MβCD) or vehicle overnight before infection and kept for 48 h. e) Bar plots showing the frequencies of SARS-CoV-2 Spike vRNA+, ACTA2+ SARS-CoV-2 Spike vRNA+ , SARS-CoV-2 S antisense+ and ACTA2+ SARSCoV-2 Spike antisense+ cells in vehicle and Chol:MβCD conditions after infection with SARS-CoV-2 USA-WA1/2020 for 24 h. n = 20 of vehicle and n = 25 Chol:MβCD treated VSMCs in Spike vRNA quantification experiment, n = 21 of vehicle and n = 24 Chol:MβCD treated VSMCs in Spike antisense quantification experiment. Mann-Whitney test (two-tailed) was used.
Extended Data Fig. 3:
Extended Data Fig. 3:. SARS-CoV-2 in-vitro infection of human primary macrophages and foam cells
a) Representative images of not-infected and infected macrophages and foam cells cultured with mNG reporter virus (MOI 0.1) at 24 hpi. Scale bar, 20 μm. b) Representative images of not-infected and SARS-CoV-2 infected macrophages and foam cells at 24 hours post-infection (hpi). Scale bar, 20 μm. c) Representative images of plaque assay in VERO E6- TMPRSS2-T2A-ACE2 cells of culture supernatants of macrophages and foam cells cultured with SARS-CoV-2 USA-WA1/2020 at 2 hpi, 8 hpi, 24 hpi, and 48 hpi. Serial dilutions are represented from left to right (−1 to −6). d) Bar plot showing the log10 FC of SARS-CoV-2 NP RNA levels normalized by 2 hpi samples (n = 4 biological replicates) in infected macrophages and foam cells. e) Bar plots showing the combined score of Gene Ontology (GO) Biological Process 2021 enrichment analysis of upregulated genes in infected macrophages, foam cells and or both vs. non-infected counterparts. P < 0.05. *, P < 0.05; **, P < 0.01; ***, P < 0.001. f ) Heat map of log2 FC in complement genes between SARS-CoV-2 infected macrophages (n = 3) and SARS-CoV-2 infected foam cells (n = 3) at 0 hpi, 2 hpi, 8 hpi, 24 hpi and 48 hpi. Adjusted P-values < 0.05 (FDR = 10%) were considered significant. g) Heat map of Log2 fold changes in lysosomal genes in SARS-CoV-2 infected cells vs. not infected cells at 2 hpi, 8 hpi, 24 hpi and 48 hpi. h) Heat map of Log2 fold changes in lysosomal genes in SARS-CoV-2 infected macrophages vs. foam cells at 2 hpi, 8 hpi, 24 hpi and 48 hpi. P-values < 0.05 were considered significant. P < 0.05. *, P < 0.05; **, P < 0.01; ***, P < 0.001. i) Heat map of log2 FC in lipid metabolism genes in SARS-CoV-2 infected macrophages (n = 3) vs. foam cells (n = 3) at 2 hpi, 8 hpi, 24 hpi and 48 hpi. Adjusted P-values < 0.05 (FDR = 0.1) were considered significant. P < 0.05. *, P < 0.05; **, P < 0.01; ***, P < 0.001. j) Quantification of Caspase-8 concentration in culture supernatants of not infected or SARS-CoV-2 infected macrophages and foam cells. One-way ANOVA with post-hoc Tukey’s test were performed.
Extended Data Fig. 4:
Extended Data Fig. 4:. Dynamics of cytokine response in macrophages and foam cells after SARS-CoV-2 infection
a) Heat maps of log2 FC of selected differentially expressed cytokine and chemokine genes in SARS-CoV-2 infected macrophages (left, n = 3) and foam cells (right, n = 3) versus. non-infected counterparts at different hpi. P-values were adjusted using BenjaminiHochberg correction (FDR = 10%). Adjusted P-values < 0.05 were considered significant. Asterisk indicates an adjusted P-value < 0.05 for the comparison of infected vs not infected at each timepoint. Asterisk in parentheses indicates an adjusted P value < 0.05 for the interaction term of the model. *, P < 0.05; **, P < 0.01; ***, P < 0.001. b) Kinetic plots showing the area under the curve (AUC) of cytokines and chemokines in the supernatant of SARS-CoV-2 infected and non-infected macrophages and foam cells (n = 4 biological replicates, technical duplicates). For AUC comparisons, one-way ANOVA with Tukey’s test for multiple comparisons was used. Bar plots represent Mean ± s.e.m. One-way ANOVA followed by Šídák’s test for multiple comparisons was performed.
Extended Data Fig. 5:
Extended Data Fig. 5:. Ex-vivo SARS-CoV-2 infection of human carotid vascular explants
a) Representative images of human atherosclerotic plaque tissues infected ex vivo with SARS-CoV-2 USA-WA1/2020 (105 PFU) versus mock infected control shows the expression of spike protein and nucleoprotein (NP). Scale bar, 100 μm. b) Electron microscopy of human atherosclerotic carotid plaque tissue infected ex vivo with the SARS-CoV-2. Scale bar, 1 μm. Black arrows indicate coronavirus-like particles. c) Heat map of selected cytokine and chemokine genes showing the log2 FC in SARS-CoV-2 infected carotid vascular explants versus not-infected tissues at different times post-infection. Wald test from DESeq2 package was used to test for significance. P values were adjusted using Benjamini-Hochberg correction (FDR = 10%) and denoted as an asterisk *, P < 0.05; **, P < 0.01; ***, P < 0.001. d) Kinetic plots showing the AUC of selected cytokines and chemokines secreted by non-infected or SARS-CoV-2 infected carotid vascular explants (n = 3 donors, technical duplicates) at different time post-infection. One-way ANOVA with Šídák’s test for multiple comparisons was performed. Bar plots represent mean ± s.e.m. Unpaired t-test (two-tailed) was performed and P < 0.05 was considered significant.
Extended Data Fig. 6:
Extended Data Fig. 6:. Single cell RNA sequencing analysis of SARS-CoV-2 entry factors in vascular myeloid subclusters
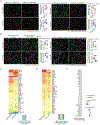
a) Heat map shows transcripts expression (median TPM, transcripts per million) of SARS-CoV-2 entry factors identified in lung, whole blood, heart (left ventricle and atrial appendage), aorta, and tibial and coronary arteries. b) Violin plots showing the log10 TMP + 1 of tissue level expression of SARS-CoV-2 entry factors in lung, aorta, tibial and coronary artery identified. Data are presented as median ±IQR (25%–75% quartiles) in the box plot, violin plot defines density of data in whole range. c) UMAP embedding of integrated total immune cells from carotid (n = 10) and coronary (n = 7) tissues. d) Gene expression of SARS-CoV-2 viral entry factors and related genes projected onto the UMAP of total immune cells. e) UMAP representation of myeloid cell clusters colored by tissue origin. Dots represent individual cells belonging to carotid (red) or coronary artery (blue). f ) Heatmap displaying selected z-score scaled genes (columns) across myeloid cell subclusters (rows) from human coronary and carotid samples. Canonical genes were used for myeloid subclusters annotations.
Extended Data Fig. 7:
Extended Data Fig. 7:. Abrogation of SARS-CoV-2 interaction with host by NRP-1 small molecule inhibitor and silencing RNA
a) Dot plot showing the relative expression levels of NRP1 RNA normalized by GAPDH RNA expression in macrophages and foam cells. Average percentage of NRP1 silencing efficacy were calculated and depicted at the top (n = 4 biological replicates measured by technical duplicate per cell type, condition). b) Representative image of capillary western blot (Wes) was performed to evaluate the protein expression levels of NRP1 after siRNA NRP1 or siRNA control treatment. Target protein NRP1 (130–140 kD) and β-actin loading control blots (42 kD) are shown. c) Total NRP1 RNA copies were quantified in not-infected macrophages and foam cells treated with either siRNA control or siRNA NRP1 (n = 31 images of macrophages siRNA control; n = 26 macrophages siRNA NRP1, n = 24 foam cells siRNA control, n = 25 foam cells siRNA NRP1) at 24 hpi. d) Representative images and quantification of RNA-FISH showing NRP1 RNA in not-infected macrophages and foam cells. e) Representative images of RNA-FISH showing SARS-CoV-2 spike vRNA and NRP1 RNA (left), SARS-CoV-2 spike antisense vRNA and NRP1 RNA (right) in infected macrophages and foam cells treated with non-targeting siRNA control or siRNA NRP1 at 24 hpi. f ) Representative images of RNA-FISH showing SARS-CoV-2 S vRNA and NRP1 RNA (left), SARS-CoV-2 S antisense RNA and NRP1 RNA (right) in infected macrophages and foam cells with and without NRP1-blocking (EG00229 trifluoroacetate) at 24 hpi.
Extended Data Fig. 8:
Extended Data Fig. 8:. Dynamics of cytokine response in NRP1- blocking/ silencing treated macrophages and foam cells
a) Heat map of standardized z-scored gene expression of cytokines and chemokines in not-infected, SARS-CoV-2 infected macrophages and foam cells treated with non-targeting siRNA control or siRNA NRP1 at 24 hpi. b) Quantification of TGF-β1 concentration (pg mL−1) in culture supernatants of not infected (n = 4) or SARS-CoV-2 infected macrophages and foam cells with (n = 4) or without (n = 8) NRP1-blocking treatment (EG00229 trifluoroacetate) at 24 hpi. Data are presented as mean values ±s.e.m. One-way ANOVA with post-hoc Tukey’s test for multiple comparisons was performed.
Figure 1:
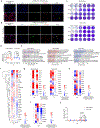
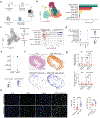
Figure 1:. SARS-CoV-2 viral RNA in human coronary arteries from deceased individuals with COVID-19 is identified using artificial intelligence-based spatial analysis.
a, Categorical heat map of coronary autopsy specimens (n = 27) from deceased individuals with COVID-19 (n = 8) displays their sex, age and pathology classification into AIT, PIT, fibrocalcific plaques and fibroatheromas. The clinical history for each patient is shown. Summary of acute cardiovascular (CV) manifestations during COVID-19 disease progression, coronary stenosis (no: <50%; yes: >50%), hospitalization duration and time to death after COVID-19 diagnosis are also depicted. RNA copy numbers of S and S antisense vRNA normalized to vasculature and perivascular fat area (mm2) are shown. NE, not evaluated. b, Representative images of coronary samples stained with H&E and CD68 staining for each pathological classification. c, Representative images of in situ RNA-FISH AI-based analysis. After semi-automatic annotations, an AI-based neural network was used to classify the vasculature (yellow) and perivascular fat (green). Background and artifacts (red) were removed from the analysis. Next, nuclei segmentation classifier analysis and RNA quantification were performed using HALO AI and spatial analysis workflow. d, Representative images of spatial analysis showing the location of CD68 RNA, SARS-CoV-2 S+ or S antisense+ cells and CD68+ SARS-CoV-2 RNA double-positive cells. e, Bar plots showing total SARS-CoV-2 vRNA copies of S and S antisense normalized by tissue area (mm2) in AIT (n = 4), PIT (n = 5), fibrocalcific (n = 8) and fibroatheroma (n = 3) coronary samples. f, Bar plots showing total CD68+ SARS-CoV-2 S+ or S antisense+ cells in the vasculature or perivascular fat regions normalized by tissue area (mm2) in AIT (n = 4), PIT (n = 5), fibrocalcific (n = 10) and fibroatheroma (n = 3) coronary samples. One-way analysis of variance (ANOVA) statistical analysis with post hoc Tukey’s test for multiple comparisons was performed. g, SARS-CoV-2 S and S antisense quantification in vasculature and perivascular fat normalized by tissue area (mm2). Wilcoxon matched-pairs signed-rank test was performed (n = 20 per group). h, Representative images of of SARS-CoV-2 NP, CD68 and merge in human coronary. White arrow indicates CD68+ SARS-CoV-2 NP+ cell, and yellow arrow indicates CD68+ cell. Pt., patient.
Figure 2:
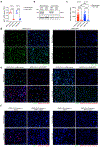
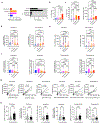
Figure 2:. Differential interferon response and virus clearance dynamics in human macrophages and foam cells after SARS-CoV-2 in-vitro infection
a) Quantification of mNG reporter-positive macrophages and foam cells (n = 21 images per condition). b) Quantification of SARS-CoV-2-infected macrophages (24 hpi, n = 20; 48 hpi, n = 24) and foam cells (24 hpi, n = 20; 48 hpi, n = 18). Representative images for a and b show results at 48 hpi. Scale bars, 20 μm. One-way ANOVA with post hoc Tukey’s test was performed. Data are presented as mean values ± s.e.m. c) RNA-FISH quantification of SARS-CoV-2 vRNA+ cell copies and frequency in macrophages (n = 37) and foam cells (n = 26). Data are presented as mean values ± s.e.m. Scale bars, 20 μm. Mann–Whitney U-test was performed. d) Heat map of SARS-CoV-2 viral genes reads in macrophages and foam cells. e) Heat map of log2FC of SARS-CoV-2 viral genes in macrophages versus foam cells. The Wald test from the DESeq2 package was used to test for significance. Adjusted P values < 0.05 (FDR = 1%) were considered significant. f) Viral titer quantification of SARS-CoV-2-infected macrophages and foam cell culture supernatants (n = 6). Data are presented as mean values ± s.e.m. One-way ANOVA followed by Tukey’s post hoc test was performed. g) Venn diagram of DEGs in infected versus non-infected macrophages, foam cells and shared genes. The Wald test from the DESeq2 package was used to test for significance. Bar plots show upregulated signaling pathways ranked by their combined score. *P < 0.05; **P < 0.01; ***P < 0.001. h) Heat maps of log2FC of IFN response genes in macrophages and foam cells. The Wald test from the DESeq2 package was used to test for significance. Adjusted P values < 0.05 (FDR = 10%) were considered significant. Asterisk in parenthesis indicates the comparison of interaction between infection and timepoint terms of the model. *P < 0.05; **P < 0.01; ***P < 0.001. i) Heat map of log2FC of SARS-CoV-2-infected macrophages versus foam (n = 3 biological replicates). The Wald test from the DESeq2 package was used to test for significance. Adjusted P values < 0.05 (FDR = 10%) were considered significant. j) Longitudinal kinetic plots of combined IFN response and SARS-CoV-2 genes scores. Data are presented as median and 25th–75th quartile log2FCs of SARS-CoV-2-infected versus non-infected cells. Hypothesis testing was performed using the Wilcoxon rank-sum test.
Figure 3:
Figure 3:. Analysis of cytokine release dynamics after SARS-CoV-2 infection
a) Heat map of cytokines and chemokines secreted from SARS-CoV-2-infected macrophages and foam cells. Data are shown as log2FC of infected versus uninfected cells. P values were calculated by two-tailed unpaired t-test, *P < 0.05; **P < 0.01; ***P < 0.001. Adjusted P values (Benjamini–Hochberg method) are presented in parentheses. b) Kinetic plots show the AUC of cytokines secreted by SARS-CoV-2-infected macrophages and foam cells versus non-infected cells (n = 4 biological replicates, technical duplicates). For AUC comparisons, one-way ANOVA after Tukey’s multiple comparisons test was performed. Kinetics differences were evaluated by two-way ANOVA followed by Sidak’s multiple comparisons test. Data are presented as mean ± s.e.m. Bar plots show the quantification of the AUC for each cytokine. One-way ANOVA statistical analysis after Tukey’s multiple comparisons test was performed.
Figure 4:
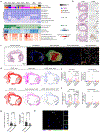
Figure 4:. Host immune response to SARS-CoV-2 infection of human atherosclerosis vascular explants
a) Schematics of experimental approach of human carotid vascular explants infection with SARS-CoV-2. b) Heat map of SARS-CoV-2 viral reads in carotid vascular explants at baseline (0 hpi), 24 hpi, 48 hpi and 72 hpi. c) Infectious viral titer quantification of SARS-CoV-2-infected carotid plaque culture supernatants (n = 3 biological samples, technical duplicates). Data are presented as mean values ± s.e.m. One-way ANOVA followed by Tukey’s post hoc test was performed. d) Heat map showing the standardized z-scored expression of IFN response genes in SARS-CoV-2-infected carotid vascular samples at different times after infection. e) Heat map of standardized z-scored expression of selected host viral receptors and entry factors in SARS-CoV-2-infected human carotid vascular samples. f) Heat map of standardized z-scored gene expression of cytokine and chemokine genes in SARS-CoV-2-infected human carotid vascular explants at different times after infection. g) Heat map of cytokines and chemokines secreted from SARS-CoV-2-infected human atherosclerotic plaques. Data are shown as log2FC of infected versus non-infected samples. P values were calculated by two-tailed paired t-test, *P < 0.05; **P < 0.01; ***P < 0.001. P values in parentheses were adjusted using the Benjamini–Hochberg method. h) Kinetic plots show the AUC of cytokines and chemokines secreted by non-infected or SARS-CoV-2-infected carotid plaques (n = 3 donors, technical duplicates). Data are presented as mean values ± s.e.m. Two-way ANOVA statistical analysis after Sidak’s multiple comparisons test was performed. Paired t-test was performed to compare the AUC of two groups. i) Plot showing the relative expression of secreted cytokines and chemokines between SARS-CoV-2-infected atherosclerotic plaque versus vascular margins. Relative expression is represented in log2FC colored scale. Statistical significance is expressed as dot size. Statistically significant values are represented as circles, and non-significant changes are represented as diamonds. P values were calculated by two-tailed unpaired t-test. P values were adjusted using the Benjamini–Hochberg method.
Figure 5:
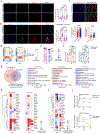
Figure 5:. Single-cell expression of SARS-CoV-2 receptor and entry factors in human atherosclerotic tissue
a) scRNA-seq of human carotid (n = 10) and coronary (GSE131780) (n = 7) tissue samples. b) UMAP visualization of myeloid cell subclusters from coronary (1,960 cells) and carotid (2,900 cells) samples. Bar plot shows the frequency of each myeloid cluster. c) Neighborhood graph of the results from MiloR differential abundance testing. Nodes represent neighborhoods, colored by their log2FC between carotid (red) and coronary (blue) samples. Non-differential abundance neighborhoods are in white (FDR = 10%), and node size reflects the total number of cells in each neighborhood. Beeswarm plots show the log2FC distribution of neighborhoods between tissue type (FDR = 10%). d) Dot plot of the SARS-CoV-2 viral entry factor average gene expression and percent of expression in each myeloid subcluster. e) Dot plots showing the frequency of cells expressing SARS-CoV-2 viral entry factors colored by average expression in atherosclerotic plaque lesions and paired vasculature margins. f) Representative images of H&E and spatial analysis of PIT coronary sample showing the location of CD68+NRP1+ cells, CD68+NRP1+ SARS-CoV-2 S+ or S antisense+ cells. g) Bar plots showing total NRP1+ SARS-CoV-2 vRNA+ and CD68+NRP1+ SARS-CoV-2 vRNA+ cells normalized by tissue area (mm2) in AIT (n = 3), PIT (n = 6), fibrocalcific (n = 8) and fibroatheroma (n = 3) coronaries. h) Representative images and RNA-FISH quantification of frequency of NRP1+ cells and average NRP1 copies per cell in non-infected macrophages (n = 27) and foam cells (n = 28). Scale bars, 20 μm. Statistical analysis was performed using unpaired two-tailed Student’s t-test. Avg, average; Mac, macrophages; Mon, monocytes.
Figure 6:
Figure 6:. Abrogation of NRP-1 mediated SARS-CoV-2 infection
a) Representative images of AI-based RNA-FISH quantification showing NRP1 RNA, SARS-CoV-2 S and S antisense+ cells. Scale bars, 50 μm. Quantification of the frequency of SARS-CoV-2 S+ and SARS-CoV-2 S antisense+ cells in macrophages and foam cells treated with non-targeting siRNA control or siRNA NRP1 at 24 hpi. Data are presented as mean values ± s.e.m. Statistical analysis was performed using unpaired two-tailed Student’s t-test. b) Representative images of RNA-FISH quantification showing NRP1 RNA, SARS-CoV-2 S and S antisense+ cells. Scale bars, 20 μm. Quantification of the frequency of SARS-CoV-2 S+ and SARS-CoV-2 S antisense+ cells in macrophages and foam cells with and without NRP1 inhibition (EG00229 trifluoroacetate) at 24 hpi. c) Heat map of differentially secreted cytokine and chemokine levels from SARS-CoV-2-infected macrophages and foam cells (n = 4–5) after treatment with siRNA control or siRNA NRP1 at 24 hpi. Adjusted P values < 0.05 were considered significant. Asterisk indicates an adjusted P value < 0.05 for the comparison of SARS-CoV-2 infected and treated with NRP1 siRNA versus infected and siRNA control. Asterisks in parentheses indicate nominal P < 0.05 for the comparison between macrophages versus foam cells, *P < 0.05; **P < 0.01; ***P < 0.001. d) Heat map of differentially secreted cytokine and chemokine levels from SARS-CoV-2-infected macrophages and foam cells after NRP1 blocking (EG00229 trifluoroacetate). Results are shown as log2FC between infected and non-treated conditions. Adjusted P values < 0.05 were considered significant. Asterisk indicates an adjusted P value < 0.05 for the comparison of SARS-CoV-2 infected and treated versus infected and vehicle-treated conditions. Asterisks in parentheses indicate nominal P value < 0.05 for the comparison between macrophages versus foam cells, *P < 0.05; **P < 0.01; ***P < 0.001. e) Plot showing the relative expression of secreted cytokines and chemokines from NRP1 blocking (EG00229 trifluoroacetate) treated versus untreated SARS-CoV-2-infected atherosclerotic plaques at 48 hpi. Relative expression is represented in log2FC colored scale. Circles represent statistically significant results, and non-significant changes are represented as diamonds.

Update of

Comment in

Similar articles

Cited by

References

    1. Lamers MM & Haagmans BL SARS-CoV-2 pathogenesis. Nat Rev Microbiol 20, 270–284 (2022). 10.1038/s41579-022-00713-0 - DOI - PubMed
    1. Engelen SE, Robinson AJB, Zurke YX & Monaco C Therapeutic strategies targeting inflammation and immunity in atherosclerosis: how to proceed? Nat Rev Cardiol 19, 522–542 (2022). 10.1038/s41569-021-00668-4 - DOI - PMC - PubMed
    1. Katsoularis I, Fonseca-Rodriguez O, Farrington P, Lindmark K & Fors Connolly AM Risk of acute myocardial infarction and ischaemic stroke following COVID-19 in Sweden: a self-controlled case series and matched cohort study. Lancet 398, 599–607 (2021). 10.1016/S0140-6736(21)00896-5 - DOI - PMC - PubMed
    1. Kwong JC et al. Acute Myocardial Infarction after Laboratory-Confirmed Influenza Infection. N Engl J Med 378, 345–353 (2018). 10.1056/NEJMoa1702090 - DOI - PubMed
    1. Merkler AE et al. Risk of Ischemic Stroke in Patients With Coronavirus Disease 2019 (COVID-19) vs Patients With Influenza. JAMA Neurol (2020). 10.1001/jamaneurol.2020.2730 - DOI - PMC - PubMed