. 2023 Nov 22;15(23):5519.
doi: 10.3390/cancers15235519.

Unexpected Differences in the Speed of Non-Malignant versus Malignant Cell Migration Reveal Differential Basal Intracellular ATP Levels

Affiliations

Unexpected Differences in the Speed of Non-Malignant versus Malignant Cell Migration Reveal Differential Basal Intracellular ATP Levels

Bareun Kim et al. Cancers (Basel). .

Abstract

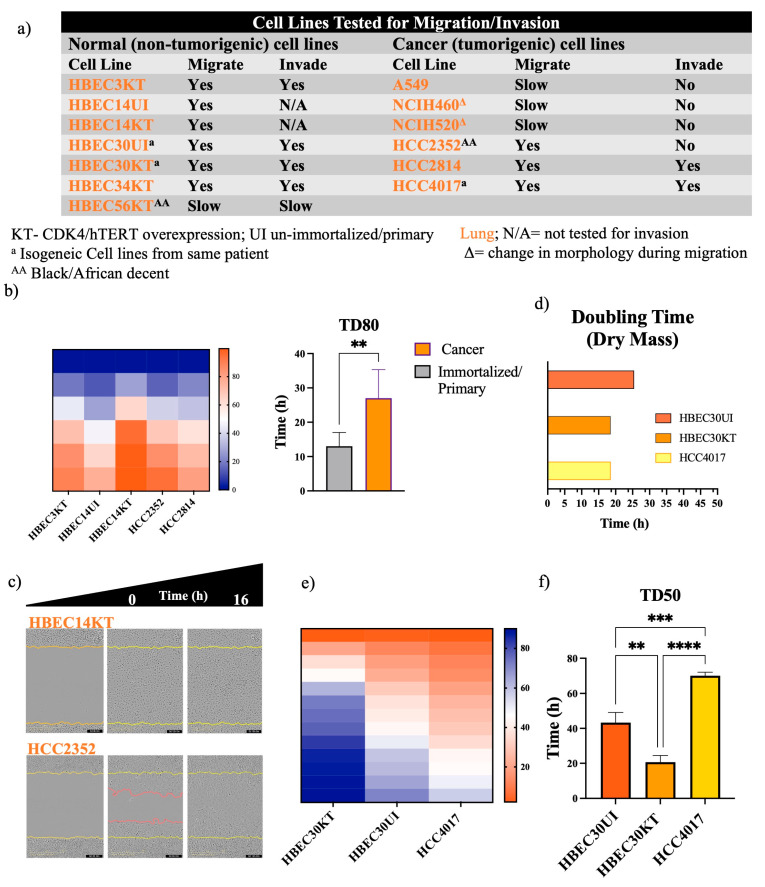
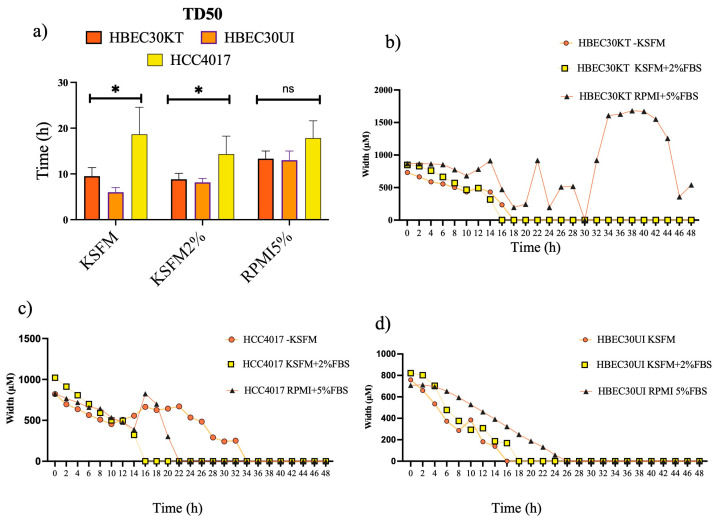
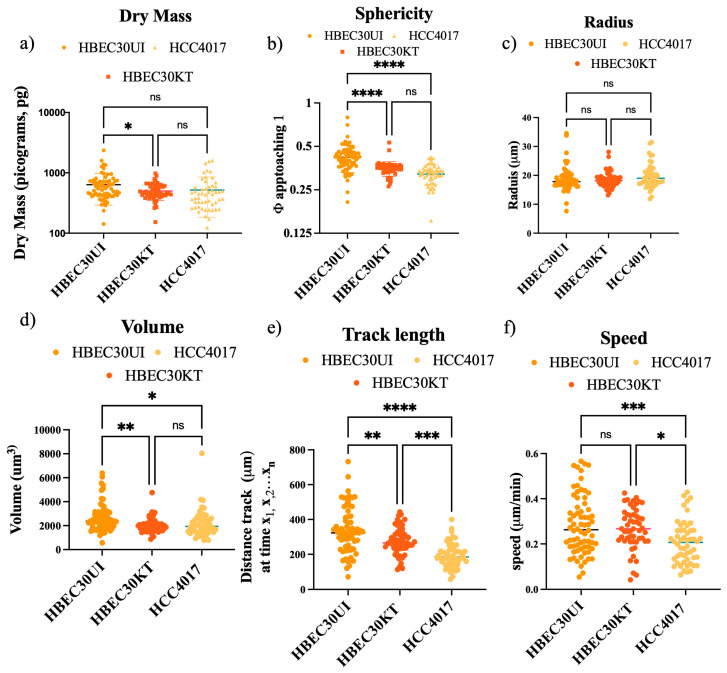
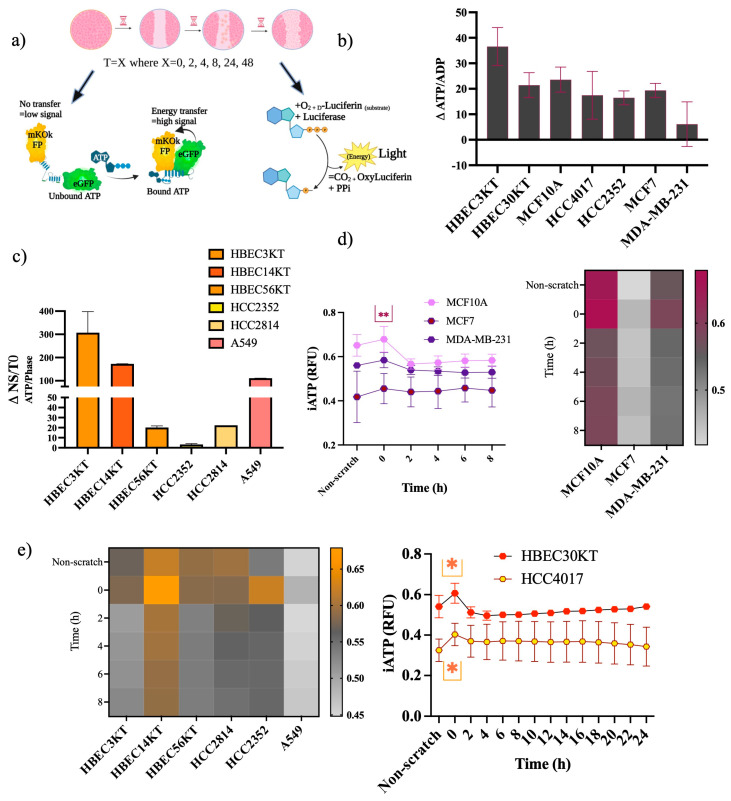
Cellular locomotion is required for survival, fertility, proper embryonic development, regeneration, and wound healing. Cell migration is a major component of metastasis, which accounts for two-thirds of all solid tumor deaths. While many studies have demonstrated increased energy requirements, metabolic rates, and migration of cancer cells compared with normal cells, few have systematically compared normal and cancer cell migration as well as energy requirements side by side. Thus, we investigated how non-malignant and malignant cells migrate, utilizing several cell lines from the breast and lung. Initial screening was performed in an unbiased high-throughput manner for the ability to migrate/invade on collagen and/or Matrigel. We unexpectedly observed that all the non-malignant lung cells moved significantly faster than cells derived from lung tumors regardless of the growth media used. Given the paradigm-shifting nature of our discovery, we pursued the mechanisms that could be responsible. Neither mass, cell doubling, nor volume accounted for the individual speed and track length of the normal cells. Non-malignant cells had higher levels of intracellular ATP at premigratory-wound induction stages. Meanwhile, cancer cells also increased intracellular ATP at premigratory-wound induction, but not to the levels of the normal cells, indicating the possibility for further therapeutic investigation.

Keywords: cancer cell migration; cell migration; normal epithelial cell motility.


Conflict of interest statement

The authors declare no conflict of interest. The funders had no role in the design of the study; in the collection, analyses, or interpretation of data; in the writing of the manuscript; or in the decision to publish the results.

Figures

Figure 1
Figure 1
Non-malignant lung cells close wounds faster than cancer cells. (a) Table of lung cell lines tested for the ability to migrate on collagen and invade Matrigel. KT-CDK4/hTERT overexpression; UI, unimmortalized/primary a isogeneic cell lines from same patient; AA Black/African descent. Normal and cancer cells were plated in duplicate in a 96-well plate at a density between 35,000 and 50,000/well. Heatmaps for panel (b) represent the quantification of time to closure. Graph of panel (b) quantitates the time for wounds to reach a density of 80% (TD80) in lung. Wounds were initiated using the 96-well Incucyte® Wound Maker. (c) Images were collected every 1–2 h on the SX5 Incucyte ®Live cell imaging instrument and analyzed using the Sartorius 96-well cell migration software application. Yellow lines in images indicate the initial wounded area; red lines represent cells moving into the wound. (d) Doubling times of the isogeneic cell lines chosen for further experimentation. Heatmaps for panel (e) represent the quantification of time to closure. (f) Quantitation time for wounds to reach a density of 50% (TD50) in isogeneic cell lines. Data were analyzed using unpaired t-test; ** p < 0.01, *** p < 0.0005, **** p <0.0001 Error bars represent +/-S.D. N is the quantitation of individual experiments. N = 3 for normal cells: HBEC3KT, 14UI, 14KT, 30UI, and 30KT; for cancer cells, N = 5 for HCC2352, N = 4 for HCC2814, and N = 3 for HCC4017.
Figure 2
Figure 2
MDA-MB-231 achieves faster wound closure than MCF7 and MCF10A. (a) Table of breast/mammary cell lines tested for their ability to migrate on collagen and invade Matrigel. Cells were plated in duplicate in a 96-well plate at a density between 35,000 and 50,000/well. Heatmaps for panel (b) represent the quantification of time to closure. Graph of panel (b) quantitates the time for wounds to reach a density of 40% (TD40). (c) Images were collected every 1–2 h on the SX5 Incucyte® Live cell imaging instrument and analyzed using the Sartorius 96-well cell migration software application. Yellow lines in images indicate the initial wounded area; red lines represent cells moving into the wound. Error bars represent S.E.M. N is quantitation of individual experiments; N = 3. Data were analyzed using one-way ANOVA; * p < 0.05 for MCF10A compared with MDA-MB-231, ns = not statistically significant.
Figure 3
Figure 3
Irrespective of media, normal cells outcompete cancer cells. (a) Graph of isogeneic lung cells quantitating the time for wounds to reach a density of 50% (TD50) in various media. (bd) Measurements of wound width (in μm) of each cell line in different media. Error bars in (a) represent individual experiments of N = 3 for each cell line +/-S.E.M. * p < 0.05 achieved using two-way ANOVA. n.s.= not statistically significant Wound measurements are representative of one experiment from (a).
Figure 4
Figure 4
Physical parameters do not account for faster migration speed. Each cell line was plated at a density of 40,000/well. Wounds were initiated using the 96-well Incucyte® Wound Maker. Images were collected every 30 min on the LiveCyte imager. A total of 45 frames were collected. A combination of 1000 (HBEC30UI), 2500 (HCC4017), and 3200 (HBEC30KT) cells were initially tracked and analyzed. The first 50 individual cells that were visible from frame 1 to frame 45 were graphed. Graphs represent 2 individual experiments run simultaneously with 3 replicates per cell line. Statistics of (a) dry mass, (b) sphericity, (c) radius, (d) volume, (e) track length, (f) speed were all achieved using S.D. one-way ANOVA; * p < 0.05, ** p < 0.01, *** p < 0.005, **** p < 0.0001, ns = not statistically significant.
Figure 5
Figure 5
Increased ATP demands at wound induction. (a) Experimental scheme for ATP assessment. Experimental schematic created using BioRender (Toronto, ON, Canada). For (be), wounds were initiated using the 96-well Incucyte® Wound Maker. Images were collected every 2 h on the SX5 Incucyte ®Live cell imaging instrument and analyzed using the Sartorius (96-well) SX5 Metabolism Optical module and the ATP analysis software. (b) Cells were plated to confluency, lysates extracted from non-scratch control cells (NS) and at wound induction (T = 0). ATP/ADP ratios of wound induction were subtracted from non-scratch controls (ΔATP/ADP). Error bars are representative of 2 out of 4 experiments. (c,d) Intracellular ATP measurements of cell lines. (c) Non-malignant and malignant cancer cells analyzed only for NS and T = 0. Error bars on (c,d) are of 3 independent experiments. Intracellular ATP measurements of (e) normal and cancer cells of the lung. Cells for (ce) were all plated at a density of 40,000/well. Error bar graphs in (e) are N = 4 for 30KT and N = 3 for HCC4017; heatmaps represent standard deviation of N = 3 independent experiments; ** p < 0.01, ns = not statistically significant. Statistical significance was assessed using a two-way ANOVA for (d,e). Upper* indicates statistical difference between HBEC30KT and HCC4017 at wound induction and lower* indicates a statistical difference before wound induction.
Figure 6
Figure 6
Increased ATP demands at wound induction. Isogeneic cells stably expressing the iATP construct were seeded at a density of 35–40,000/well. (a) Images of the FRET channel (fixed emission of 578M, Yellow) were used to quantitate iATP per individual cells migrating into the wound via phase then normalized to time zero. (b) Images taken in the FRET channel before wound (c) Images taken in the FRET channel at time 0, 2, 5, and 13 h post wound-induction.

Similar articles

References

    1. Bressan C., Pecora A., Gagnon D., Snapyan M., Labrecque S., De Koninck P., Parent M., Saghatelyan A. The dynamic interplay between ATP/ADP levels and autophagy sustain neuronal migration in vivo. eLife. 2020;9:e56006. doi: 10.7554/eLife.56006. - DOI - PMC - PubMed
    1. Bressan C., Saghatelyan A. AMPK-induced autophagy as a key regulator of cell migration. Autophagy. 2021;17:828–829. doi: 10.1080/15548627.2020.1848120. - DOI - PMC - PubMed
    1. LeBleu V.S., O’Connell J.T., Herrera K.N.G., Wikman H., Pantel K., Haigis M.C., de Carvalho F.M., Damascena A., Chinen L.T.D., Rocha R.M., et al. PGC-1alpha mediates mitochondrial biogenesis and oxidative phosphorylation in cancer cells to promote metastasis. Nat. Cell Biol. 2014;16:992–1003. doi: 10.1038/ncb3039. - DOI - PMC - PubMed
    1. Pacheco-Velazquez S.C., Robledo-Cadena D.X., Hernandez-Resendiz I., Gallardo-Perez J.C., Moreno-Sanchez R., Rodriguez-Enriquez S. Energy Metabolism Drugs Block Triple Negative Breast Metastatic Cancer Cell Phenotype. Mol. Pharm. 2018;15:2151–2164. doi: 10.1021/acs.molpharmaceut.8b00015. - DOI - PubMed
    1. Schafer Z.T., Grassian A.R., Song L., Jiang Z., Gerhart-Hines Z., Irie H.Y., Gao S., Puigserver P., Brugge J.S. Antioxidant and oncogene rescue of metabolic defects caused by loss of matrix attachment. Nature. 2009;461:109–113. doi: 10.1038/nature08268. - DOI - PMC - PubMed

LinkOut - more resources