. 2023 Dec;248(23):2289-2303.
doi: 10.1177/15353702231211939. Epub 2023 Dec 8.

Radiogenomic landscape: Assessment of specific phagocytosis regulators in lower-grade gliomas

Affiliations

Radiogenomic landscape: Assessment of specific phagocytosis regulators in lower-grade gliomas

Aierpati Maimaiti et al. Exp Biol Med (Maywood). 2023 Dec.

Abstract

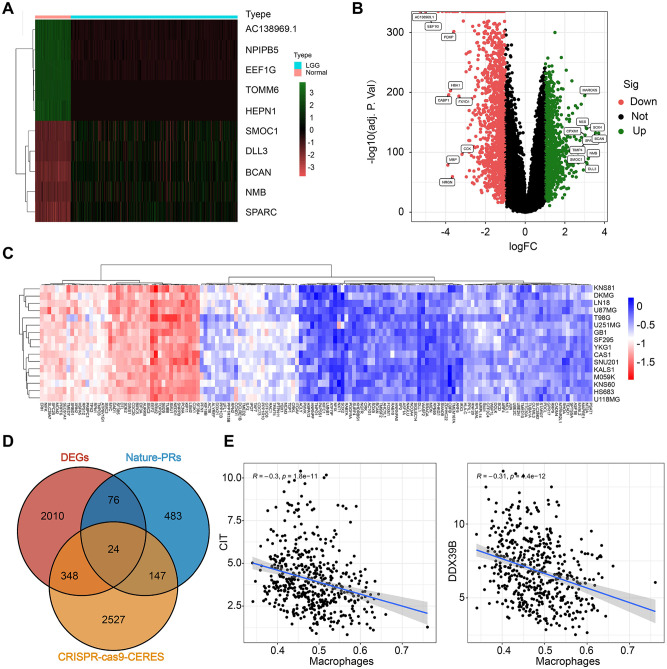
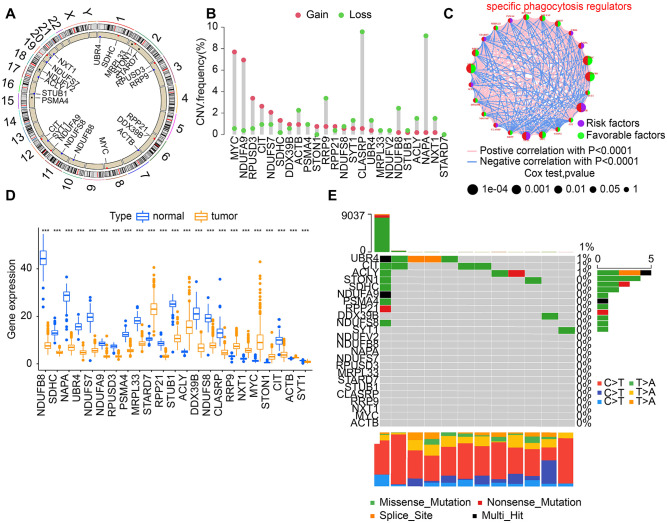
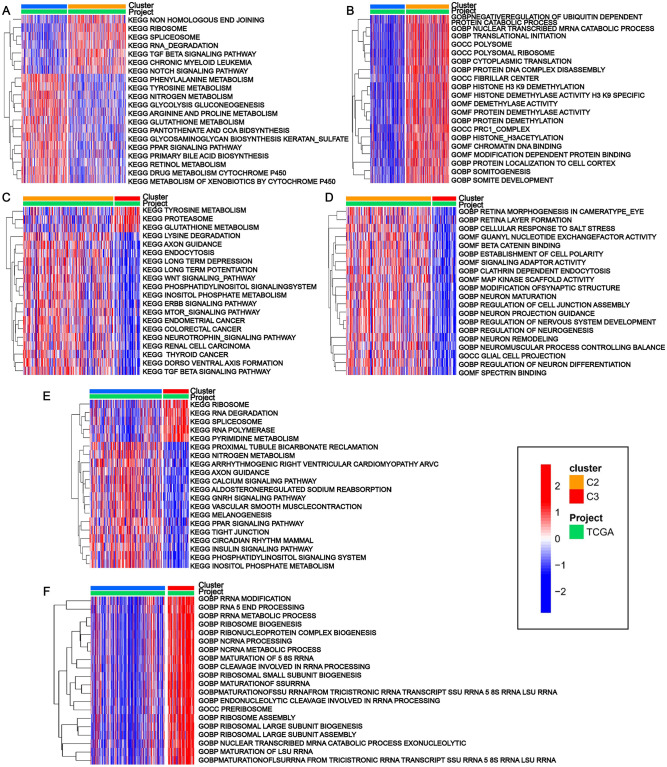
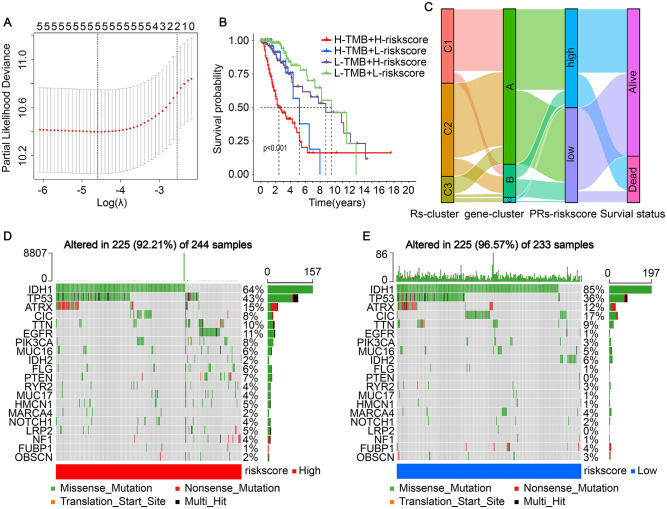
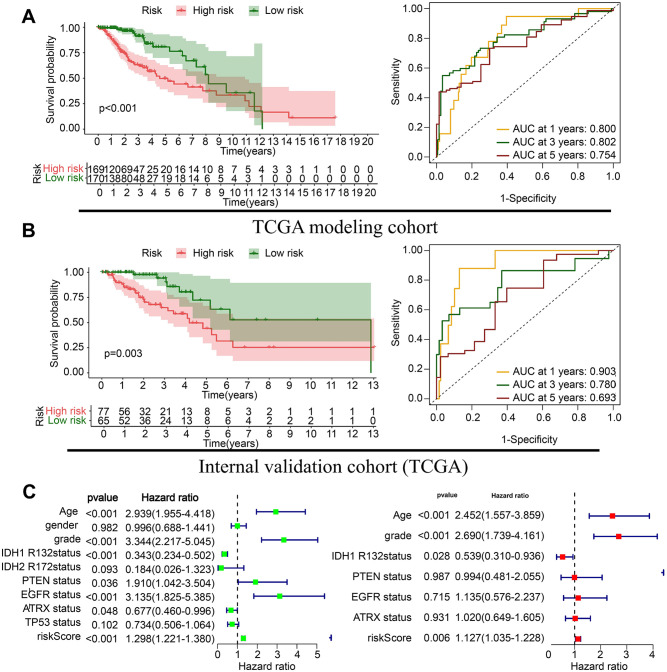
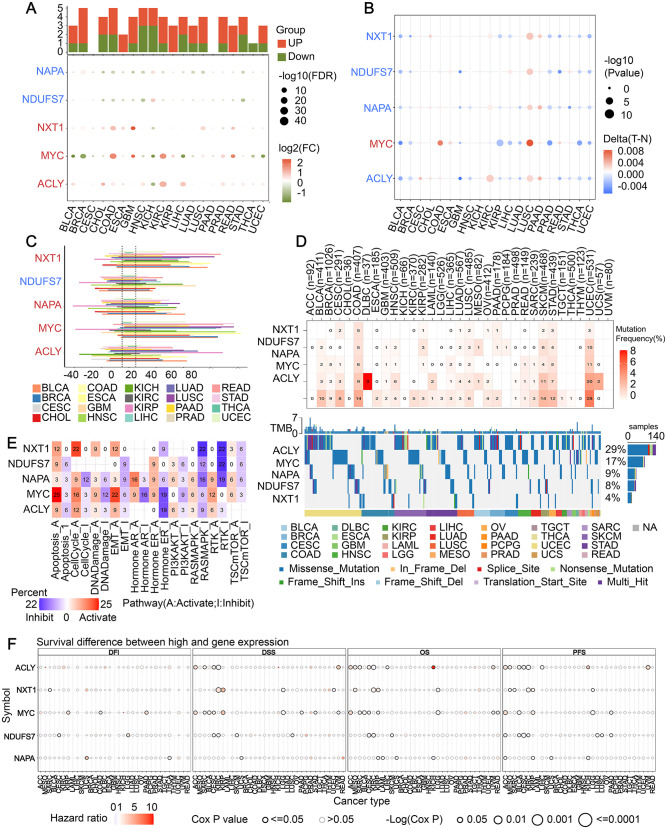
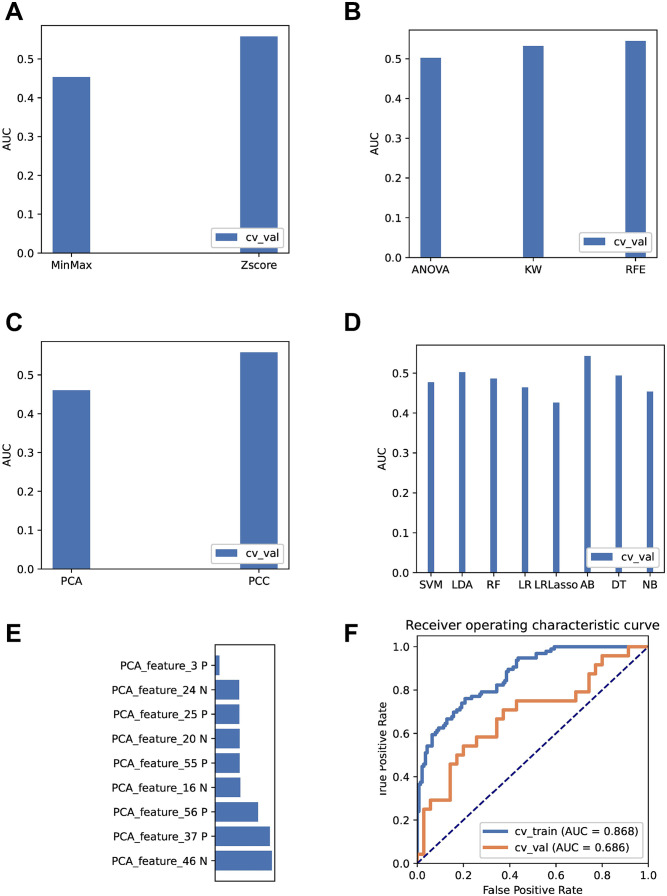
Genome-wide CRISPR-Cas9 knockout screens have emerged as a powerful method for identifying key genes driving tumor growth. The aim of this study was to explore the phagocytosis regulators (PRs) specifically associated with lower-grade glioma (LGG) using the CRISPR-Cas9 screening database. Identifying these core PRs could lead to novel therapeutic targets and pave the way for a non-invasive radiogenomics approach to assess LGG patients' prognosis and treatment response. We selected 24 PRs that were overexpressed and lethal in LGG for analysis. The identified PR subtypes (PRsClusters, geneClusters, and PRs-score models) effectively predicted clinical outcomes in LGG patients. Immune response markers, such as CTLA4, were found to be significantly associated with PR-score. Nine radiogenomics models using various machine learning classifiers were constructed to uncover survival risk. The area under the curve (AUC) values for these models in the test and training datasets were 0.686 and 0.868, respectively. The CRISPR-Cas9 screen identified novel prognostic radiogenomics biomarkers that correlated well with the expression status of specific PR-related genes in LGG patients. These biomarkers successfully stratified patient survival outcomes and treatment response using The Cancer Genome Atlas (TCGA) database. This study has important implications for the development of precise clinical treatment strategies and holds promise for more accurate therapeutic approaches for LGG patients in the future.

Keywords: CRISPR-cas9; lower-grade glioma; phagocytosis regulators; prognostic; radiogenomics.


Conflict of interest statement

Declaration of conflicting interestsThe author(s) declared no potential conflicts of interest with respect to the research, authorship, and/or publication of this article.

Figures

Figure 1.
Figure 1.
Identification of specific PRs in LGG. (A) and (B) Differential analysis of genes between normal and LGG samples (P < 0.05;|logFC| > 1) identified a total of 2458 DEGs, including 1009 upregulated genes and 1449 downregulated genes, (C) Cell line–dependent scoring of 16 primary glioma cell lines identified 3053 potential genes, (D) Venn diagram showing the identification of 24 PRs as specific PRs in LGG, and (E) Correlation analysis of CIT and DDX39B with macrophage content.
Figure 2.
Figure 2.
Mutations and transcriptome alterations of PRs in LGG. (A) The location of CNV alterations in PRs on 23 chromosomes is shown in a circular diagram, (B) The CNV frequencies of PRs are given. Red dots represent amplification frequencies, whereas green dots represent deletion frequencies. Numbers indicate the frequency of variation, (C) Network diagram showing the interactions of the 24 PRs in LGG. The P value for each gene’s impact on survival prognosis is represented by the size of the circles. Green dots indicate favorable factors, whereas red dots indicate risk factors. The correlation value between genes is represented by the line’s thickness. Positive and negative gene regulation correlations are depicted by the red and blue lines, respectively, (D) Expression levels of the 24 PRs between tumor and normal samples. Yellow represents tumor, and blue represents normal. Asterisks indicate statistical P values (*P < 0.05; **P < 0.01; ***P < 0.001), and (E) Mutation frequency of the 24 PRs in LGG.
Figure 3.
Figure 3.
GSVA studied the changes in biological processes between three PRs-clusters. (A) and (B) Comparison of changes in biological processes between C1 and C2, (C) and (D) Comparison of changes in biological processes between C2 and C3, and (E) and (F) Comparison of changes in biological processes between C1 and C3. The heat map shows the biological processes between each cluster.
Figure 4.
Figure 4.
Relationship between the creation of PRs-score and tumor load mutations. (A) The LASSO regression analysis and partial likelihood deviance on the prognostic genes, (B) The difference between the TMB subtype and the PRs-score subtype K-M analysis was statistically significant with a Logrank P value < 0.001, (C) SanKey plots with different PRs-clusters, geneClusters, PRs-scores, and clinical outcome groups, (D) and (E) The landscape of tumor somatic mutation in TCGA-LGG displayed by high (D) and low PRs-score (E). Each column represented individual patients. The upper barplot displayed TMB.
Figure 5.
Figure 5.
Evaluation of the prognostic significance of risk score in the training cohort. (A) Survival curves and ROC curves for the TCGA modeling cohort, (B) Survival curves and ROC curves for the TCGA internal validation cohort and (C) Forest plot of univariate and multivariate Cox regression analysis of PRs-riskscore and clinicopathological variables in the TCGA cohort.
Figure 6.
Figure 6.
The Pan-cancer landscape for signature genes. (A) The graphs show the log FC and FDR of the signature genes in each cancer. Red and blue indicate genes that are up- and downregulated, (B) Heat map depicting the different methylation of signature genes in malignant tumors; hypermethylated and hypomethylated genes are indicated in red and blue, respectively (Wilcoxon rank-sum test), (C) Bar graph showing the frequency of CNV changes for each signature gene in each cancer type, (D) For a given malignancy, the signature gene mutation frequency represents the number of samples with the mutated gene and the SNV oncoplot, (E) Effect of signature genes on cancer-related pathways (FDR ⩽ 0.05), where numbers in each cell indicate percentages, and (F) The graph shows hazard ratios and Cox P values by the color and size of the bubbles. The rows are genomic symbols and the columns are selected cancer types. The color of the bubbles ranges from blue to red representing low to high hazard ratios and the size of the bubbles is positively correlated with the significance of the Cox P value. The black outline border indicates a Cox P value ⩽ 0.05.
Figure 7.
Figure 7.
Establishment of radiomics model. (A) The effect on the AUC values of the radiomics model when different methods of normalizing the imaging data are used, (B) Impact of feature selection methods on classifier AUC values during radiogenomics model building, (C) Effect of the choice of feature reduction method on the AUC value of the model, (D) Comparing the effectiveness of various machine learning modeling approaches on the classifier performance in the test set, including LR, LDA, RF, LR-lasso, NB, DT, SVM, and AB, revealing that AB performed the best, (E) The final radiogenomics model’s weighting coefficients of the retrieved features and (F) Results of the best classifier model’s AUC values in the training and test groups.

Similar articles

References

    1. Gittleman H, Sloan AE, Barnholtz-Sloan JS. An independently validated survival nomogram for lower-grade glioma. Neuro Oncol 2020;22:665–74 - PMC - PubMed
    1. Liu Z, Ji H, Fu W, Ma S, Zhao H, Wang F, Dong J, Yan X, Zhang J, Wang N, Wu J, Hu S. IGFBPs were associated with stemness, inflammation, extracellular matrix remodeling and poor prognosis of low-grade glioma. Front Endocrinol 2022;13:943300 - PMC - PubMed
    1. Sun Y, Sedgwick AJ, Palarasah Y, Mangiola S, Barrow AD. A transcriptional signature of PDGF-DD activated natural killer cells predicts more favorable prognosis in low-grade glioma. Front Immunol 2021;12:668391. - PMC - PubMed
    1. Gargini R, Segura-Collar B, Herránz B, García-Escudero V, Romero-Bravo A, Núñez FJ, García-Pérez D, Gutiérrez-Guamán J, Ayuso-Sacido A, Seoane J, Pérez-Núñez A, Sepúlveda-Sánchez JM, Hernández-Laín A, Castro MG, García-Escudero R, Ávila J, Sánchez-Gómez P. The IDH-TAU-EGFR triad defines the neovascular landscape of diffuse gliomas. Sci Transl Med 2020;12:eaax1501 - PMC - PubMed
    1. Van den Bent MJ. Practice changing mature results of RTOG study 9802: another positive PCV trial makes adjuvant chemotherapy part of standard of care in low-grade glioma. Neuro Oncol 2014;16:1570–4 - PMC - PubMed