. 2024 Jan;103(1):91-100.
doi: 10.1177/00220345231208175. Epub 2023 Dec 6.

A PTHrP Gradient Drives Mandibular Condylar Chondrogenesis via Runx2

Affiliations

A PTHrP Gradient Drives Mandibular Condylar Chondrogenesis via Runx2

C Tsutsumi-Arai et al. J Dent Res. 2024 Jan.

Abstract

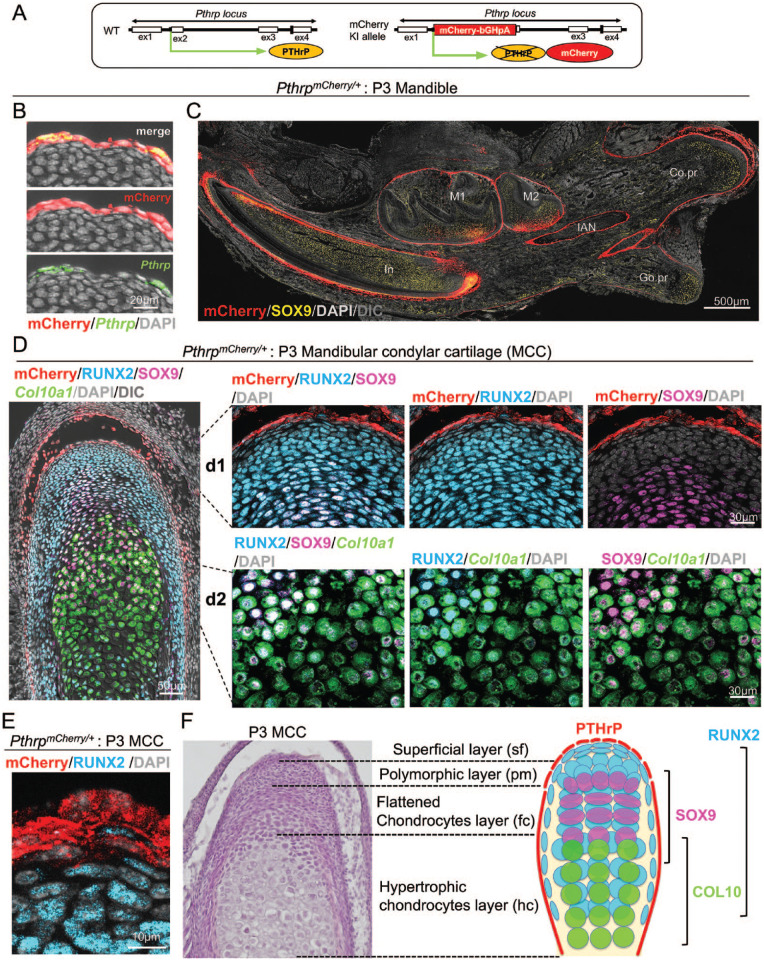
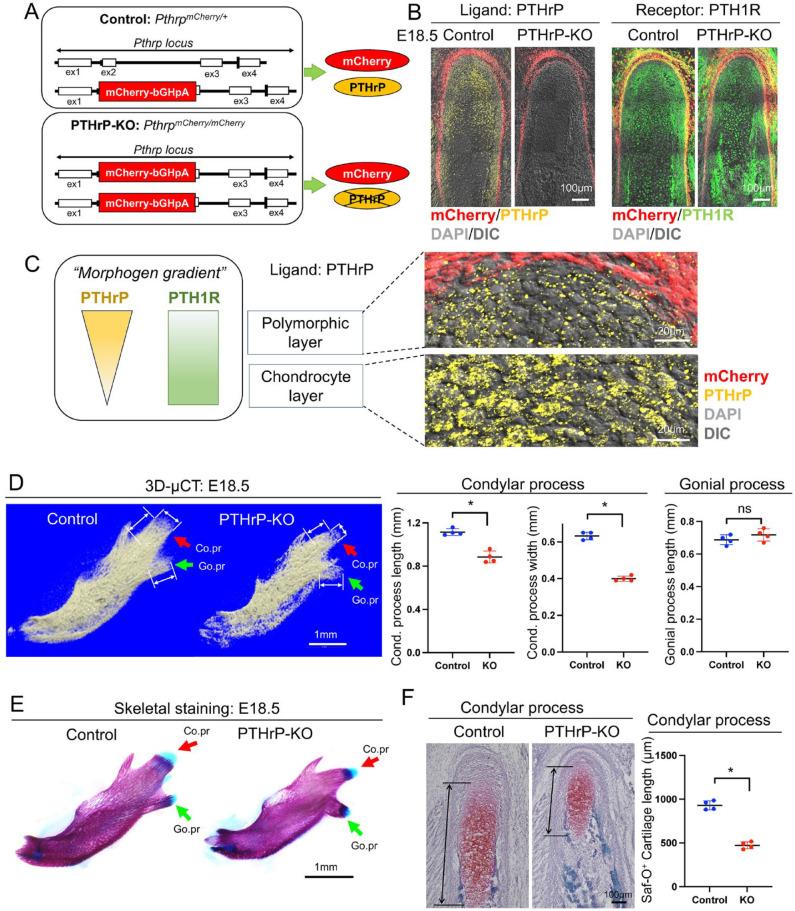
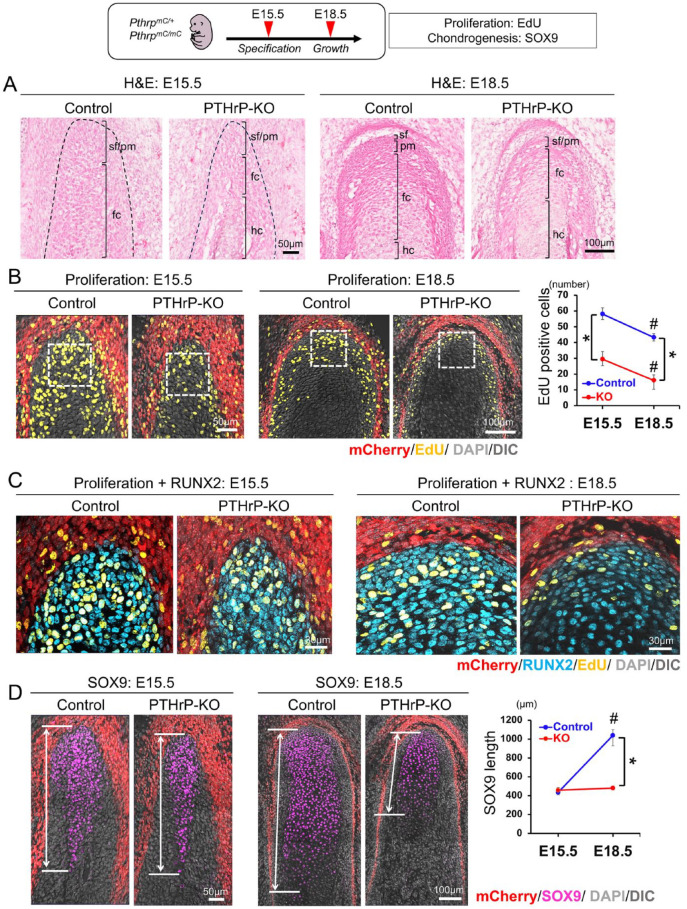
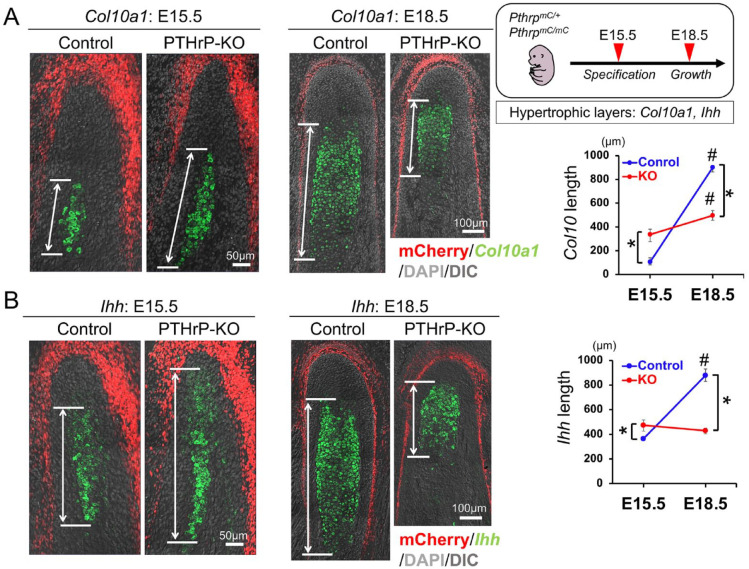
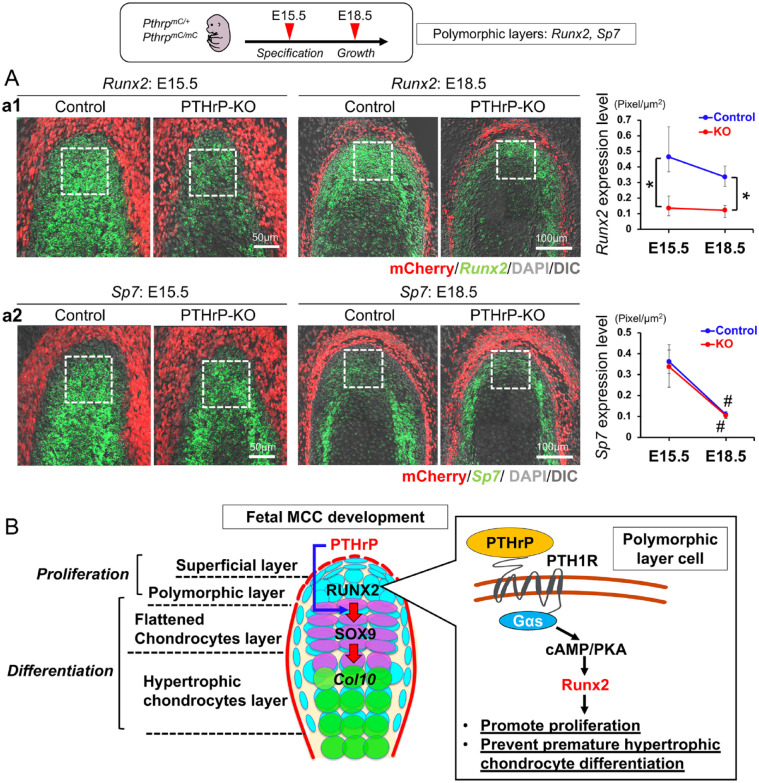
The mandibular condylar cartilage (MCC) is an essential component of the temporomandibular joint, which orchestrates the vertical growth of the mandibular ramus through endochondral ossification with distinctive modes of cell differentiation. Parathyroid hormone-related protein (PTHrP) is a master regulator of chondrogenesis; in the long bone epiphyseal growth plate, PTHrP expressed by resting zone chondrocytes promotes chondrocyte proliferation in the adjacent layer. However, how PTHrP regulates chondrogenesis in the MCC remains largely unclear. In this study, we used a Pthrp-mCherry knock-in reporter strain to map the localization of PTHrP+ cells in the MCC and define the function of PTHrP in the growing mandibular condyle. In the postnatal MCC of PthrpmCherry/+ mice, PTHrP-mCherry was specifically expressed by cells in the superficial layer immediately adjacent to RUNX2-expressing cells in the polymorphic layer. PTHrP ligands diffused across the polymorphic and chondrocyte layers where its cognate receptor PTH1R was abundantly expressed. We further analyzed the mandibular condyle of PthrpmCherry/mCherry mice lacking functional PTHrP protein (PTHrP-KO). At embryonic day (E) 18.5, the condylar process and MCC were significantly truncated in the PTHrP-KO mandible, which was associated with a significant reduction in cell proliferation across the polymorphic layer and a loss of SOX9+ cells in the chondrocyte layers. The PTHrP-KO MCC showed a transient increase in the number of Col10a1+ hypertrophic chondrocytes at E15.5, followed by a significant loss of these cells at E18.5, indicating that superficial layer-derived PTHrP prevents premature chondrocyte exhaustion in the MCC. The expression of Runx2, but not Sp7, was significantly reduced in the polymorphic layer of the PTHrP-KO MCC. Therefore, PTHrP released from cells in the superficial layer directly acts on cells in the polymorphic layer to promote proliferation of chondrocyte precursor cells and prevent their premature differentiation by maintaining Runx2 expression, revealing a unique PTHrP gradient-directed mechanism that regulates MCC chondrogenesis.

Keywords: articular cartilage; bone development; chondrocytes; mandibular condylar cartilage (MCC); periosteum; temporomandibular joint.


Conflict of interest statement

Declaration of Conflicting InterestsThe authors declared no potential conflicts of interest with respect to the research, authorship, and/or publication of this article.

Figures

Figure 1.
Figure 1.
Parathyroid hormone–related protein (PTHrP) is expressed in the superficial layer adjoining RUNX2+SOX9neg cells in the polymorphic layer. (A) Structure of Pthrp-mCherry knock-in allele. In Pthrp-mCherry allele, red fluorescent protein mCherry is expressed instead of a functional PTHrP protein, constituting a null reporter allele. (B, C) Sagittal section of Pthrp mCherry/+ mandible at postnatal day 3 (P3). (B) Magnified view of mandibular condylar cartilage (MCC). Pthrp messenger RNA RNAscope assay (in situ hybridization [ISH]). Scale bar: 20 µm. (C) Overview of the mandible. Co.pr, condylar process; Go.pr, gonial process; IAN, inferior alveolar nerve; In, incisor; M1, first molar; M2, second molar. Red: PTHrP-mCherry (IHC), yellow: SOX9-Alexa647 (IHC), gray: DAPI. Scale bar: 500 µm. n = 4 mice. (D, E) Pthrp mCherry/+ MCC at P3. (D) Scale bar: 50 µm. (d1) Magnified view of the superficial, polymorphic, and flattened chondrocytes layers. (d2) Magnified view of the hypertrophic chondrocytes layer. Red: PTHrP-mCherry (IHC), blue: RUNX2-Alexa647 (IHC), magenta: SOX9-Alexa750 (IHC), green: Col10a1-Opal520 (ISH), gray: DAPI. Scale bars: 30 µm. n = 4 mice. (E) Magnified view of MCC. Scale bar: 10 µm. (F) Hierarchical structure of MCC at P3, hematoxylin and eosin staining (left) and diagram (right) highlighting PTHrP, RUNX2, SOX9, and Col10a1 expression.
Figure 2.
Figure 2.
Parathyroid hormone–related protein (PTHrP) promotes mandibular condylar cartilage (MCC) chondrogenesis and mandibular condyle formation. (A) Pthrp locus of Control (Pthrp mCherry/+ ) and PTHrP-KO (Pthrp mCherry/mCherry ) mice. (B) Expression of the ligand (PTHrP) and the receptor (PTH1R) at E18.5. Left: PTHrP, right: PTH1R. Red: PTHrP-mCherry (in situ hybridization [ISH]), yellow: PTHrP-Alexa647 (IHC), green: PTH1R-Alexa647 (IHC), gray: DAPI. Scale bars: 100 µm. n = 4 mice. (C) Diagram of PTHrP ligand gradient regulating MCC chondrogenesis. Right panels: magnified views of PTHrP immunoreactivity, polymorphic (upper) and chondrocyte (lower) layers. Scale bars: 20 µm. (D) Three-dimensional micro–computed tomography of Control and PTHrP-KO mandibles at E18.5. Red arrow: condylar process, green arrow: gonial process. Scale bar: 1 mm. Right: quantification of the length and width of the condylar and gonial process. n = 4 mice per each group. Two-tailed, unpaired t test. Data are presented as mean ± SD. A P value of <0.05 was considered significant. (E) Skeletal staining of Control and PTHrP-KO mandibles at E18.5. Red arrow: condylar process, green arrow: gonial process. Scale bar: 1 mm. n = 4 mice. (F) Safranin O staining of Control and PTHrP-KO MCC. Scale bar: 100 µm. Right: quantification of the cartilage length (double-headed arrows). n = 4 mice per each group. Two-tailed, unpaired t test. Data are presented as mean ± SD. A P value of <0.05 was considered significant. *P <0.05, ns: not significant.
Figure 3.
Figure 3.
Parathyroid hormone–related protein (PTHrP) promotes cell proliferation in the polymorphic layer and formation of SOX9+ chondrocytes. (A) Hematoxylin and eosin (H&E) staining of Control (Pthrp mCherry/+ ) and PTHrP-KO (Pthrp mCherry/mCherry ) mandibular condylar cartilage (MCC) at E15.5 and E18.5. fc, flattened chondrocyte; hc, hypertrophic chondrocyte; pm, polymorphic; sf, superficial. Scale bars: 50 µm (E15.5), 100 µm (E18.5). (B) Cell proliferation assay of Control (Pthrp mCherry/+ ) and PTHrP-KO (Pthrp mCherry/mCherry ) MCC at E15.5 and E18.5 by EdU. White boxes (100 × 100 µm): areas used to quantify EdU+ cells. Red: PTHrP-mCherry (in situ hybridization [ISH]), yellow: EdU-Alexa480, gray: DAPI. Scale bars: 100 µm. Right: quantification of EdU+ cells in the polymorphic layer. Blue line: Control, red line: PTHrP-KO. n = 4 mice per each group. Two-tailed, 1-way analysis of variance (ANOVA) followed by Tukey’s post hoc test. Data are presented as mean ± SD. A P value of <0.05 was considered significant (*P < 0.05: between Control and PTHrP-KO, #P < 0.05: between E15.5 and E18.5). (C) Magnified views of the polymorphic layer highlighting EdU and RUNX2. Red: PTHrP-mCherry (IHC), blue: RUNX2-Alexa647 (IHC). Scale bars: 30 µm. n = 4 mice. (D) Length of SOX9+ domains (double-headed arrows) in Control and PTHrP-KO MCC at E15.5 and E18.5. Red: PTHrP-mCherry (IHC), magenta: SOX9-Alexa647 (IHC). Scale bars: 50 µm (E15.5), 100 µm (E18.5). Right: quantification of SOX9+ domain. Blue line: Control, red line: PTHrP-KO. SOX9+ domain is significantly reduced in PTHrP-KO MCC at E18.5. n = 4 mice per each group. Two-tailed, 1-way ANOVA followed by Tukey’s post hoc test. Data are presented as mean ± SD. A P value of <0.05 was considered significant (*P < 0.05: between Control and PTHrP-KO, #P < 0.05: between E15.5 and E18.5).
Figure 4.
Figure 4.
Parathyroid hormone–related protein (PTHrP) prevents premature chondrocyte differentiation and exhaustion. (A) Col10a1 expression domain (double-headed arrows) in Control (Pthrp mCherry/+ ) and PTHrP-KO (Pthrp mCherry/mCherry ) mandibular condylar cartilage (MCC) at E15.5 and E18.5. Red: PTHrP-mCherry (in situ hybridization [ISH]), green: Col10a1-Opal520 (ISH). Right: quantification of Col10a1 expression domain (double-headed arrows). n = 4 mice per each group. Two-tailed, 1-way analysis of variance (ANOVA) followed by Tukey’s post hoc test. Data are presented as mean ± SD. A P value of <0.05 was considered significant (*P < 0.05: between Control and PTHrP-KO, #P < 0.05: between E15.5 and E18.5). (B) Ihh expression domain (double-headed arrows) in Control and PTHrP-KO MCC at E15.5 and E18.5. Red: PTHrP-mCherry (IHC), green: Ihh-Opal520 (ISH). Right: quantification of Ihh expression domain (double-headed arrows). n = 4 mice per each group. Two-tailed, one-way ANOVA followed by Tukey’s post hoc test. Data are presented as mean ± SD. A P value of <0.05 was considered significant (*P < 0.05: between Control and PTHrP-KO, #P < 0.05: between E15.5 and E18.5).
Figure 5.
Figure 5.
Parathyroid hormone–related protein (PTHrP) preferentially promotes Runx2 expression in the polymorphic layer. (A) Runx2 and Sp7 (encoding Osterix) expression in Control (Pthrp mCherry/+ ) and PTHrP-KO (Pthrp mCherry/mCherry ) mandibular condylar cartilage (MCC) polymorphic layer at E15.5 and E18.5. (a1) Runx2 expression at E15.5 and 18.5. Red: PTHrP-mCherry (in situ hybridization [ISH]), green: Runx2-Opal520 (ISH). Right: quantification of Runx2 expression level. (a2) Sp7 expression at E15.5 and E18.5. Red: PTHrP-mCherry (IHC), green: Sp7-Opal520 (ISH). Right: quantification of Sp7 expression level. n = 4 mice per each group. Two-tailed, 1-way analysis of variance followed by Tukey’s post hoc test. Data are presented as mean ± SD. A P value of <0.05 was considered significant (*P < 0.05: between Control and PTHrP-KO, #P < 0.05: between E15.5 and E18.5). (B) Concluding diagram. PTHrP released from the superficial layer acts on cells in the polymorphic layer, promotes proliferation of chondrocyte precursor cells in the polymorphic layer, and prevents their premature differentiation by stimulating Runx2 expression through the PTHrP-PTH1R signaling pathway.

Similar articles

References

    1. Bechtold TE, Kurio N, Nah HD, Saunders C, Billings PC, Koyama E. 2019. The roles of Indian hedgehog signaling in TMJ formation. Int J Mol Sci. 20(24):6300. - PMC - PubMed
    1. Bender ME, Lipin RB, Goudy SL. 2018. Development of the pediatric temporomandibular joint. Oral Maxillofac Surg Clin North Am. 30(1):1–9. - PubMed
    1. Gurdon JB, Bourillot PY. 2001. Morphogen gradient interpretation. Nature. 413(6858):797–803. - PubMed
    1. Hinton RJ. 2014. Genes that regulate morphogenesis and growth of the temporomandibular joint: a review. Dev Dyn. 243(7):864–874. - PubMed
    1. Kantomaa T, Tuominen M, Pirttiniemi P. 1994. Effect of mechanical forces on chondrocyte maturation and differentiation in the mandibular condyle of the rat. J Dent Res. 73(6):1150–1156. - PubMed

Publication types

Substances

LinkOut - more resources