. 2024 Feb;31(2):322-333.
doi: 10.1038/s41417-023-00705-z. Epub 2023 Dec 6.

PLK1 and its substrate MISP facilitate intrahepatic cholangiocarcinoma progression by promoting lymphatic invasion and impairing E-cadherin adherens junctions

Affiliations

PLK1 and its substrate MISP facilitate intrahepatic cholangiocarcinoma progression by promoting lymphatic invasion and impairing E-cadherin adherens junctions

Yi-Ru Pan et al. Cancer Gene Ther. 2024 Feb.

Abstract

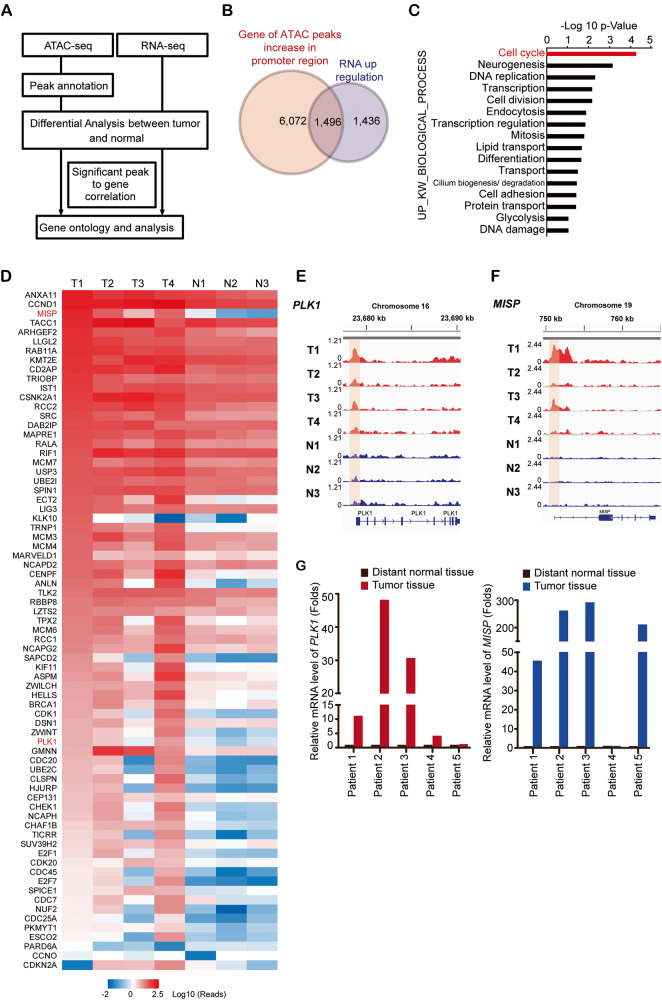
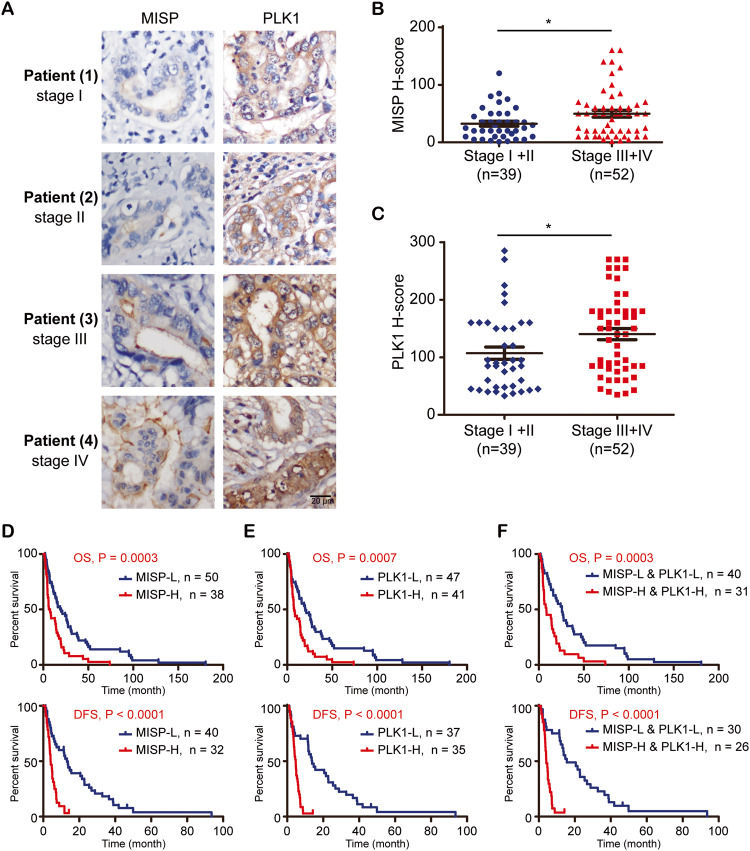
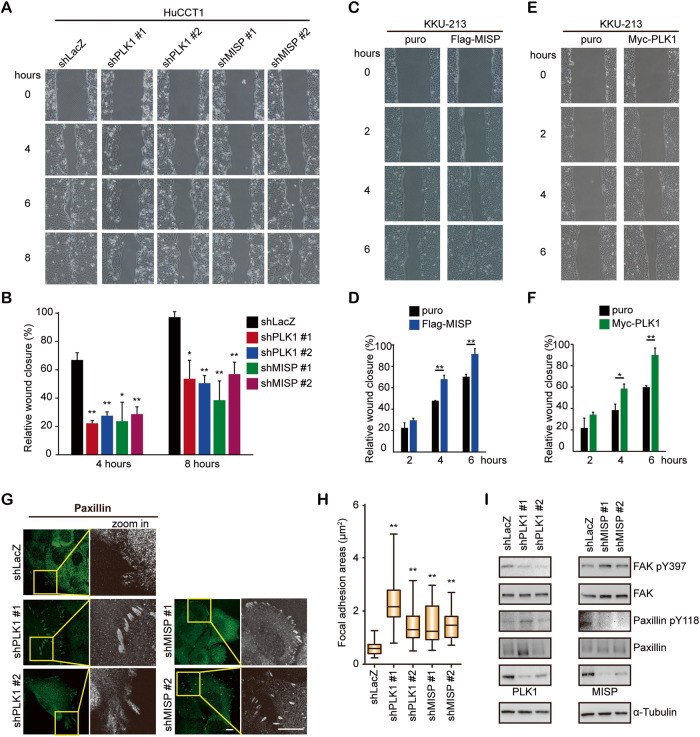
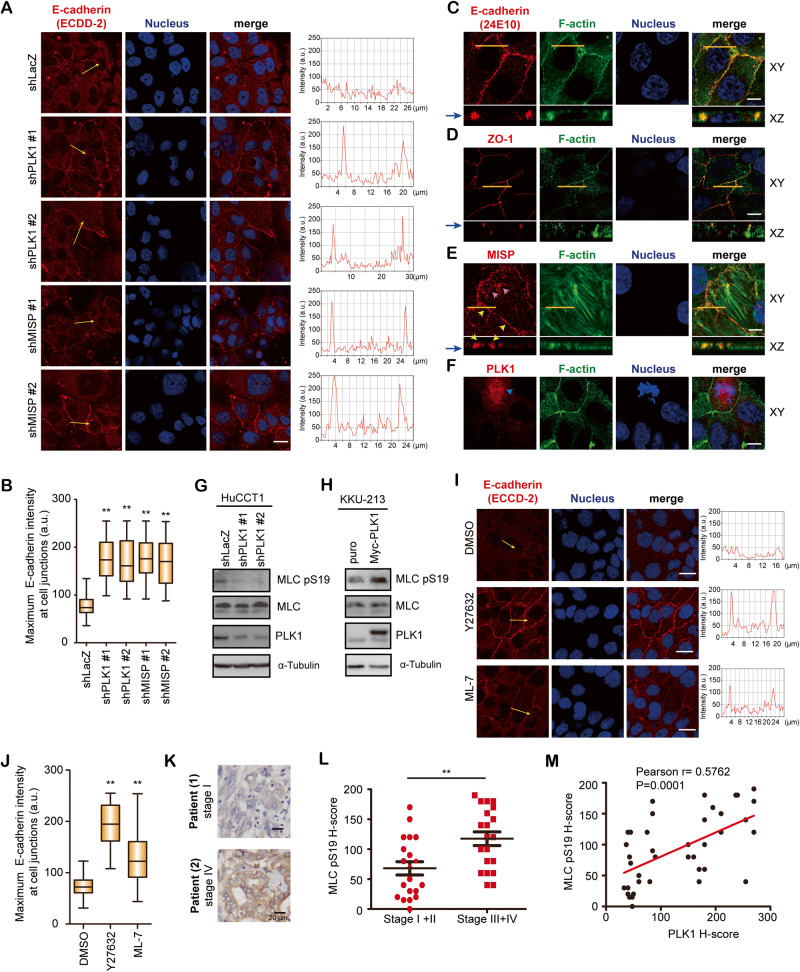
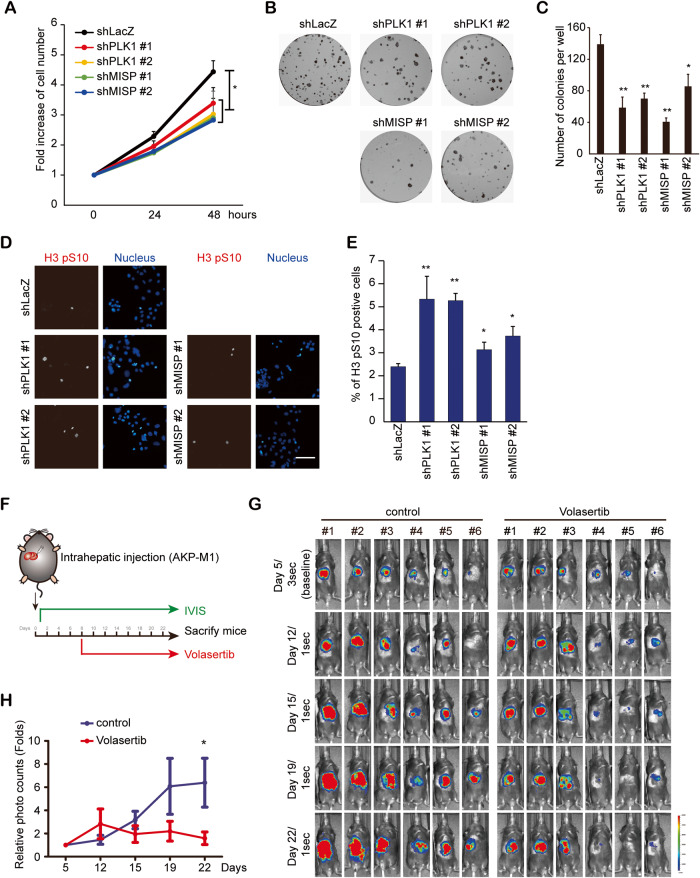
Intrahepatic cholangiocarcinoma (iCCA) is a subtype of CCA and has a high mortality rate and a relatively poor prognosis. However, studies focusing on increased cell motility and loss of epithelial integrity during iCCA progression remain relatively scarce. We collected seven fresh tumor samples from four patients to perform RNA sequencing (RNA-seq) and assay for transposase-accessible chromatin using sequencing (ATAC-seq) to determine the transcriptome profile and chromatin accessibility of iCCA. The increased expression of cell cycle regulators, including PLK1 and its substrate MISP, was identified. Ninety-one iCCA patients were used to validate the clinical significance of PLK1 and MISP. The upregulation of PLK1 and MISP was determined in iCCA tissues. Increased expression of PLK1 and MISP was significantly correlated with tumor number, N stage, and lymphatic invasion in an iCCA cohort. Knockdown of PLK1 or MISP reduced trans-lymphatic endothelial migration and wound healing and affected focal adhesions in vitro. In cell‒cell junctions, MISP localized to adherens junctions and suppressed E-cadherin dimerization. PLK1 disrupted adherens junctions in a myosin-dependent manner. Furthermore, PLK1 and MISP promoted cell proliferation in vitro and tumorigenesis in vivo. In iCCA, PLK1 and MISP promote aggressiveness by increasing lymphatic invasion, tumor growth, and motility through the repression of E-cadherin adherens junctions.


Conflict of interest statement

The authors declare no competing interests.

Figures

Fig. 1
Fig. 1. The expression of PLK1 and its substrate MISP was upregulated in intrahepatic cholangiocarcinoma (iCCA).
A A schema showing the process for identifying the 1496 genes for the analysis. B A total of 1496 genes were identified from the intersection of 7568 increased accessibility regions by ATAC-seq analysis and 2932 upregulated genes by RNA-seq analysis. C The biological process analysis of the increased genes in Supplementary Table 2 shows the possible pathways involved in iCCA carcinogenesis. D A heatmap analysis of gene expression showed a ranking of cell cycle gene expression in tumor samples (T1, T2, T3, and T4) and their distant normal liver samples (N1, N2, and N3) from iCCA patients. E Comparison of representative ATAC-seq gene tracks at the PLK1 locus from 3 normal tissues and 4 tumor tissues from iCCA patients. F Comparison of representative ATAC-seq gene tracks at the MISP locus from 3 normal tissues and 4 tumor tissues from iCCA patients. G The relative mRNA levels of PLK1 and MISP in tumor samples (red: PLK1; blue: MISP) and their distant normal liver samples (black) from five iCCA patients. The values are presented as the fold change relative to the level of their distant normal liver samples.
Fig. 2
Fig. 2. The expression levels of PLK1 and MISP were associated with poor prognosis and were increased in patients with late-stage iCCA.
A Representative pictures of immunohistochemical staining of MISP and PLK1 in iCCA specimens. The clinical stage of each patient is indicated. B Distribution of the H score for MISP expression from iCCA patients (n = 91). *P < 0.05 by Student’s t test. C Distribution of the H score for PLK1 expression from iCCA patients (n = 91). *P < 0.05 by Student’s t test. D Kaplan‒Meier plots of overall survival (OS) and disease-free survival (DFS) of iCCA patients with high MISP expression (MISP-H; >mean) and low MISP expression (MISP-L; <mean). The P values shown in the panel were determined by the log-rank test. E Kaplan‒Meier plots of OS and DFS of iCCA patients with high PLK1 expression (PLK1-H; >mean) and low PLK1 expression (PLK1-L; <mean). The P values shown in the panel were determined by the log-rank test. F. Kaplan‒Meier plots of OS and DFS of iCCA cancer patients with both high PLK1 and high MISP expression and both low PLK1 and low MISP expression. The P values shown in the panel were determined by the log-rank test.
Fig. 3
Fig. 3. MISP and PLK1-mediated lymphatic invasion in iCCA cells.
A Western blots showing the levels of PLK1 and MISP in HuCCT1 cells that received shRNAs specific to PLK1 (shPLK1 #1 and #2), MISP (shMISP #1 and #2) or LacZ (shLacZ). α-Tubulin was the loading control. B Schema of the experimental procedure for the trans-lymphatic endothelial migration assay. C Representative images from the trans-lymphatic endothelial migration of 5 × 104 HuCCT1 cells that received shRNAs specific to PLK1 (shPLK1 #1 and #2), MISP (shMISP #1 and #2) or LacZ (shLacZ). D The number of migrated cells was calculated per well. The values (mean ± SD) presented are from three independent experiments. **P < 0.005 by Student’s t tests. E Schema of the experimental procedure for the selection procedures for the generation of invasive sublines HuCCT1-N1 (N1), HuCCT1-N2 (N2), HuCCT1-N3 (N3), and HuCCT1-N4 (N4) from HuCCT1 (parental). F Representative images of the trans-lymphatic endothelial migration of 2 × 104 HuCCT1-derived sublines. G Western blots showing the levels of phosphorylated PLK1, total PLK1, and total MISP in HuCCT1-derived sublines. α-Tubulin was the loading control. H Western blots showing the levels of PLK1 and MISP in the HuCCT1-N4 subline receiving shRNAs specific to PLK1 (shPLK1 #1 and #2), MISP (shMISP #1 and #2) or LacZ (shLacZ). α-Tubulin was the loading control. I Representative images from the translymphatic endothelial migration of 2 × 104 HuCCT1-N4 cells receiving shRNAs specific to PLK1 (shPLK1 #1 and #2), MISP (shMISP #1 and #2) or LacZ (shLacZ). J The number of migrated cells was calculated per well. The values (mean ± SD) presented are from three independent experiments. *P < 0.005; **P < 0.005 by Student’s t tests.
Fig. 4
Fig. 4. MISP and PLK1 regulated cell migration in iCCA cells.
A Representative images from the wound-healing assay of HuCCT1 cells that received shRNAs specific to PLK1 (shPLK1 #1 and #2), MISP (shMISP #1 and #2) or LacZ (shLacZ). B. The relative wound closure was calculated by analyzing the scratched area covered by the cells after four or eight hours using ImageJ software. The values (means ± SDs) are from three independent experiments and are presented as a percentage relative to the baseline (0 h). *P < 0.05, **P < 0.005 by Student’s t test. C Representative images from the wound-healing assay of vector (puro) or Flag-tagged wild-type MISP (Flag-MISP)-overexpressing KKU-213 cells. D The relative wound closure was calculated by analyzing the scratched area covered by the cells after two, four or six hours using ImageJ software. The values (means ± SDs) are from three independent experiments and are presented as a percentage relative to the baseline (0 h). **P < 0.005 by Student’s t test. E Representative images from the wound-healing assay of vector (puro) or Myc-tagged PLK1 wild-type (Myc-PLK1)-overexpressing KKU-213 cells. F The relative wound closure was calculated by analyzing the scratched area covered by the cells after two, four or six hours using ImageJ software. The values (means ± SDs) are from three independent experiments and are presented as a percentage relative to the baseline (0 h). *P < 0.05; **P < 0.005 by Student’s t test. G HuCCT1 cells that received shRNAs specific to PLK1 (shPLK1 #1 and #2), MISP (shMISP #1 and #2), or LacZ (shLacZ) were fixed and stained with paxillin (focal adhesion marker). The boxed areas of paxillin from the images are enlarged. Scale bar = 10 µm. H The values of the focal adhesion area are from three independent experiments (n = 30). Box-and-whisker plots show the distribution of the data: maximum, upper quartile, median, lower quartile, and sample minimum. **P < 0.005 by Student’s t test. I Western blots showing the levels of phosphorylated FAK, total FAK, phosphorylated paxillin, total paxillin, total PLK1, and total MISP in HuCCT1 cells that received shRNAs specific to PLK1 (shPLK1 #1 and #2), MISP (shMISP #1 and #2) or LacZ (shLacZ). α-Tubulin was the loading control.
Fig. 5
Fig. 5. Knockdown of PLK1 or MISP enhanced adherens junctions in HuCCT1 cells.
A Left: HuCCT1 cells that received shRNAs specific to PLK1 (shPLK1 #1 and #2), MISP (shMISP #1 and #2), or LacZ (shLacZ) were grown to confluence and stained with E-cadherin (ECCD-2, red) and nuclear stain (blue). Scale bar = 20 µm. Right: the profiles show the relative fluorescence intensity of the yellow lines in the E-cadherin images. B Quantification of the maximum E-cadherin intensity per cell. The values are from three independent experiments (n = 300). Box-and-whisker plots show the distribution of the data: maximum, upper quartile, median, lower quartile, and sample minimum. **P < 0.005 by Student’s t tests. CF HuCCT1 cells were grown to confluence and stained for E-cadherin (24E10, red, C), ZO-1 (red, D), MISP (red, E), PLK1 (red, F), F-actin (green), and nuclear stain (blue). Orange lines on confocal XY section images represent regions where confocal XZ section images were taken. Yellow arrows indicate MISP at cell junctions; pink arrows indicate MISP at focal adhesions; blue arrows indicate PLK1 at spindles. Scale bar = 10 µm. Blue arrows in (C), (D), and (E) indicate the Z positions for the XY images. G Western blots showing the levels of the indicated proteins in HuCCT1 cells receiving shRNAs specific to PLK1 (shPLK1 #1 and #2) or LacZ (shLacZ). α-Tubulin was the loading control. H. HuCCT1 cells overexpressing vector (puro) or Myc-tagged PLK1 wild type (Myc-PLK1) were arrested at the beginning of S phase using a double thymidine block. Western blots showing the levels of the indicated proteins in the cells. α-Tubulin was the loading control. I HuCCT1 cells were grown to confluence and then treated with 10 μM Y27632, 10 μM ML-7 or control DMSO for 24 h. The cells were fixed and stained with E-cadherin (ECCD-2, red) and nuclear stain (blue). Scale bar = 20 µm. The profiles show the relative fluorescence intensity of the yellow lines in the E-cadherin images. J Quantification of the maximum E-cadherin intensity per cell. The values are from three independent experiments (n = 300). Box-and-whisker plots show the distribution of the data: maximum, upper quartile, median, lower quartile, and sample minimum. **P < 0.005 by Student’s t tests. K Representative pictures of immunohistochemical staining of MLC phosphorylation (MLC pS19) in iCCA specimens. The clinical stage of each patient is indicated. Scale bar: 20 μm. L Distribution of the H score for MLC phosphorylation (MLC pS19) from iCCA patients (n = 40). **P < 0.005 by Student’s t test. M The association between MLC phosphorylation and PLK1 expression in 40 patients. The Pearson correlation coefficient r and P values are shown in the panel.
Fig. 6
Fig. 6. Knockdown of PLK1 or MISP impaired tumor growth in vitro and in vivo.
A A cell proliferation assay. HuCCT1 cells that received shRNAs specific to PLK1 (shPLK1 #1 and #2), MISP (shMISP #1 and #2) or LacZ (shLacZ) were seeded in a 96-well plate for 0, 24 or 48 h. Cell viability was quantified by the CCK-8 assay. The values (means ± SDs) are from three independent experiments and are presented as the fold change relative to the baseline (0 h). *P < 0.05 by Student’s t test. B Representative images of the colony formation assay. HuCCT1 cells (500 cells/well) that received shRNAs specific to PLK1 (shPLK1 #1 and #2), MISP (shMISP #1 and #2) or LacZ (shLacZ) were seeded in a six-well plate for 14 days. C The values (means ± SDs) are from three independent experiments; *P < 0.05, **P < 0.005 by Student’s t test. D HuCCT1 cells that received shRNAs specific to PLK1 (shPLK1 #1 and #2), MISP (shMISP #1 and #2) or LacZ (shLacZ) were fixed and stained with Histone 3 Ser10 phosphorylation (H3 pS10) and nuclear stain. Scale bar = 100 µm. E Quantification of the p-Ser10 H3-positive cells (n > 1000). The values (means ± SDs) are from three independent experiments. *P < 0.05; **P < 0.005 by Student’s t test. F Schema showing the experimental design of the mouse experiment. G AKP-M1 cells were injected into the right lobes of the livers of C57BL/6J mice. Volasertib (25 mg/kg) was injected twice a week after one week of tumor injection. Mouse bioluminescent signals were detected on the indicated days after tumor injection. The exposure times for images on the indicated days are indicated. H The relative bioluminescent intensities (means ± SEMs) from six mice are presented as the fold change relative to the baseline (Day 5). *P < 0.05 by Student’s t test.

Similar articles

Cited by

References

    1. Valle JW, Lamarca A, Goyal L, Barriuso J, Zhu AX. New horizons for precision medicine in biliary tract cancers. Cancer Discov. 2017;7:943–62. doi: 10.1158/2159-8290.CD-17-0245. - DOI - PMC - PubMed
    1. Duffy MJ, Shering S, Sherry F, McDermott E, O’Higgins N. CA 15-3: a prognostic marker in breast cancer. Int J Biol Markers. 2000;15:330–3. doi: 10.1177/172460080001500410. - DOI - PubMed
    1. Shaib Y, El-Serag HB. The epidemiology of cholangiocarcinoma. Semin Liver Dis. 2004;24:115–25. doi: 10.1055/s-2004-828889. - DOI - PubMed
    1. Khan SA, Thomas HC, Davidson BR, Taylor-Robinson SD. Cholangiocarcinoma. Lancet. 2005;366:1303–14. doi: 10.1016/S0140-6736(05)67530-7. - DOI - PubMed
    1. Blechacz B, Komuta M, Roskams T, Gores GJ. Clinical diagnosis and staging of cholangiocarcinoma. Nat Rev Gastroenterol Hepatol. 2011;8:512–22. doi: 10.1038/nrgastro.2011.131. - DOI - PMC - PubMed

Publication types

MeSH terms