. 2024 Feb 9;52(3):1156-1172.
doi: 10.1093/nar/gkad1176.

Spatial regulation of DNA damage tolerance protein Rad5 interconnects genome stability maintenance and proteostasis networks

Affiliations

Spatial regulation of DNA damage tolerance protein Rad5 interconnects genome stability maintenance and proteostasis networks

Carl P Lehmann et al. Nucleic Acids Res. .

Abstract

The Rad5/HLTF protein has a central role in the tolerance to DNA damage by mediating an error-free mode of bypassing unrepaired DNA lesions, and is therefore critical for the maintenance of genome stability. We show in this work that, following cellular stress, Rad5 is regulated by relocalization into two types of nuclear foci that coexist within the same cell, which we termed 'S' and 'I'. Rad5 S-foci form in response to genotoxic stress and are associated with Rad5's function in maintaining genome stability, whereas I-foci form in the presence of proteotoxic stress and are related to Rad5's own proteostasis. Rad5 accumulates into S-foci at DNA damage tolerance sites by liquid-liquid phase separation, while I-foci constitute sites of chaperone-mediated sequestration of Rad5 at the intranuclear quality control compartment (INQ). Relocalization of Rad5 into each type of foci involves different pathways and recruitment mechanisms, but in both cases is driven by the evolutionarily conserved E2 ubiquitin-conjugating enzyme Rad6. This coordinated differential relocalization of Rad5 interconnects DNA damage response and proteostasis networks, highlighting the importance of studying these homeostasis mechanisms in tandem. Spatial regulation of Rad5 under cellular stress conditions thus provides a useful biological model to study cellular homeostasis as a whole.


Figures

Graphical Abstract
Graphical Abstract
Figure 1.
Figure 1.
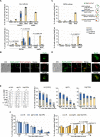
Rad5 is recruited into two types of nuclear foci in response to MMS treatment. (A) Fluorescence microscopy analysis of Rad5 foci formation. Cycling RAD5-yeGFP cells (YCL46 strain) were examined after treatment with 0.033% MMS for 60 min. Arrows indicate some foci examples. (B) Percentage of cells containing Rad5 foci in asynchronous cultures (data from A) and at different stages of the cell cycle. For G1 analysis, cells (YCL46 strain) were synchronized using α factor and held in G1 (–/+0.033% MMS, 60 min). For S phase analysis, G1-synchronized cells were released into S phase in fresh medium (+0.033% MMS, 60 min, or without MMS, 30 min). For G2/M analysis, cells were synchronized with nocodazole and held in G2/M (–/+0.033% MMS, 60 min). (C) Analysis of Rad5 foci subnuclear localization after MMS treatment (0.033% MMS, 60 min, logarithmic cultures). The figure shows quantification of the percentage of cells in which Rad5-yeGFP colocalizes with proteins that mark different nuclear structures: SPC42-eqFP (YCL171 strain), Rap1-mCherry (YCL173), Nop1-mCherry (YCL146), Nup84-mCherry (YCL169) or Cmr1-mCherry (YCL51). (D, E) Colocalization of Rad5-foci with Cmr1-foci (YCL51 strain). G1- (D) and S-phase (E) analyses were as described in (B). (F) Percentage of cells containing Rad5 or Cmr1 foci, from (D, E). (G) Percentage of cells containing Rad5 foci and their colocalization patterns with Cmr1 foci, from (D, E). Rad5 I- and S-foci are delineated in brackets. A diagram of the possible colocalization patterns between Rad5 and Cmr1 foci is shown. In all cases, the bar graphs represent the mean ± SD from three independent experiments. DIC: differential interference contrast (Nomarski): GFP: green fluorescent protein.
Figure 2.
Figure 2.
Rad6 is required for Rad5 S- and I-foci formation via distinct pathways. (A) Both Rad5 S- and I-foci depend on Rad6, and S-foci on Rad6/Rad18-mediated PCNA ubiquitylation. For S phase analysis, G1-synchronized cells were released into S phase in fresh medium (+0.033% MMS, 60 min) and analysed by fluorescence microscopy. Left panel shows data quantification. A diagram of the possible colocalization patterns between Rad5 and Cmr1 foci is shown. Right panel displays percentage of cells containing each type of Rad5 foci. The percentage of Rad5 I- or S-foci was calculated based on the total population of cells analysed using the data from left panel. Statistical significance was calculated between the percentage of cells with Rad5 I- or S-foci in the wild type-control and the corresponding Rad5 foci type of each mutant. Strains: wt-control (RAD5-yeGFP CMR1-mCherry, YCL51), rad6Δ (YCL149), rad18Δ (YCL126), pol30-K164R (YCL122), siz1Δ (YCL132). (B) Rad6/Bre1/histone H2B and Rad6/Ubr2/Rpn4 pathways contribute to Rad5 I-foci formation. For S phase analysis, G1-synchronized cells were released into S phase in fresh medium (+0.033% MMS, 60 min) and analysed by fluorescence microscopy. Left panel shows data quantification of the fluorescence microscopy analysis. Right panel displays percentage of cells containing each type of Rad5 foci, calculated based on the total population of cells analysed using the data from left panel. Statistical significance was calculated between the percentage of cells with Rad5 I-foci or S-foci in the wild type-control and each mutant. Strains: wt-control (YCL51), rad6Δ (YCL149), ubr1Δ (YCL151), bre1Δ (YCL133), htb1/htb2-K123A hmlΔ (YCL231), hmlΔ (YCL232), ubr2Δ (YCL154), rpn4Δubr2Δ (YCL237), bre1Δubr2Δ (YCL156), rad18Δbre1Δubr2Δ (YCL177). wt-control and rad6Δ data are the same as in (A). The htb1/htb2-K132A mutant was combined with deletion of the HML locus to make cells responsive to α factor pheromone. (C) Rad6/Bre1/histone H2B and Rad6/Ubr2/Rpn4 pathways contribute to Rad5 I-foci formation. For G1 analysis, cells were synchronized using α factor and held in G1 (+0.033% MMS, 60 min). Left panel shows data quantification of the fluorescence microscopy analysis. Right panel displays percentage of cells containing each type of Rad5 foci, calculated based on the total population of cells analysed using the data from left panel. Statistical significance was calculated between the percentage of cells with Rad5 I-foci in the wild type-control and each mutant. Strains: wt-control (YCL51), bre1Δ (YCL133), htb1/htb2-K123A hmlΔ (YCL231), hmlΔ (YCL232), ubr2Δ (YCL154), rpn4Δubr2Δ (YCL237), bre1Δubr2Δ (YCL156). In all cases, the bar graphs represent the mean ± SD from three independent experiments. Only statistically significant P values (P < 0.01) are shown.
Figure 3.
Figure 3.
Rad5 is recruited into I- or S-foci by different mechanisms. (A, B) Btn2 is required for Rad5 I-foci formation. For S phase analysis (left panels), G1-synchronized cells were released into S phase in fresh medium (+0.033% MMS, 60 min) and analysed by fluorescence microscopy. For G1 analysis (right panels), cells were synchronized using α factor and held in G1 (+0.033% MMS, 60 min). (A) Data quantification of the fluorescence microscopy analysis. A diagram of the possible colocalization patterns between Rad5 and Cmr1 foci is shown. (B) Percentage of cells containing each type of Rad5 foci, calculated based on the total population of cells analysed using the data from (A). Statistical significance was calculated between the percentage of cells with Rad5 I-foci in the wild type-control and each mutant. wt-control data are the same as in Figure 2. Strains: wt-control (YCL51), btn2Δ (YCL148), rad18Δbtn2Δ (YCL198). (C, D) Btn2 forms foci that colocalize with Rad5 I-foci and depend on Rad6. Analysis of cycling cells (–/+0.033% MMS, 60 min). (C) Example photo of RAD6+ cells. (D) Upper panel: data quantification of Btn2 foci and their colocalization with Rad5 foci. Lower panel: percentage of cells containing Btn2 or Rad5 foci in RAD6+ or rad6Δ cells, calculated based on the total population of cells analysed using the data from the above panel. Statistical significance was calculated between the percentage of cells with Btn2-foci in RAD6+ and the rad6Δ mutant. Strains: RAD5-yeGFP BTN2-mCherry (YCL175), rad6Δ RAD5-yeGFP BTN2-mCherry (YCL208). (E, F) Rad5 S-foci are very likely formed by liquid-liquid phase separation. Cycling cells (RAD5-yeGFP CMR1-mCherry, YCL51 strain) were treated with 0.033% MMS, 60 min. The culture was then split in two and grown for an additional 60 min in the presence of 0.033% MMS, with the addition of 2.5% 1,6-hexanediol and 1 μg/ml digitonin, or just digitonin (control). (E) Example photos. (F) Upper panel: data quantification showing the percentage of cells containing each type of foci before and after hexanediol treatment. Lower panel: percentage of cells containing each type of Rad5 foci, calculated based on the total population of cells analysed using the data from the above panel. Statistical significance was calculated between the percentage of cells treated 60 min with 0.033% MMS containing Rad5 I- or S-foci and the corresponding Rad5 foci type after treatment or not with hexanediol. In all cases, the bar graphs represent the mean ± SD from three independent experiments. Only statistically significant P values (P < 0.01) are shown.
Figure 4.
Figure 4.
Rad5 S- and I- foci form in response to genotoxic and proteotoxic stress, respectively. (A) MMS dose affects Rad5 relocalization. Cycling cells were treated as indicated for 60 min and analysed by microscopy. Upper panel: percentage of cells containing each type of Rad5 foci. A diagram of the possible colocalization patterns between Rad5 and Cmr1 foci is shown. Lower panel: percentage of cells containing each type of Rad5 foci, calculated based on the total population of cells analysed using the data from the above panel. Statistical significance was calculated between the percentage of cells treated with 0.033% MMS containing Rad5 I- or S-foci and the corresponding Rad5 foci type of the other treatment conditions. Strains: wt-control (RAD5-yeGFP CMR1-mCherry, YCL51), rad18Δ RAD5-yeGFP CMR1-mCherry (YCL126). (B,C) Rad5 foci formation in response to different drugs. Cycling cells were treated for 60 min, except AZC (120 min) as follows: 200 mM HU, 0.5 mM cisplatin, 0.5 μg/ml 4NQO, 100 μg/ml zeocin, 0.4 mM H2O2, 1 mg/ml AZC. DMSO (solvent) is a control for cisplatin. Strains: YCL51, YCL126. (B) Example photos. (C) Left panel: quantification of Rad5 foci. Right panel: percentage of cells containing each type of Rad5 foci, calculated based on the total population of cells analysed using the data from the left panel. Statistical significance was calculated between the percentage of untreated cells containing I-foci, S-foci, or undefined Rad5-foci and the corresponding Rad5 foci type of the other treatment conditions. Strains: wt-control (RAD5-yeGFP CMR1-mCherry, YCL51), rad18Δ RAD5-yeGFP CMR1-mCherry (YCL126). (D) Analysis of spontaneous Rad5 foci in untreated DNA repair mutants. Cycling cells were analysed by fluorescence microscopy. Left panel: quantification of Rad5 foci. Right panel: percentage of cells containing each type of Rad5 foci, calculated based on the total population of cells analysed using the data from the left panel. Statistical significance was calculated between the percentage of cells with each type of Rad5 foci in the wild type-control and the corresponding Rad5 foci type of each mutant. Strains: wt-control (YCL51), rad52Δ (YCL199), rad14Δ (YCL183), apn1Δ (YCL131), apn1Δ rad14Δ (YCL202), rad18Δ apn1Δ rad14Δ (YCL239). In all cases, the bar graphs represent the mean ± SD from three independent experiments. Only statistically significant P values (P < 0.01) are shown.
Figure 5.
Figure 5.
Rad5 S-foci are linked to sites of DDT function. (A, B) Colocalization of Rad5-foci and Rad18-foci in btn2Δ cells. G1-synchronized cells were released into S phase in fresh medium (+0.033% MMS, 60 min) and analysed by fluorescence microscopy. (A) Example photo. (B) Left panel: quantification of the number of cells containing Rad18-foci or Rad5-foci. Right panel: quantification of Rad5-foci overlap with Rad18-foci. Strain: btn2Δ RAD18-yeGFP RAD5-mCherry (YCL241). (C, D) Rad5 S-foci localize to PORTs. G1-synchronized cells were released into S phase (+MMS 0.033%, 60 min) and analysed by fluorescence microscopy. (C) Example photos. (D) Left panel: quantification of the number of cells containing Rad5-foci or Rfa-foci. Right panel: quantification of Rad5-foci overlap with Rfa1-foci. Strain: RAD5-yeGFP RFA1-mCherry (YCL57). (E, F) Rad5’s HIRAN domain is required for S-foci formation. G1-synchronized cells were released into S phase (+MMS 0.033%, 60 min) and analysed by fluorescence microscopy. (E) Example photo. (F) Left panel: quantification of Rad5 foci. A diagram of the possible colocalization patterns between Rad5 and Cmr1 foci is shown. Right panel: percentage of cells containing each type of Rad5 foci, calculated based on the total population of cells analysed using the data from the left panel. Statistical significance was calculated between the percentage of cells with Rad5 I- or S-foci in the wild type-control and the corresponding Rad5 foci type of the rad5-3RE mutant. Strains: wt control (YCL51), rad5-3RE-yeGFP (YCL186). (G) Cell viability analysis. G1-synchronized cells were released into S phase (–/+ 0.033% MMS) to study cell viability. Left panel: cell cycle progression was monitored by flow cytometry. Right panel: sensitivity to MMS during S phase. Strains: YCL51, YCL186. (H) Rad5 foci formation does not require the S-phase checkpoint. G1-synchronized cells were released into S phase (+MMS 0.033%, 60 min) and analysed by fluorescence microscopy. Upper panel: quantification of Rad5 foci. wt-control data are as in (F). Lower panel: percentage of cells containing each type of Rad5 foci, calculated based on the total population of cells analysed using the data from the above panel. Strains: wt-control (YCL51), rad53Δsml1Δ (YCL137), mec1Δsml1Δ (YCL152). In all cases, the bar graphs or values represent the mean ± SD from three independent experiments. Only statistically significant P values (P < 0.01) are shown.
Figure 6.
Figure 6.
I-foci are sites of recruitment of non-functional Rad5 for later refolding. (A, B) Combined MMS and MG132 treatment increases Rad5 I-foci and bypasses the Rad6 dependency. Cycling cells were treated for 60 min with either 0.033% MMS, 75 μg/ml MG132, or both. DMSO (solvent) is a control for MG132. (A) Upper panel: quantification of Rad5 foci. A diagram of the possible colocalization patterns between Rad5 and Cmr1 foci is shown on the far right of the Figure. Lower panel: percentage of cells containing each type of Rad5 foci, calculated based on the total population of cells analysed using the data from the upper panel. Statistical significance between the number of cells with I-foci comparing relevant treatment conditions is shown. (B) Example photo of rad6Δ cells treated with MMS + MG132. Strains: wt-control (YCL51), rad6Δ (YCL149). (C, D) Combined MMS and MG132 treatment allows for formation of Rad5 I-foci during G2/M phase. G2/M synchronized cells were treated for 60 min with either 0.033% MMS, 75 μg/ml MG132, or both. DMSO (solvent) is a control for MG132. (C) Upper panel: quantification of Rad5 foci. Lower panel: percentage of cells containing each type of Rad5 foci, calculated based on the total population of cells analysed using the data from the upper panel. Statistical significance between the number of cells with I-foci comparing relevant treatment conditions is shown. (D) Example photo of G2/M cells treated with MMS + MG132. Strain: YCL51. (E, F) Rad5-foci resolution time course. I-foci resolution requires the Hsp104 disaggregase. G1-synchronized cells were released into S phase (+0.033% MMS, 60 min). MMS was removed and cells were allowed to progress in S phase for 120 min, monitored by flow cytometry (E, left panel), with samples taken for microscopy analysis. Right panel: quantification of the percentage of cells with each type of Rad5 foci during the experiment. (F) Left panel: percentage of cells containing Rad5 S-foci. Right panel: percentage of cells containing Rad5 I-foci. All percentages were calculated based on the total population of cells analysed using the data from (E). Relevant P values are shown. Strains: wt-control (YCL51), apj1Δ (YCL212), hsp104Δ (YCL165). The experiment was conducted in duplicate. The bar graphs represent the mean ± SD from three independent experiments. Relevant P values are shown.
Figure 7.
Figure 7.
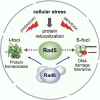
Model for spatial regulation of DNA damage tolerance protein Rad5 in response to MMS-induced cellular stress. The alkylating compound MMS causes both genotoxic and proteotoxic stress, and its use as a model stress agent shows that subnuclear relocalization of Rad5 is important for both genome and proteome stability. We propose a model for MMS-induced recruitment of Rad5 into foci, with Rad6 as a key factor interconnecting genome stability maintenance and proteostasis networks. MMS-induced DNA lesions force replication forks to stall. Many stalled forks are overcome by re-priming, which leaves behind ssDNA gaps that are covered by RPA and recruited to post-replicative territories (PORTs). RPA triggers DDT by recruitment of Rad6/Rad18 to monoubiquitylate PCNA. This in turn causes Rad5 relocalization into S-foci at the PORTs via a process likely involving liquid-liquid phase separation and recognition of PCNA and/or ssDNA by the Rad5 HIRAN domain. Recruitment of Rad5 into S-foci would favour Rad5-mediated template switching to fill in ssDNA gaps, allowing cells to complete chromosome replication. However, some Rad5 molecules are also damaged and misfolded by MMS. Rad6 here acts via the Rad6/Bre1/histoneH2B and Rad6/Ubr2/Rpn4 pathways to downregulate the proteasome, and through the Btn2 sequestrase to recruit damaged/misfolded Rad5 into I-foci at the INQ compartment. This process favours protein quality control by avoiding non-functional Rad5 at sites of DNA damage while preventing its degradation. Non-functional Rad5 recruited at I-foci can later be refolded via the Hsp104/Hsp70 chaperone system into functional Rad5 that would then be available to carry out DNA damage tolerance.

Similar articles

Cited by

References

    1. Aguilera A., García-Muse T.. Causes of genome instability. Annu. Rev. Genet. 2013; 47:1–32. - PubMed
    1. Zeman M.K., Cimprich K.A.. Causes and consequences of replication stress. Nat. Cell. Biol. 2014; 16:2–9. - PMC - PubMed
    1. Hipp M.S., Kasturi P., Hartl F.U.. The proteostasis network and its decline in ageing. Nat. Rev. Mol. Cell Biol. 2019; 20:421–435. - PubMed
    1. Huiting W., Bergink S.. Locked in a vicious cycle: the connection between genomic instability and a loss of protein homeostasis. Genome Instab. Dis. 2021; 2:1–23.
    1. Schumacher B., Pothof J., Vijg J., Hoeijmakers J.H.J.. The central role of DNA damage in the ageing process. Nature. 2021; 592:695–703. - PMC - PubMed

MeSH terms