. 2023 Nov 29:16:5697-5714.
doi: 10.2147/JIR.S440263. eCollection 2023.

Integrated DNA Methylation and Transcriptomics Analyses of Lacrimal Glands Identify the Potential Genes Implicated in the Development of Sjögren's Syndrome-Related Dry Eye

Affiliations

Integrated DNA Methylation and Transcriptomics Analyses of Lacrimal Glands Identify the Potential Genes Implicated in the Development of Sjögren's Syndrome-Related Dry Eye

Mei Sun et al. J Inflamm Res. .

Abstract

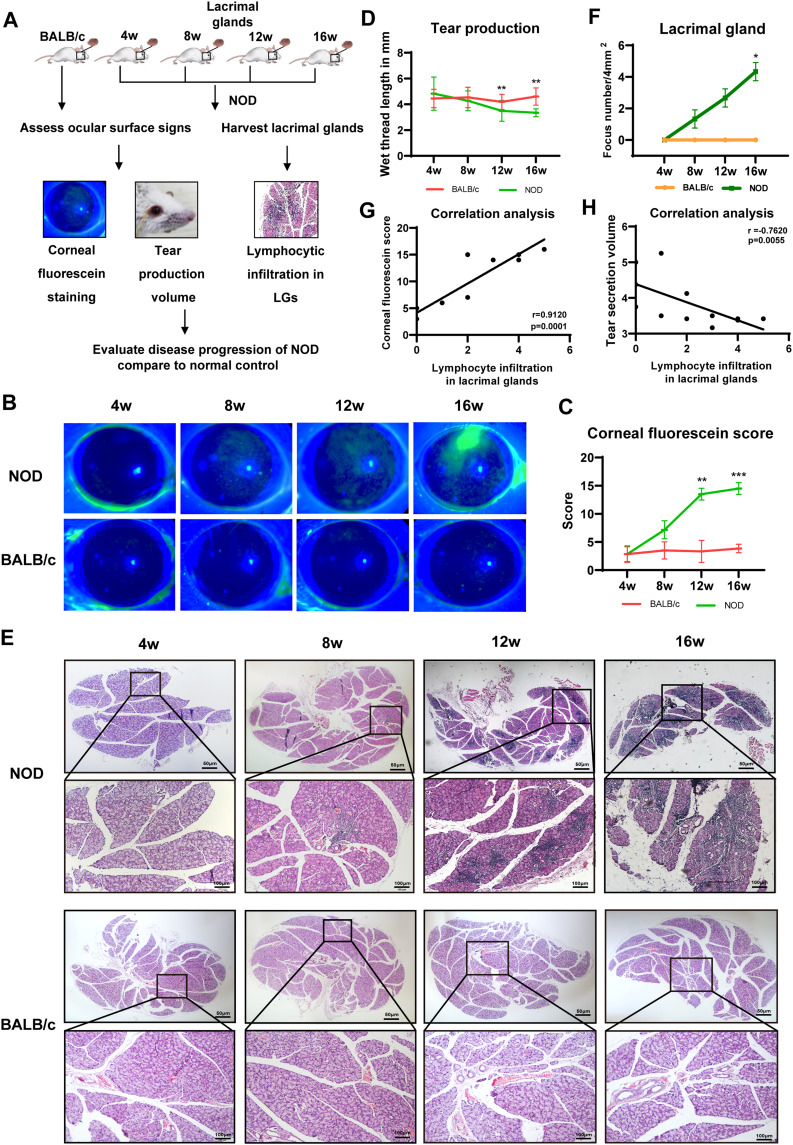
Purpose: Sjögren's syndrome-related dry eye (SS-related dry eye) is an intractable autoimmune disease characterized by chronic inflammation of lacrimal glands (LGs), where epigenetic factors are proven to play a crucial role in the pathogenesis of this disease. However, the alteration of DNA methylation in LGs and its role in the pathogenesis of SS-related dry eye is still unknown. Here, we performed an integrated analysis of DNA methylation and RNA-Seq data in LGs to identify novel DNA methylation-regulated differentially expressed genes (MeDEGs) in the pathogenesis of SS-related dry eye.

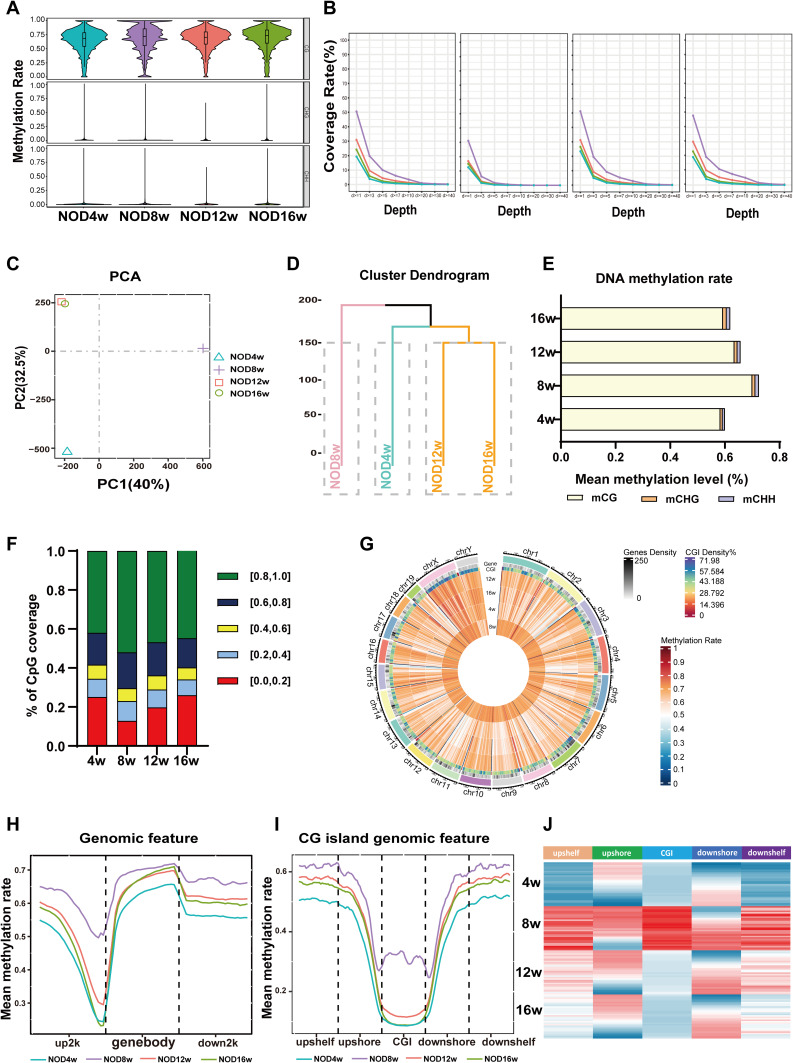
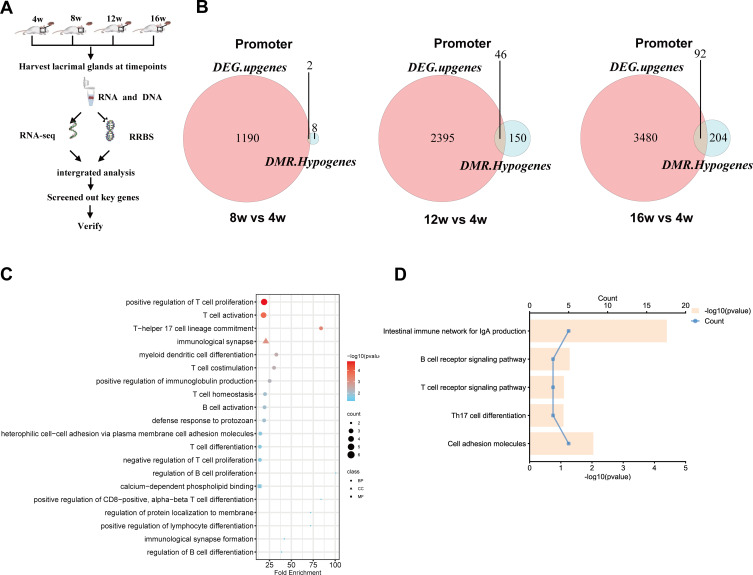
Methods: The DNA methylation and transcription profiles of LGs in NOD mice at different stages of SS-related dry eye (4-, 8-, 12- and 16 weeks old) were generated by reduced representation bisulfite sequencing (RRBS) and RNA-Seq. The differentially methylated genes (DMGs) and differentially expressed genes (DEGs) were analyzed by MethylKit R package and edgeR. Correlation analysis between methylation level and mRNA expression was conducted with R software. The functional correlation of DMGs and DEGs was analyzed by Gene Ontology (GO) and Kyoto Encyclopedia of Genes and Genomes (KEGG). Finally, LG tissues from another litter of NOD mice were collected for methylation-specific polymerase chain reaction (MSP) and quantitative real-time PCR (qRT-PCR) to validate the methylation and expression levels of key genes. CD4+ cell infiltration of LGs was detected by immunofluorescence staining.

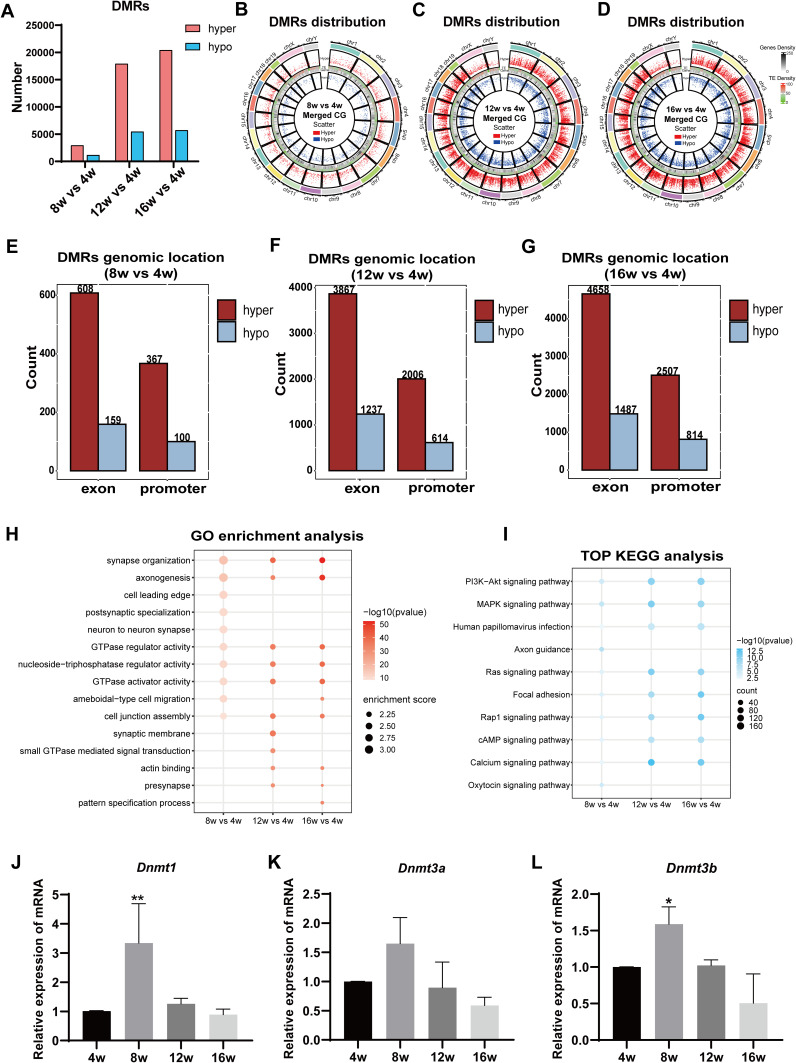
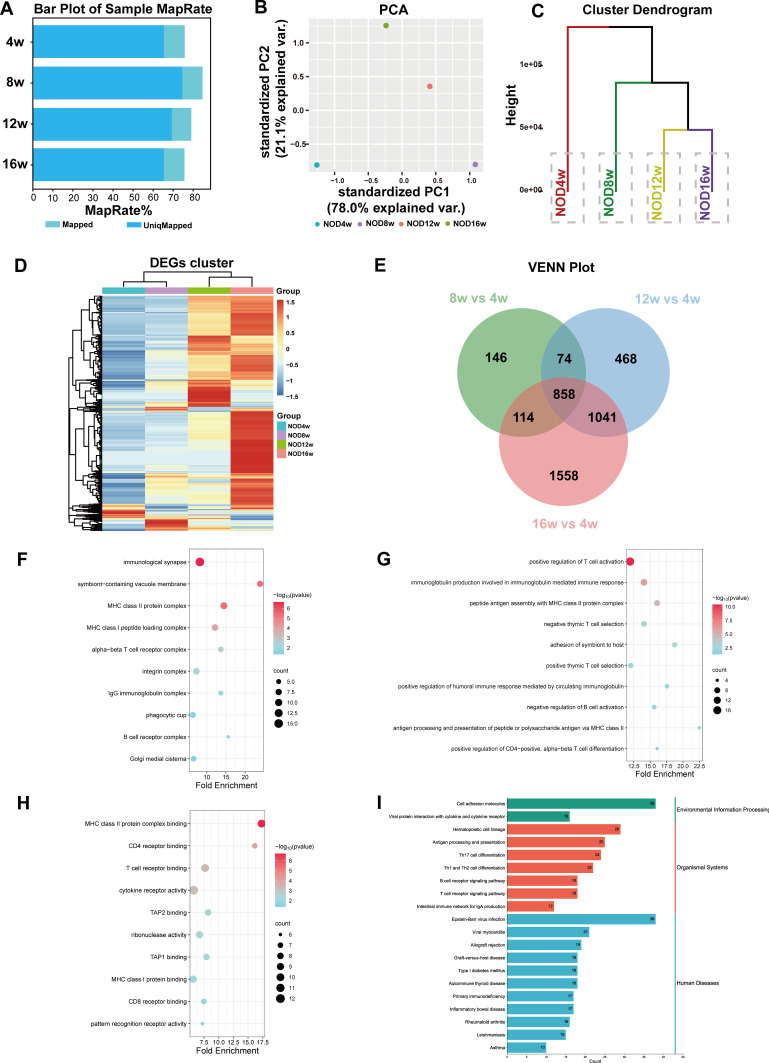
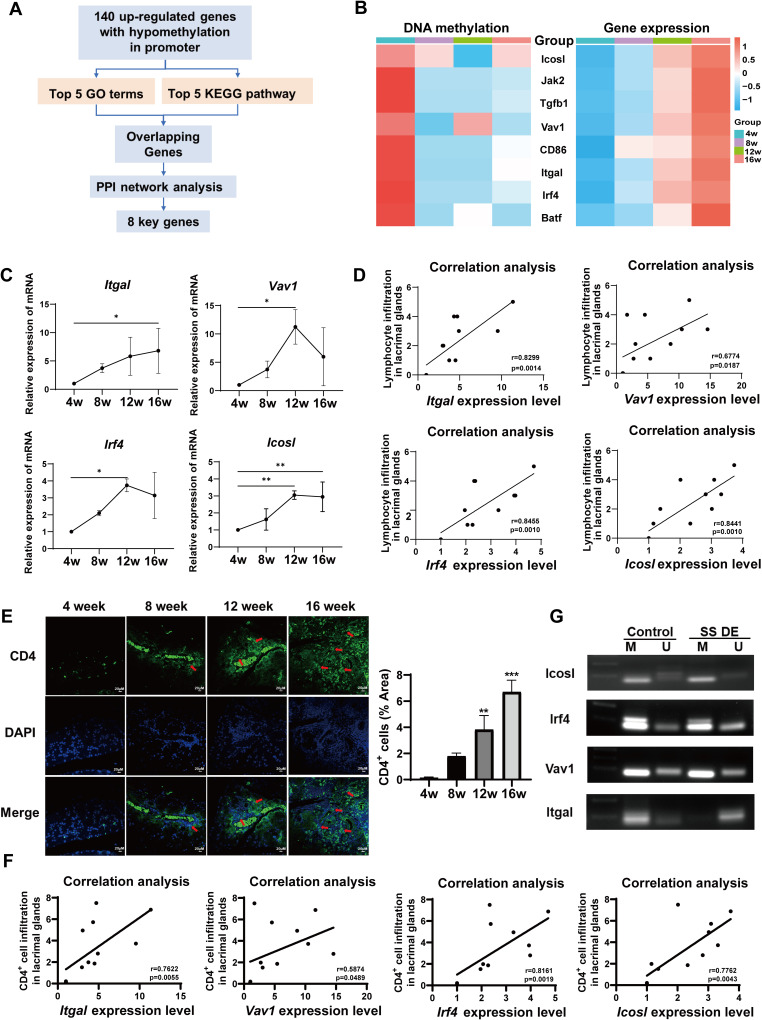
Results: Hypermethylation of LGs was identified in NOD mice with the progression of SS-related dry eye and the DMGs were mainly enriched in the GTPases activation and Ras signaling pathway. RNA-seq analysis revealed 1321, 2549, and 3712 DEGs in the 8-, 12- and 16-week-old NOD mice compared with 4-week-old normal control mice. For GO analysis, the DEGs were mainly enriched in T cell immune responses. Further, a total of 140 MeDEGs were obtained by integrated analysis of methylome and transcriptome, which were primarily enriched in T cell activation, proliferation and differentiation. Based on the main GO terms and KEGG pathways of MeDEGs, 8 genes were screened out. The expression levels of these key genes, especially Itgal, Vav1, Irf4 and Icosl, were verified to elevate after the onset of SS-related dry eye in NOD mice and positively correlated with the extent of inflammatory cell infiltration in LGs. Immunofluorescence assay revealed that CD4+ cell infiltration dramatically increased in LGs of SS-related dry eye mice compared with the control mice. And the expression levels of four genes showed significantly positive correlation with the extent of CD4+ cell infiltration in LGs. MSP showed the hypomethylation of the Irf4 and Itgal promoters in NOD mice with SS-related dry eye compared to control group.

Conclusion: Our study revealed the critical role of epigenetic regulation of T cell immunity-related genes in the progression of SS-related dry eye and reminded us that DNA methylation-regulated genes such as Itgal, Vav1, Irf4 and Icosl may be used as new targets for SS-related dry eye therapy.

Keywords: DNA methylation; RNA-seq; Sjögren’s syndrome-related dry eye; T cell-mediated immune response; lacrimal gland.


Conflict of interest statement

The authors reported no conflicts of interest in this work.

Figures

Figure 1
Figure 1
The severity of dry eye showed progressive exacerbation with increasing age of NOD mice. (A) Time-point selection and experimental design flow for the course studies of SS-related dry eye in NOD mice. n=6-9 mice per group. (B and C) The representative photographs (B) and grading scores of corneal fluorescein staining (C) in different age groups of NOD mice and healthy BALB/c controls. n=6 mice per group. (D) Phenol red cotton threads measurement of tear secretion in NOD mice and healthy BALB/c mice at different time points. n=6-9 mice per group. (E and F) Histopathological analysis of the LGs in NOD mice at different ages. Representative images (E) and quantification (F) show lymphocytic infiltration in LGs. n=3. (G) Spearman rank correlation between the lymphocytic infiltration in the LGs and corneal fluorescein staining scores. n=3. (H) Correlation analysis between the LGs inflammation and tear secretion volume in NOD mice. n=3. Values are represented by means ± SD. Kruskal–Wallis test for multiple comparisons was used. *p<0.05, **p<0.01, or ***p<0.001, compared with 4-week-old group.
Figure 2
Figure 2
DNA methylation levels were increased in LGs of NOD mice during the development of SS-related dry eye. (A) DNA methylation rate under the contexts of CG, CHG, and CHH in NOD mice at different stages of SS-related dry eye (4, 8, 12 and 16 weeks old) by RRBS. (B) The genome coverage rate of C sites in LGs of different NOD groups. (C) Principal component analysis (PCA) based on individual cytosines. (D) Hierarchical clustering (HC) analysis based on methylation levels at CG sites. (E) Global DNA methylation levels of all C sites across the genome in LGs of NOD at different stages of SS-related dry eye. (F) Distribution of methylation levels at CG sites in different groups. (G) Methylation rates of CG sites at different disease stages in NOD. (H) DNA methylation levels along the gene body, 2-kb upstream of the TSS and 2-kb downstream of the TES for all genes. (I) DNA methylation levels of promoter CG island and surrounding areas. (J) Heatmap of methylation levels at CG sites in the functional region of the gene. Red represents hypermethylated; blue represents hypomethylated.
Figure 3
Figure 3
Functional enrichment of the differentially methylated regions-related genes (DMGs) identified in LGs of SS-related dry eye mice. (A) The numbers of DMRs in 8-, 12- and 16-week-old NODs versus 4-week-old controls under CG contexts. (B-D) Comparison of DMRs on different chromosomes between groups at different stages of SS-related dry eye. (E-G) The bar graphs showed the genomic location (exons and promoters) of identified DMRs among different aged NOD groups. (H) GO enrichment analysis for DMGs. The color of the dot indicates the P-value and the size of the dot represents the enrichment score. (I) Top 10 KEGG pathways analysis of DMGs. (J-L) The changes of Dnmt1 (J), Dnmt3a (K) and Dnmt3b (L) in the LGs were determined by qRT-PCR during SS-related dry eye progression. n=3 mice per group. Data are expressed as the mean ± SD. One-way ANOVA followed by the Tukey’s test for multiple comparisons was used. *p < 0.05, **p < 0.01, compared with 4-week-old group.
Figure 4
Figure 4
Transcriptome analysis of LGs during the development of SS-related dry eye. (A) The mapping rates of clean reads for all samples. (B and C) PCA analysis and HC based on gene expression in different groups. (D) Heatmap of differentially expressed genes (DEGs) in each group. Threshold log2(fold-change)>1 or log2(fold-change) <-1, p-value<0.05. The top of the graph represents the sample name, the rows represent the genes, the expression levels are indicated by colors (red indicates high gene expression level, blue indicates low gene expression level), the left side indicates the gene clustering, and the top side indicates the clustering among the samples. (E) VENN plots of upregulated DEGs in the three groups. (F-H) GO enrichment analysis of overlapping upregulated DEGs. GO analysis of predicted genes was performed according to cellular component (CC) (F), biological process (BP) (G), and molecular function (MF) (H). The left side of the graph represents GO categories, the color corresponds to the -log10 of the p-value, and the size of dot represents the number of enriched genes. (I) KEGG pathway analysis of DEGs. The top 20 pathways were summarized.
Figure 5
Figure 5
Correlation analysis between DMRs and genome-wide gene expression. (A) Study design diagram for integrated analysis of methylome and transcriptome. (B) VENN analysis of upregulated DEGs with hypomethylated DMRs. (C and D) GO and KEGG analysis of genes upregulated by promoter hypomethylation in different NOD groups.
Figure 6
Figure 6
Identification of key DNA methylation-regulated genes associated with SS-related dry eye. (A) Flow chart of key gene screening. (B) The heatmap of methylation levels in promoters and expression levels of candidate functional genes related to SS-related dry eye. (C) Validation of the mRNA expression levels of candidate genes in LGs by qRT-PCR. n = 3 mice per group. One-way ANOVA and Tukey’s test were used for multiple comparisons. Values are represented by means ± SD. *p<0.05, **p<0.01, compared with 4-week-old group. (D) Correlation analysis between the expression levels of candidate genes and the lymphocyte infiltration in LGs. Spearman rank correlation tests were used. (E) Immunofluorescence labeling of DAPI and CD4 in LGs of the 4-, 8-, 12-, and 16-week-old groups. CD4 (upper panel, green), DAPI (middle panel, blue), and the merge (lower panel) are shown. Arrows show CD4+ cell infiltration lesions. **p<0.01, or ***p<0.001, compared with 4-week-old group. Scale bars = 20 μm. (F) Correlation analysis between the expression levels of candidate genes and the extent of CD4+ cell infiltration in LGs. Spearman rank correlation tests were used. (G) Representation of MSP for Icosl (n = 3), Irf4 (n = 3), Vav1 (n = 3) and Itgal (n = 3) in NOD mice with SS-related dry eye compared to 4-week-old mice without dry eye. Bands in lanes labeled “M” and “U” are PCR products amplified with methylation- and unmethylation-specific primers.

Similar articles

References

    1. Imgenberg-Kreuz J, Sandling JK, Nordmark G. Epigenetic alterations in primary Sjögren’s syndrome - an overview. Clin Immunol. 2018;196:12–20. doi:10.1016/j.clim.2018.04.004 - DOI - PubMed
    1. Choudhry HS, Hosseini S, Choudhry HS, Fatahzadeh M, Khianey R, Dastjerdi MH. Updates in diagnostics, treatments, and correlations between oral and ocular manifestations of Sjogren’s syndrome. Ocul Surf. 2022;26:75–87. doi:10.1016/j.jtos.2022.08.001 - DOI - PubMed
    1. Foulks GN, Forstot SL, Donshik PC, et al. Clinical guidelines for management of dry eye associated with Sjögren disease. Ocul Surf. 2015;13(2):118–132. doi:10.1016/j.jtos.2014.12.001 - DOI - PubMed
    1. Lafontaine N, Wilson SG, Walsh JP. DNA Methylation in Autoimmune Thyroid Disease. J Clin Endocrinol Metab. 2023;108(3):604–613. doi:10.1210/clinem/dgac664 - DOI - PubMed
    1. Qiu Y, Zhu Y, Yu H, Zhou C, Kijlstra A, Yang P. Dynamic DNA Methylation Changes of Tbx21 and Rorc during Experimental Autoimmune Uveitis in Mice. Mediators Inflamm. 2018;2018:9129163. doi:10.1155/2018/9129163 - DOI - PMC - PubMed