. 2023 Dec;624(7992):621-629.
doi: 10.1038/s41586-023-06693-2. Epub 2023 Dec 4.

Genetic risk converges on regulatory networks mediating early type 2 diabetes

Affiliations

Genetic risk converges on regulatory networks mediating early type 2 diabetes

John T Walker et al. Nature. 2023 Dec.

Abstract

Type 2 diabetes mellitus (T2D), a major cause of worldwide morbidity and mortality, is characterized by dysfunction of insulin-producing pancreatic islet β cells1,2. T2D genome-wide association studies (GWAS) have identified hundreds of signals in non-coding and β cell regulatory genomic regions, but deciphering their biological mechanisms remains challenging3-5. Here, to identify early disease-driving events, we performed traditional and multiplexed pancreatic tissue imaging, sorted-islet cell transcriptomics and islet functional analysis of early-stage T2D and control donors. By integrating diverse modalities, we show that early-stage T2D is characterized by β cell-intrinsic defects that can be proportioned into gene regulatory modules with enrichment in signals of genetic risk. After identifying the β cell hub gene and transcription factor RFX6 within one such module, we demonstrated multiple layers of genetic risk that converge on an RFX6-mediated network to reduce insulin secretion by β cells. RFX6 perturbation in primary human islet cells alters β cell chromatin architecture at regions enriched for T2D GWAS signals, and population-scale genetic analyses causally link genetically predicted reduced RFX6 expression with increased T2D risk. Understanding the molecular mechanisms of complex, systemic diseases necessitates integration of signals from multiple molecules, cells, organs and individuals, and thus we anticipate that this approach will be a useful template to identify and validate key regulatory networks and master hub genes for other diseases or traits using GWAS data.


Conflict of interest statement

Competing interests The authors declare no competing interests.

Figures

Extended Data Fig. 1 |
Extended Data Fig. 1 |. (related to Fig. 1). Ex vivo and in vivo functional profiling of islets from donors with early T2D demonstrates reduced stimulated insulin secretion.
(a-b) Matching of BMI (a) and age (b) in n = 23 ND and n = 12 T2D independent donors for perifusion experiments. (c-m) Perifusion metrics for islets from n = 23 ND and n = 12 T2D independent donors. (c) Basal insulin secretion calculated as the average of the first three points of perifusion trace. (d-e) Integrated area under the curve (AUC) breaking down the total 16.7 mM glucose response into the first phase (d; through minute 24) and second phase (e; remainder of stimulation). Both first and second phases of insulin secretion were reduced, with the first phase showing a more significant reduction. (f) Area “under” the curve calculated from trace baseline for inhibition with low glucose and epinephrine. (g-k) Dynamic glucagon secretory response (g) measured by islet perifusion and secretory response as area under the curve (AUC) (h-j) normalized to islet volume. Ad, adrenaline (μM); G, glucose (mM); IBMX, isobutylmethylxanthine (μM); KCl, potassium chloride (mM). (k) Basal glucagon secretion calculated as average of first three points of perifusion trace. (l) Area “under” the curve calculated from trace baseline for inhibition with high glucose; both ND and T2D islets showed glucose-mediated suppression of glucagon secretion. (m) Glucagon content normalized to islet volume. (n) Pearson correlation of donor attributes to insulin and glucagon secretory metrics highlighted a significant negative correlation between donor HbA1c and stimulated insulin secretion (r < −0.30, P < 0.05). (o) Schematic of human islet transplantation and in vivo assessment of function. (p-q) After six weeks T2D islets secreted less human insulin than ND islets, especially after stimulation with glucose/arginine (p: average per donor of n = 7 ND and n = 8 T2D independent islet preparations; q: n = 41 individual mice with engrafted ND islets and n = 45 individual mice with engrafted T2D islets). Blood glucose, human insulin levels, and human insulin:blood glucose ratio were measured at 0’ (six-hour fasted) and 15’ after glucose and arginine administration in mice with human islet grafts. (r-s) Endocrine composition (r) and vascularization (s) of islet grafts from n = 5 individual mice representing n = 5 ND donor islet preparations and n = 5 individual mice representing n = 5 T2D donor islet preparations. Engraftment was similar between ND and T2D islets. Scale bars, 100 μm. Data in panels a-m and p-s show mean + SEM; statistical results (e: two-tailed linear mixed-effect model, P = 0.518; a-d, f-k, s: two-tailed t-test; p-r: two-way ANOVA with Šídák’s multiple comparisons test) indicated as follows: *P < 0.05, **P < 0.01, ***P < 0.001, **** P < 0.0001.
Extended Data Fig. 2 |
Extended Data Fig. 2 |. (related to Fig. 1). Transcriptional analysis of islets and sorted α and β cells reveals dysregulation of metabolic pathways in T2D β cells and immune signaling in T2D islets.
(a-c) Volcano plots illustrating differentially expressed genes between ND and T2D β cells (a; 352 genes), α cells (b; 248 genes), and islets (c; 565 genes) as obtained by DESeq2 (two-sided; multiple hypothesis corrected at FDR < 0.01). Lines denote cutoffs for fold-change (±1.5) and significance (FDR < 0.01); genes passing both thresholds are colored and select genes are labeled. (d-f) Enriched gene ontology terms (two-sided; multiple hypothesis corrected at FDR < 0.05) obtained from RNA-Enrich were condensed using the RelSim function of Revigo (similarity = 0.5) and plotted in semantic space to emphasize relatedness. Dot size represents odds ratio and color represents p-value. Select terms are labeled. For α cells gene changes were most evident in amino acid and steroid signaling pathways and regulation of blood vessel morphology and for islets in cytokine signaling and other immune terms.
Extended Data Fig. 3 |
Extended Data Fig. 3 |. (related to Fig. 2). Parallel approaches of multiplexed imaging and high-throughput traditional immunohistochemistry enable detailed profiling of the endocrine compartment of the islet.
(a) High-throughput traditional immunohistochemistry (IHC) with whole-slide imaging was applied across pancreas head, body, and tail regions for the entire donor cohort, and in parallel, a subset of samples was analyzed with a 28-marker panel using co-detection by indexing (CODEX), a multiplexed technique enabling fluorescence-based imaging of large tissue sections without tissue destruction to spatially resolve many cellular phenotypes. A full list of inclusionary and exclusionary markers for cellular phenotypes analyzed is provided in Supplementary Table 4. (b-g) Analysis by traditional IHC of tissue from n = 11 ND and n = 20 T2D independent donors. (b) Pancreas weight measured during organ procurement was used to calculate endocrine cell mass in Fig. 2a. (c-g) Cross-sectional area (c-d) and cytonuclear quantification (e-g) of β cells (CPEP; green), α cells (GCG; red), and δ cells (SST; blue). Individual donor data shown in stacked bar graphs (c, e); stratification by pancreas region (d, g) includes horizontal lines (solid, ND; dotted, T2D) for mean values from combined analysis (‘Aggregate’). Donor-to-donor variability in β and α cell ratio was notable, underscoring the challenge in working with heterogeneous human tissues, but no differences were detected between groups in this cohort,–. (h-j) Analysis by CODEX of tissue from n = 6 ND and n = 10 T2D independent donors. (h) Cross-sectional area of endocrine cell types as measured by CODEX, including rarer γ and ε cell populations. (i) Correlation of paired cell type measurements from traditional IHC (x-axis) and CODEX (y-axis); the two methods were highly concordant (R2 = 0.8499, slope=0.9828, P < 0.0001; two-tailed linear regression). (j) Abundance of endocrine and non-endocrine cells in ND and T2D islets; one vertical bar per islet and colored by cell type. Islets are grouped by donor and ordered from largest (highest total cell number) to smallest. See also Fig. 2c. (k) Rare cells positive for chromogranin A (CHGA; red) but negative for all hormones (green), postulated to represent dedifferentiated endocrine cells, were present in both ND and T2D at similar proportions. Scale bars, 50 μm; arrowheads denote CHGA+ hormone cells. (l) Amyloid prevalence (% total islets with amyloid, averaged over multiple regions) for n = 11 ND and n = 20 T2D independent donors. (m) Correlation of amyloid prevalence with β, α, and δ cell populations as percentage of total endocrine cell number or cross-sectional area; one symbol per donor with 95% confidence interval of linear regression (shading). No slopes were significantly nonzero at P < 0.01 threshold. Traditional IHC data: panels c-h, l-m; CODEX data: panels i-k. Data in panels b, d, f-h, and l show mean + SEM; statistical results (b, l: two-tailed t-test; d, f-h: two-way ANOVA with Šídák’s multiple comparisons test) indicated as follows: *P < 0.05, **P < 0.01, ***P < 0.001, ****P < 0.0001. None of the variables shown had a statistically significant association with disease duration (Pearson correlation, threshold P < 0.05).
Extended Data Fig. 4 |
Extended Data Fig. 4 |. (related to Fig. 2). Integration of multiplexed imaging and transcriptional profiling highlight disrupted capillaries and immune cells within T2D islets.
(a) Gene expression fold-change (DESeq2; two-sided and multiple hypothesis corrected at FDR < 0.05) of selected vascular and neuronal ligands and their receptors in β cells, α cells, and islets; • FDR < 0.05; * FDR < 0.01. Alpha cells expressed more angiogenic ligands and receptors than β cells. (b-c) RNA-sequencing analysis highlighted enrichment in T2D samples for processes controlling blood vessel size, particularly in α cells, as well as regulation of growth factors critical to islet capillary maintenance. Panel (b) shows select vascular-related ontology terms (RNA-Enrich; two-sided and multiple hypothesis corrected at FDR < 0.05); panel (c) shows Metascape visualization of select terms enriched for differentially expressed genes (two-tailed hypergeometric test) in T2D α cells (left) and islets (right). (d) Average distance of each endocrine cell type to nearest capillary (n = 6 ND and n = 9 T2D independent donors). Interestingly, α and δ cells were slightly closer to capillaries than β cells in both ND and T2D islets. (e) Phenotypes of endothelial cells (CD31; red) defined by single or dual positivity for HLA-DR (green) and CD34 (blue). Examples of each combination (HLA-DR+ CD34, CD34+ HLA-DR, HLA-DR+ CD34+, and HLA-DR CD34) are shown to right. Data from n = 6 ND and n = 10 T2D independent donors. Scale bars, 25 μm. (f-g) Enrichment in T2D β cells and islets for cytokine signaling and immune cell recruitment pathways,. Panel (f) shows select immune-related ontology terms (RNA-Enrich; two-sided and multiple hypothesis corrected at FDR < 0.05); panel (g) shows magnification of select clusters depicted in Fig. 1j (terms enriched across β, α, and islet samples). (h-i) Macrophages (IBA1+) and T cells (CD3+) phenotyped by various cell surface markers; insets show additional cells to illustrate phenotypic variety. Proinflammatory (HLA-DR+), anti-inflammatory (CD163 and/or CD206+), helper (CD4+), and cytotoxic (CD8+) phenotypes are detailed in Supplementary Table 4. Scale bars, 25 μm (h, i inset) and 50 μm (i). Data from n = 6 ND and n = 10 T2D (h) or n = 5 ND and n = 8 T2D (i-j) independent donors. (j) Expression of HLA-DR in CD4+ and CD8+ T cell populations. (k) High-dimensional component analysis of islet cell composition per islet (n = 681), shown by donor; corresponds to Fig. 2k. RNA data: panels a-c, f-g; * FDR < 0.05; CODEX data: panels d, h-j. Bar graphs in panels d-e and h-j show mean + SEM with symbols representing individual donors; statistical results (d: one-way ANOVA with Tukey’s multiple comparisons test; e, h-i: two-way ANOVA with Šídák’s multiple comparisons test; j: two-tailed t-test) indicated as follows: * P < 0.05, ** P < 0.01, *** P < 0.001, **** P < 0.0001. None of the variables shown had a statistically significant association with disease duration (Pearson correlation, threshold P < 0.05).
Extended Data Fig. 5 |
Extended Data Fig. 5 |. (related to Fig. 2). Cellular neighborhood assignment and (d-e) corresponding cell composition changes in T2D and ND islets.
(a) Heat map showing cellular neighborhoods (CNs) identified by CF-IDF method and representative islet image with cell and CN annotation overlay. See Methods for more details. Scale bar, 50 μm. (b-c) A k-means cellular neighborhood analysis (b) was applied in parallel, and results were highly concordant between the two methods (c; R2 = 0.9542, slope = 1.058, P < 0.0001; two-tailed linear regression). Scale bar (b), 50 μm. Bar graphs show mean + SEM with symbols representing individual donors. (d-e) Differential cell type enrichment (two-tailed t-test) in T2D vs. ND islets by CF-IDF (d) and k-means (e) analyses. ECs and pericytes were depleted in β CNs (CN1) of T2D islets, consistent with our findings of decreased proximity between β cells and ECs in T2D. Symbols indicate unadjusted P-values as follows: P < 0.2, P < 0.1, *P < 0.05. (f-g) Correlation of cell compositions across CNs; these analyses ask whether cell type frequencies are correlated between CNs, i.e., if there was evidence for connectivity between spatially distinct regions. Panel (g) shows results from k-means method; see also Fig. 2l (CF-IDF method). All cellular neighborhood data is derived from CODEX imaging of tissue from n = 6 ND and n = 10 T2D independent donors.
Extended Data Fig. 6 |
Extended Data Fig. 6 |. (related to Fig. 3). WGCNA emphasizes α and islet cell gene modules associated with donor and islet traits as well as those enriched in GWAS loci.
(a-d) Though α cell modules showed weaker correlations to donor and functional traits than did β cell modules, several modules were significantly enriched for cilia-related genes (a) and α08 was also enriched for α cell genes differentially expressed in T2D α cells (b). Both α08 and α16 significantly inversely correlated with epinephrine-mediated glucagon secretion and were closely related across functional parameters (c). Module α08 showed significant enrichment for T2D GWAS variants (d). See also Supplementary Fig. 4b. (e-g) Several islet modules showed notable enrichment for immune- and matrisome-related genes (e). Module i25 correlated positively with T2D status (f) and inversely with basal insulin secretion and GSIS, while i26 correlated inversely with KCl-mediated insulin secretion (g). See also Supplementary Fig. 4c. Panels a and e show module eigengenes clustered by similarity and relative enrichment of curated gene lists (see also Supplementary Table 5). Panels b and f provide correlation to donor characteristics, enrichment of differentially expressed (DE) genes, and total number of genes per module ( P < 0.05; * P < 0.01). Modules of interest highlighted (b: red, f: blue). Panels c and g show module correlation to α and β cell function (Fig. 1); significant associations highlighted (yellow). For islets (g), modules were correlated to both insulin and glucagon secretion (G + IBMX, 16.7 mM glucose with 100 μM isobutylmethylxanthine; 16.7 G, 16.7 mM glucose; 16.7 G 1°, first phase; 16.7 G 2°, second phase; 1.7 G+Epi, 1.7 mM glucose and 1 μM epinephrine; KCl, 20 mM potassium chloride). Panel d shows α cell module enrichment for GWAS traits (FIns, fasting insulin; 2hGlu, 2-hour glucose; FGlu, fasting glucose; * FDR < 0.01). Panels a, e, b and f (DE genes): two-tailed Fisher test adjusted for multiple comparisons; panels c, g, b and f (donor traits): t-test, unadjusted, using Spearman correlations (see Methods for additional details); panel d: enrichment using GARFIELD.
Extended Data Fig. 7 |
Extended Data Fig. 7 |. (related to Fig. 3). Both transcriptomic and histologic data suggest changes in cilia processes in early T2D.
(a) Magnification of select clusters depicted in Fig. 1j (terms enriched across β, α, and islet samples). (b) Fold change of validated cilia-related genes (shown here, those ≥ |1.5| in both α and β cells); the majority were expressed at higher levels in T2D compared to ND. (c-d) Visualization by immunohistochemistry of cilia (ARL13B; red) and quantification of abundance, density, and size in tissue from n = 8 ND and n = 8 T2D independent donors. Tissue sections are from the same donors shown in panel b. Scale bars, 50 μm. Bar graphs show mean + SEM with symbols representing individual donors; statistical results (d: two-tailed t-test) indicated as follows: * P < 0.05, ** P < 0.01, *** P < 0.001, **** P < 0.0001.
Extended Data Fig. 8 |
Extended Data Fig. 8 |. (related to Fig. 4). RFX motif enrichment across β cell modules and β cell RFX6 reduction in pseudoislets impairs insulin secretion.
(a) Enrichment of selected transcription factor motifs in β cell modules, calculated using the AME tool from MEME-Suite with Bonferroni correction; log10(P-values) are unadjusted. (b) Schematic of adenoviral shRNA delivery and formation of pseudoislets, which mirror native human islet architecture,. (c) Relative RFX6 mRNA expression in β cells treated with scramble shRNA (‘control’) or RFX6 shRNA (‘shRFX6’). Data represents n = 3 independent islet preparations. (d) RFX6 knockdown did not change β or α cell proportion (n = 4 independent islet preparations); acute (6-day) reduction of RFX6 expression does not lead to β cell loss. (e) Control and shRFX6 pseudoislets exhibited similar size and morphology. Transduced cells marked by mCherry; distribution of β cells shown by C-peptide (CPEP; blue) and α cells by glucagon (GCG; green). Scale bars, 200 μm (morphology) and 50 μm (immunostaining). (f-i) Dynamic insulin secretion and metrics equivalent to Fig. 4f, g but normalized by total insulin content (h) in control and shRFX6 pseudoislets. (i) Proinsulin content and proinsulin:insulin ratio in control (scramble) and shRFX6 pseudoislets. Proinsulin content was not significantly greater in shRFX6 pseudoislets and the proinsulin:insulin ratio was comparable to controls, suggesting secretory defects were not due to inappropriate insulin processing. Functional data (f-i) represents n = 6 independent islet preparations. Data in panels c-d and f-i show mean + SEM; statistical results (c-d, g-i: two-tailed t-test; f: linear mixed-effect model) indicated as follows: *P < 0.05, **P < 0.01, ***P < 0.001, ****P < 0.0001.
Extended Data Fig. 9 |
Extended Data Fig. 9 |. (related to Fig. 5). RFX6 controls stimulated insulin secretion through genome-wide chromatin alterations disrupting transcripts controlling exocytotic pathways.
(a) Post-QC nuclei counts from control and shRFX6 pseudoislets. (b) Abundance of fluorescent marker gene expression (mCherry/mKate2) in α and β cell nuclei. Reporter expression was much higher in β cell nuclei than in α cell nuclei, consistent with the previously observed preferential adenoviral targeting of β relative to α cells. (c) Proportion of differentially expressed (DE) genes per cell type. Nuclear RFX6 was not among those reduced in β cell nuclei, consistent with shRNA silencing occurring in the cytoplasm. (d) Pathway enrichment (g:Profiler, two-tailed hypergeometric test) for DE genes (FDR < 0.01); second two columns separate genes up- or downregulated in shRFX6. (e-f) To identify gene regulatory networks driving cell states, we employed Single-Cell rEgulatory Network Inference and Clustering (SCENIC) and discovered cell type specific regulons governing cell identity. (f) UMAP clustering of nuclei (RNA component) by SCENIC using regulon activity (left) and average regulon activity across cell types (right). See also Fig. 5d. (g) To investigate overlap in differentially expressed genes between shRFX6 β cell nuclei and sorted T2D β cells, we compared the top 1,000 most significant DE genes in shRFX6 vs. control β cell nuclei (blue) and T2D vs. ND sorted β cells (red). Circos plot illustrates commonality at the level of gene IDs (purple) or ontology term enrichment (grey; p < 0.01). Metascape network analsyis displays a subset of enriched terms, where edges denote term similarity and node colors represent contribution of each gene list. Common pathway enrichment related to microtubule cytoskeleton organization, ion transport, and regulation of protein secretion. (h-i) Motif enrichment for top 2,000 (h) or 10,000 (i) RFX6-sensitive up- and downregulated ATAC peaks in shRFX6 β cell nuclei. Motifs with highest significance are labeled in top panels; significant RFX motifs (or the single RFX motif closest to significance, in the case that no RFX motifs reach significance) are labeled in bottom panels. (j) Enrichment of top RFX6-sensitive up- and downregulated ATAC peaks (n = 2,000, 5,000, or 10,000) in shRFX6 β cell nuclei near shRFX6 β cell differentially expressed genes. (k-l) Single value odds ratio of T2D GWAS enrichment (k) and model estimate from conditional analysis (l) of top 2,000 or 10,000 RFX6-sensitive peaks; see Methods for details. Nominal P-values for panel k, left to right: 0.00336, 5.53e-28, 0.0194, 9.28e-22. (m) Model of Mendelian randomization (MR) depicting the relationship of an instrumental variable (here, RFX6 SNPs) related to exposure (RFX6 expression) and outcome (T2D). Dotted lines denote assumptions of no association while solid and dashed lines indicate disease causality. (n) MR analyses using the European ancestry cohort from Vujkovic et al. meta-analysis (n = 1,114,458 independent samples) resulted in point estimates that were directionally consistent with the findings for the UK Biobank (see Fig. 5k). The heterogeneity across contributing studies (for example Million Veterans Program data reflect an older T2D case set, more comorbidities, and a strong male bias compared to UK Biobank) likely reduces our power. We leveraged several MR approaches to determine whether results were robust to their varying assumptions. Debiased inverse variant weighted method (robust to weak instrument bias): causal effect = −0.084, P = 0.065; Pleiotropy RESidual Sum and Outlier (PRESSO) method (removes outlier instrumental variable effects): causal effect = −0.073, P = 0.251; weighted median method (robust when up to 50% of instrumental variables are invalid): causal effect = −0.045, P = 0.372. Results from MR-Egger are not shown due to strong weak instrument bias (I2_GX = 0). Error bars in panels l and n represent 95% confidence intervals.
Extended Data Fig. 10 |
Extended Data Fig. 10 |. (related to Fig. 5). Summary schematic of key molecular alterations in short-duration T2D cohort and of the convergence of genetic risk on an RFX6-mediated gene regulatory network.
(a) Major β cell-intrinsic and islet microenvironment alterations that define islet dysfunction in early T2D. Observations from transcriptomic and histologic studies revealed no change to endocrine cell composition but evidence of dysregulated β cell processes and modest changes to intraislet vascular and immune cell populations. Insulin secretion was reduced and persisted in a nondiabetic environment; glucagon hypersecretion was not observed. (b) After identifying RFX6 as a candidate disease-associated gene through unbiased analysis of a small cohort (left panel; labels 1–2), we used two approaches for validation: first, molecular perturbation of RFX6 in β cells of primary human pseudoislets allowed functional, transcriptomic and epigenomic analyses (top right panel; labels 3–4) and second, integration of UK Biobank data allowed population-scale genetic relationship to be examined (bottom right panel; label 5). Reduction of RFX6 led to reduced insulin secretion defined by transcriptional dysregulation of vesicle trafficking, exocytosis, and ion transport pathways that was mediated by genome-wide chromatin architectural changes overlapping with T2D GWAS variants. Furthermore, Mendelian randomization analysis revealed that reduced islet RFX6 expression is causally associated with T2D.
Fig. 1 |
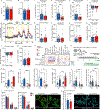
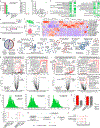
Fig. 1 |. Integrated analysis of islet function, gene expression, and tissue architecture in a cohort of donors with early T2D reveals reduced stimulated insulin secretion ex vivo and in vivo and highlights dysregulated pathways in purified β and α cells as well as whole islets.
a, Top, schematic of disease progression from ND to pre-diabetes (pre-DM) and T2D, highlighting the progressive loss of functional β cell mass (red shading represents the disease stage targeted with this cohort); bottom, clinical cohort profile. See also Supplementary Table 1. HbA1c, haemoglobin A1C test. b, Application of multiple modalities, including ex vivo and in vivo islet function, tissue architecture and microenvironment, and cell type-specific gene expression in the study. Coordinated study on islets and tissue from same donor enabled integration between analyses (green arrows). RNA-seq, RNA sequencing. c, The dynamic insulin secretory response (P = 0.0005) of islets from ND (n = 23) and T2D (n = 12) independent donors measured by islet perifusion. Treatments (and concentrations) are shown along the top of the graph: Ad, adrenaline (μM); G, glucose (mM); IBMX, isobutylmethylxanthine (μM); KCl, potassium chloride (mM). df, Secretory response, quantified as area under the curve (AUC), to glucose (d), cAMP (e), and KCl (f). IEQs, islet equivalents. g, Islet insulin content normalized to islet volume. h, Schematic of RNA sample collection and analysis. A latent variable analysis separated biological from technical variation, followed by examination by both differential gene expression and gene network analyses. FC, fold change; FDR, false discovery rate. i, Common differentially expressed genes in T2D β cell, α cell and islet samples at the level of gene ID (purple curves) or ontology term enrichment (grey curves; P < 0.01). j, Metascape network showing a subset of enriched terms from differentially expressed genes (two-tailed hypergeometric test). Edges denote similarity and node colours reflect the contribution of sample(s). Of note, endoplasmic reticulum processing and unfolded protein pathways were more enriched in islets than in isolated α or β cells. Data in cg are mean + s.e.m. c, Two-tailed linear mixed-effect model. dg, Two-tailed t-test indicated as follows. *P < 0.05, **P < 0.01, ***P < 0.001, ****P < 0.0001.
Fig. 2 |
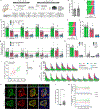
Fig. 2 |. Integrated tissue analysis reveals no change to endocrine cell mass or number and modest changes in intraislet capillaries, T cells and cellular neighbourhoods in the early T2D cohort.
a, The mass of β, α and δ cells in 11 independent ND donors and 20 independent T2D donors. b, Representative images of islets from CODEX imaging; insets show γ and ε cells. c, Relative proportions of islet endocrine, vascular, stromal and immune cells. d, Representative images of islet capillaries, pericytes and extracellular matrix (ECM). EC, endothelial cell. e, Islet capillary density and area per capillary in n = 11 ND and n = 17 T2D donors. P = 0.0268. f, Spatial analysis of endocrine cells and islet capillaries in n = 6 ND and n = 9 T2D donors. g,h, Islet immune cell phenotypes and composition. β cells: P = 0.0247; α cells: P = 0.0479. DC, dendritic cell; NK, natural killer. i,j, Islet macrophage (i; n = 11 ND and n = 20 T2D) and T cell (j; n = 6 ND and n = 10 T2D; P = 0.0246) abundance. k, High-dimensional component analysis by uniform manifold approximation and projection (UMAP) of islet cell composition per islet (n = 255 ND, n = 426 T2D). l, Cellular neighbourhood changes in T2D versus ND islets. Line thickness and colour indicate correlation and confidence, respectively. a,e,i, Traditional immunohistochemistry data. bd,fh,jl, CODEX data. Scale bars, 50 μm (inset in b, 25 μm). Bar graphs show mean + s.e.m. Two-way ANOVA with Šídák’s multiple comparisons test (a,f); two-tailed t-test (e,i,j). None of the variables shown had a statistically significant association with disease duration (Pearson correlation, threshold P < 0.05). *P < 0.05, **P < 0.01, ***P < 0.001, ****P < 0.0001.
Fig. 3 |
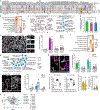
Fig. 3 |. WGCNA distinguishes β cell gene modules associated with donor and islet traits as well as those enriched in GWAS loci.
a, Relative enrichment of β cell modules (eigengenes) for curated gene lists, based on genes present in each module (two-tailed Fisher test, adjusted for multiple comparisons). See also Supplementary Table 5. AA, amino acid; carb., carbohydrate; endo., endocrine; metab., metabolism; mod, modification; ox. phosph., oxidative phosphorylation; proc. processes; Syst., system; trans., transduction. b, Module correlation to donor characteristics, enrichment of differentially expressed (DE) genes (two-tailed Fisher test, adjusted for multiple comparisons; P < 0.05, *P < 0.01) and total number of genes per module. Modules of interest are highlighted in green. c, Module correlation to β cell functional traits described in Fig. 1; significant associations are highlighted in yellow. G + IBMX, 16.7 mM glucose with 100 μM isobutylmethylxanthine; 16.7 G, 16.7 mM glucose; 16.7 G 1°, first phase; 16.7 G 2°, second phase; 1.7 G + Ad, 1.7 mM glucose and 1 μM adrenaline; KCl, 20 mM potassium chloride. d, Module enrichment for GWAS traits using GARFIELD. β is the regression coefficient indicating effect size and direction; SE quantifies the estimate variability. FIns, fasting insulin; 2hGlu, 2-hour glucose; FGlu, fasting glucose. See also Supplementary Fig. 4. Correlations (donor and functional characteristics) were run with a t-test, unadjusted, using Spearman correlations; see Methods for additional details.
Fig. 4 |
Fig. 4 |. Expression of RFX6, a central regulator of transcript changes in early T2D, is reduced in T2D β cells.
a, Overall connectivity of individual genes based on β cell WGCNA; selected genes with high connectivity scores are labelled. b, Cross-module and within-module connectivity of individual genes based on β cell WGCNA; selected transcription factor genes are labelled. c, Fold change in T2D β cell RNA expression of transcription factor genes highlighted in a. Vertical lines denote fold change of ±1.5. d,e, Images (d) and quantification (e) of expression of RFX6 in β cells and α cells of n = 11 ND and n = 13 T2D donors. Two-tailed t-test. Scale bars, 50 μm. f, Pseudoislet insulin secretion assessed by perifusion; n = 6 independent islet preparations. g, Basal insulin secretion and area under the curve (AUC) for secretory response to each stimulus. Two-tailed t-test. Data in eg are mean + s.e.m. *P < 0.05, **P < 0.01, ***P < 0.001, ****P < 0.0001.
Fig. 5 |
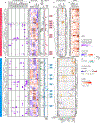
Fig. 5 |. Molecular perturbation and population analyses demonstrate that regulatory GWAS variants are enriched in the RFX6 network.
a, Scramble shRNA (control) and RFX6 shRNA (shRFX6) pseudoislets (n = 7 matched donors) were multiplexed for single-nucleus RNA-sequencing (snRNA-seq) and single-nucleus ATAC-seq (snATAC-seq) multiome profiling using a randomized block study design. n = 15,825 (snRNA-seq); n = 5,706 (snATAC-seq) nuclei. b, Cell-type assignment by clustering on snRNA-seq data. c, Pseudobulk ATAC-seq signal at marker genes. d, Pathway enrichment of genes (n = 220; g:Profiler, two-tailed hypergeometric test) in top 10 differential β cell regulons (shRFX6 versus control). Significantly enriched pathways highlight a broad similarity of β cells to neurons as electrically active and secretory cells. e,f, Motif enrichment for top 5,000 RFX6-sensitive upregulated (e) and downregulated (f) ATAC-seq peaks in shRFX6 β cell nuclei. Right panels show enlarged views of the outlined area. g,h, Single-value odds ratio of T2D GWAS enrichment (g; nominal P values 0.00478 (RFX6-sensitive peaks) and 3.613 × 10⁻²⁵ (remaining peaks); Bonferroni correction) and model estimate from conditional analysis (h) of RFX6-sensitive peaks. Enrichment remained significant after conditional analysis controlled for remaining (not RFX6-sensitive) peaks. i, Interrogation of UK Biobank data to analyse RFX6 non-coding regulatory SNPs. j, Genetic association (causal effect, beta) of RFX6 regulatory SNPs (n = 7) with islet RFX6 expression (n = 420 independent samples) and T2D trait (n = 442,817 independent samples). Each symbol represents one SNP and error bars show standard errors. All eQTL effects are oriented in the same direction (effect allele leads to reduced expression). Best fit line from MR-Egger is shown in red, indicating that decreased islet RFX6 expression is associated with increased risk for T2D. k, MR analysis on UK Biobank European ancestry reveals significant causal association of RFX6 expression with T2D risk (exposure, RFX6 expression; outcome, T2D). Negative estimate values indicate an inverse causal relationship between exposure and outcome (decreased RFX6 expression leads to increased T2D risk). h,k, Data are mean ± 95% confidence interval.

Similar articles

Cited by

References

    1. Kahn SE, Hull RL & Utzschneider KM Mechanisms linking obesity to insulin resistance and type 2 diabetes. Nature 444, 840–846 (2006). - PubMed
    1. Halban PA et al. β-cell failure in type 2 diabetes: postulated mechanisms and prospects for prevention and treatment. Diabetes Care 37, 1751–1758 (2014). - PMC - PubMed
    1. Mahajan A et al. Fine-mapping type 2 diabetes loci to single-variant resolution using high-density imputation and islet-specific epigenome maps. Nat. Genet. 50, 1505–1513 (2018). - PMC - PubMed
    1. Rai V et al. Single-cell ATAC-seq in human pancreatic islets and deep learning upscaling of rare cells reveals cell-specific type 2 diabetes regulatory signatures. Mol. Metab. 32, 109–121 (2019). - PMC - PubMed
    1. Chiou J et al. Single-cell chromatin accessibility identifies pancreatic islet cell type- and state-specific regulatory programs of diabetes risk. Nat. Genet. 53, 455–466 (2021). - PMC - PubMed

MeSH terms

LinkOut - more resources