. 2024 Jan 15;212(2):245-257.
doi: 10.4049/jimmunol.2300267.

Cytomegalovirus Infection Facilitates the Costimulation of CD57+CD28- CD8 T Cells in HIV Infection and Atherosclerosis via the CD2-LFA-3 Axis

Affiliations

Cytomegalovirus Infection Facilitates the Costimulation of CD57+CD28- CD8 T Cells in HIV Infection and Atherosclerosis via the CD2-LFA-3 Axis

Nicole E Winchester et al. J Immunol. .

Abstract

CD8 T cells are emerging as important mediators in atherosclerosis and cardiovascular disease (CVD). Immune activation may play a particular role in people with HIV (PWH) who are at an increased risk of CVD, even after controlling for known CVD risk factors. Latent CMV infection is associated with increased CVD risk for both PWH and people without HIV, and human CMV-specific CD4 and CD8 T cells are enriched for an immunosenescent phenotype. We previously showed that CMV coinfection in PWH promotes vascular homing and activation of inflammatory CD4 T cells through the CD2-LFA-3 axis. However, the role of CD2/LFA3 costimulation of CD8 T cells in PWH with CMV has yet to be described. In the present study, we demonstrate that CD2 expression on CX3CR1+CD57+CD28- inflammescent CD8 T cells is increased on cells from CMV-seropositive PWH. In vitro CD2/LFA-3 costimulation enhances TCR-mediated activation of these inflammatory CD8 memory T cells. Finally, we show that LFA-3 is highly expressed in aortas of SIV-infected rhesus macaques and in atherosclerotic plaques of people without HIV. Our findings are consistent with a model in which CMV infection enhances CD2 expression on highly proinflammatory CD8 T cells that can then be stimulated by LFA-3 expressed in the vasculature, even in the absence of CD28 costimulation. This model, in which CMV infection exacerbates toxic cytokine and granzyme production by CD8 T cells within the vasculature, highlights a potential therapeutic target in atherosclerosis development and progression, especially for PWH.


Conflict of interest statement

Dr. Lederman has received competitive funding from Gilead. The other authors have declared that no conflict of interest exists.

Figures

Figure 1.
Figure 1.
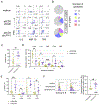
In people without HIV (Cohort A), CD8 CD57+CD28− Tmem have high CD2 and CX3CR1 co-expression. (A) CD57 and CD28 expression on CD8 Tnaive and Tmem. (B) (Left) CD2 and CX3CR1 expression on Tnaive and Tmem subpopulations. (Right) Percent of CD8 Tmem subsets that are CD2hi and CX3CR1+ (n=33). Lines and error bars indicate median and interquartile range. Significance determined by Friedman test. (C) Percent of CD57+CD28−CX3CR1− and CD57+CD28−CX3CR1+ CD8 Tmem that have high CD2 expression (n=33). Lines and error bars indicate median and interquartile range. Significance determined by Wilcoxon signed rank test. (D) (Left) CD2 expression on and CellTraceViolet dilution by CD57+ CD8 Tmem after 7 days of stimulation with medium or IL-15 (n=4). (Right) Mean fluorescence intensity (MFI) of CD2 expression by CD57+CD8 Tmem after 7 days of stimulation with medium or IL-15. Lines and error bars indicate median and interquartile range. Significance determined by Wilcoxon signed rank test.
Figure 2.
Figure 2.
CMV infection is associated with high CD2 expression on CD57+CD28− CD8 memory T cells, regardless of HIV status or CX3CR1 expression. Percent of CD57+CD28− CD8+ Tmem with high CD2 expression was measured for people without HIV (Cohort A, n=15 per group) (A) and PWH on long-term ART (Cohort B, n=11 CMV−, 15 CMV+) (B) and compared by CMV serostatus and CX3CR1 expression. Lines and error bars indicate median and interquartile range. Significance was determined using Mann-Whitney U test. (C) Percent of CD2hi Tinflamm (CD2hiCD57+CD28−CX3CR1+) among CD8 Tmem by CMV and HIV status. Lines and error bars indicate median and interquartile range. Significance was determined using Kruskal-Wallis test with Dunn’s multiple comparisons test.
Figure 3.
Figure 3.
CD57+ Tmem from PWH are enriched for responsiveness to CMV. (A) Percent of CD8 Tmem that are CD57+ in people without HIV (Cohort A, n=15 per group) (left) and PWH on long-term ART (Cohort B, n=11 CMV−, 15 CMV+) (right) compared by CMV serostatus. Lines and error bars indicate median and interquartile range. Significance was determined using Mann-Whitney U test. (B) Representative pseudocolor plots from CMV− PWoH (HIV-CMV−, n=7, Cohort A), CMV+ PWoH (HIV-CMV+, n=10, Cohort A), CMV− PWH (HIV+CMV−, n=8, Cohort B), or CMV+ PWH (HIV+CMV+, n=10, Cohort B) showing CD25 expression and CellTraceViolet dilution after 7 days of stimulation with medium, anti-CD3/anti-CD28, CMV pp65 peptide pool, or HIV Gag peptide array. (C) Percent of CD57+ Tmem from donors in Panel B that have diluted CellTraceViolet (CTVlo). Lines and error bars indicate median and interquartile range. Significance was determined using Kruskal-Wallis test with Dunn’s multiple comparisons test. (D) (Left) Representative pseudocolor plots from CMV+ PWoH (n=11, Cohort A) and CMV+ PWH (n=8, Cohort B) showing CD69 and CD137 expression on CD2lo or CD2hi CD57+ CD8 Tmem after overnight stimulation with medium control or CMV pp65 peptide pool. (Right) Percent of CD2lo or CD2hi CD57+ CD8 Tmem that are CD69+CD137+. Significance determined using Wilcoxon signed rank tests.
Figure 4.
Figure 4.
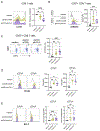
TCR engagement and costimulation of PBMCs from CMV+ PWH with LFA-3 more robustly increases synthesis of intracellular cytokines and cytolytic molecules than does costimulation with CD28. (A) Representative pseudocolor plots showing intracellular IFNγ, IL-2, MIP-1β, and TNF in CD57+ CD8 Tmem from CMV+ PWH (n=10 for medium and CD3/CD28, n=8 for CD3/LFA-3, Cohort B) after 6 hours of stimulation with indicated stimulations. (B) Proportions of CD57+ CD8 Tmem expressing multiple intracellular cytokines following indicated stimulations. Significance determined by SPICE permutation test. (C) (Left) Percent of CD57+ CD8 Tmem expressing at least one cytokine following indicated stimulations. Lines and error bars indicate median and interquartile range. Significance determined by Mann-Whitney U test. (Right) Percent of cells expressing IFNγ, IL-2, MIP-1β, or TNF following indicated stimulations. Lines and error bars indicate median and interquartile range. Significance determined by Mann-Whitney U tests. (D) (Left) Granzyme B and perforin expression by CD57+ CD8 Tmem from CMV+ PWH (n=6, Cohort B) following 2 days of stimulation. (Right) Percent of CD57+ CD8 Tmem that co-express granzyme B and perforin above medium control background following 2 days of stimulation. Lines and error bars indicate median and interquartile range. Significance determined by Mann-Whitney U test.
Figure 5.
Figure 5.
Similar patterns of proliferation, metabolic activity, mitochondrial biogenesis, and survival are induced by TCR engagement and costimulation with LFA-3 or CD28. (A) Representative histograms (left) and graph (right) of CD57 expression on CD8 T cells from CMV+ PWH (n=12, Cohort B) after 2 days of stimulation with medium, CD3/CD28, or CD3/LFA-3. Lines and error bars indicate median and interquartile range. Significance determined by Kruskal-Wallis test with Dunn’s multiple comparisons test. (B) Representative histograms (left) and graph (right) of 2NBDG uptake by CD57+ CD8 T cells after indicated stimulation. Lines and error bars indicate median and interquartile range. Significance determined by Kruskal-Wallis test with Dunn’s multiple comparisons test. (C) (Left) Representative pseudocolor plots showing cell cycling and proliferation as measured by Ki67 expression and CellTraceViolet (CTV) dilution following 5 days of stimulation with medium, CD3/CD28, or CD3/LFA-3. (Right) Percent of cells that proliferated (CTVloKi67+) following stimulation with CD3/CD28 or CD3/LFA-3 for 5 days. Lines and error bars indicate median and interquartile range. Significance determined by Kruskal-Wallis test with Dunn’s multiple comparisons test. (D) Representative histograms (left) and graphs (right) of TFAM levels in cells following 4 days of stimulation with medium, CD3/CD28 or CD3/LFA-3 among cells that did not proliferate (CTVhi) and cells that proliferated (CTVlo). Lines and error bars indicate median and interquartile range. Significance determined by Kruskal-Wallis test with Dunn’s multiple comparisons test. (E) Representative histograms (left) and graphs (right) of Bcl-2 levels in cells following 5 days of stimulation with medium, CD3/CD28 or CD3/LFA-3 among cells that did not proliferate (CTVhi) and cells that proliferated (CTVlo). Lines and error bars indicate median and interquartile range. Significance determined by Kruskal-Wallis test with Dunn’s multiple comparisons test.
Figure 6.
Figure 6.
LFA-3 is highly expressed in inflamed vasculature of both SIV/SHIV+ macaques and human atherosclerotic tissues. (A) (Left) Representative images of LFA-3 (green) and DAPI (blue) expression in cryopreserved aortas of rhesus macaques that are uninfected (n=22) or infected with SIV (n=10) or SHIV (n=5). (Right) Quantity of LFA-3 expressed in the aortas of rhesus macaques by SIV/SHIV infection status, as measured by MFI. Lines and error bars indicate median and interquartile range. Significance determined by Mann-Whitney U test. (B) (Left) Representative images of LFA-3 (green) and DAPI (blue) expression in vasculature of PWoH with (n=8, Cohort E) and without known atherosclerosis (n=14, Cohort E). (Right) Quantity of LFA-3 expressed in the vasculature of PWoH with and without atherosclerosis (Cohort E). Lines and error bars indicate median and interquartile range. Significance determined by Mann-Whitney U test (C) LFA3 gene expression by human aortic endothelial cells (HAoECs) (red) and human aortic smooth muscle cells (HAoSMCs) (blue) after stimulation with or without TNF for 7 days. Lines and error bars indicate median and interquartile range. Significance determined by Kruskal-Wallis test with Dunn’s multiple comparison post-test. (D) (Left) Percent of CD8 T cells expressing CD57 in matched atherosclerotic plaques and peripheral blood of CMV seronegative and seropositive adults (n=4 per group, Cohort D). Lines and error bars indicate median and interquartile range. Significance determined by Mann-Whitney U test. (Right) Correlation between CD57 expression by CD8 T cells in atherosclerotic plaques and peripheral blood amongst CMV− and CMV+ individuals (Cohort D). Correlation coefficient and significance determined by Spearman correlation analysis. (E) Percentage of parent (input) or adherent CD8 T cells expressing CD57 from CMV− PWoH (HIV-CMV−, n=7, Cohort A), CMV+ PWoH (HIV-CMV+, n=7, Cohort A), and CMV+ PWH (HIV+CMV+, n=7, Cohort B) after 30 minutes of co-culture with primary human coronary artery endothelial cells (HCAECs). Significance determined with Wilcoxon signed rank tests. (F) (Left) Number of adherent CD57+ CD8 T cells after 30 minutes of co-culture with HCAECs that had been pre-treated overnight with medium or 100ng/mL TNF. (Right) Correlation between CD57 expression by CD8 T cells and the TNF-associated change in the number of adherent CD57+ CD8 T cells after co-culture (NumberTNF - NumberMedium). Correlation coefficient and significance determined by Spearman correlation analysis.
Figure 7.
Figure 7.
Proposed model of the CD2/LFA-3 axis in CD57+CD28− CD8 T cell activation and vascular endothelial cell interactions. During HIV and CMV infections, CD8 T cells may receive CD2/LFA-3 costimulation during priming leading to activation, expansion, and differentiation into CD57+CD28− T cells that express CX3CR1 (Tinflamm). Upon encountering chemokines (such as CX3CL1) and inflammatory cytokines released from activated endothelial cells, these cells migrate toward the vascular endothelium where they directly adhere to and interact with LFA-3-expressing endothelial cells. CD2/LFA-3 costimulation at this stage results in the release of effector molecules such as granzymes and TNF. These molecules then contribute to endothelial cell activation and potentially cell death.

Similar articles

  • Immunodeficiency.
    Justiz Vaillant AA, Qurie A. Justiz Vaillant AA, et al. 2023 Jun 26. In: StatPearls [Internet]. Treasure Island (FL): StatPearls Publishing; 2025 Jan–. 2023 Jun 26. In: StatPearls [Internet]. Treasure Island (FL): StatPearls Publishing; 2025 Jan–. PMID: 29763203 Free Books & Documents.
  • Depressing time: Waiting, melancholia, and the psychoanalytic practice of care.
    Salisbury L, Baraitser L. Salisbury L, et al. In: Kirtsoglou E, Simpson B, editors. The Time of Anthropology: Studies of Contemporary Chronopolitics. Abingdon: Routledge; 2020. Chapter 5. In: Kirtsoglou E, Simpson B, editors. The Time of Anthropology: Studies of Contemporary Chronopolitics. Abingdon: Routledge; 2020. Chapter 5. PMID: 36137063 Free Books & Documents. Review.
  • Peer Play.
    Scott HK, Cogburn M. Scott HK, et al. 2023 Jul 4. In: StatPearls [Internet]. Treasure Island (FL): StatPearls Publishing; 2025 Jan–. 2023 Jul 4. In: StatPearls [Internet]. Treasure Island (FL): StatPearls Publishing; 2025 Jan–. PMID: 30020595 Free Books & Documents.
  • Regulation of the cell surface expression of classical and non-classical MHC proteins by the human cytomegalovirus UL40 and rhesus cytomegalovirus Rh67 proteins.
    Brackenridge S, John N, He W, Früh K, Borrow P, McMichael A. Brackenridge S, et al. J Virol. 2024 Sep 17;98(9):e0120624. doi: 10.1128/jvi.01206-24. Epub 2024 Aug 29. J Virol. 2024. PMID: 39207137 Free PMC article.
  • Adenosine Deaminase Deficiency.
    Hershfield M, Tarrant T. Hershfield M, et al. 2006 Oct 3 [updated 2024 Mar 7]. In: Adam MP, Feldman J, Mirzaa GM, Pagon RA, Wallace SE, Amemiya A, editors. GeneReviews® [Internet]. Seattle (WA): University of Washington, Seattle; 1993–2025. 2006 Oct 3 [updated 2024 Mar 7]. In: Adam MP, Feldman J, Mirzaa GM, Pagon RA, Wallace SE, Amemiya A, editors. GeneReviews® [Internet]. Seattle (WA): University of Washington, Seattle; 1993–2025. PMID: 20301656 Free Books & Documents. Review.

Cited by

References

    1. Schouten J, Wit FW, Stolte IG, Kootstra NA, van der Valk M, Geerlings SE, Prins M, Reiss P, and Group AGCS. 2014. Cross-sectional comparison of the prevalence of age-associated comorbidities and their risk factors between HIV-infected and uninfected individuals: the AGEhIV cohort study. Clin Infect Dis 59: 1787–1797. - PubMed
    1. Shah ASV, Stelzle D, Lee KK, Beck EJ, Alam S, Clifford S, Longenecker CT, Strachan F, Bagchi S, Whiteley W, Rajagopalan S, Kottilil S, Nair H, Newby DE, McAllister DA, and Mills NL. 2018. Global Burden of Atherosclerotic Cardiovascular Disease in People Living With HIV: Systematic Review and Meta-Analysis. Circulation 138: 1100–1112. - PMC - PubMed
    1. Berry NJ, Burns DM, Wannamethee G, Grundy JE, Lui SF, Prentice HG, and Griffiths PD. 1988. Seroepidemiologic studies on the acquisition of antibodies to cytomegalovirus, herpes simplex virus, and human immunodeficiency virus among general hospital patients and those attending a clinic for sexually transmitted diseases. J Med Virol 24: 385–393. - PubMed
    1. Lang DJ, Kovacs AA, Zaia JA, Doelkin G, Niland JC, Aledort L, Azen SP, Fletcher MA, Gauderman J, Gjerset GJ, and et al. 1989. Seroepidemiologic studies of cytomegalovirus and Epstein-Barr virus infections in relation to human immunodeficiency virus type 1 infection in selected recipient populations. Transfusion Safety Study Group. J Acquir Immune Defic Syndr (1988) 2: 540–549. - PubMed
    1. Staras SA, Dollard SC, Radford KW, Flanders WD, Pass RF, and Cannon MJ. 2006. Seroprevalence of cytomegalovirus infection in the United States, 1988–1994. Clin Infect Dis 43: 1143–1151. - PubMed

Publication types