. 2023 Dec 1;14(1):7922.
doi: 10.1038/s41467-023-43424-7.

Intrinsic factors and CD1d1 but not CD1d2 expression levels control invariant natural killer T cell subset differentiation

Affiliations

Intrinsic factors and CD1d1 but not CD1d2 expression levels control invariant natural killer T cell subset differentiation

Ludivine Amable et al. Nat Commun. .

Abstract

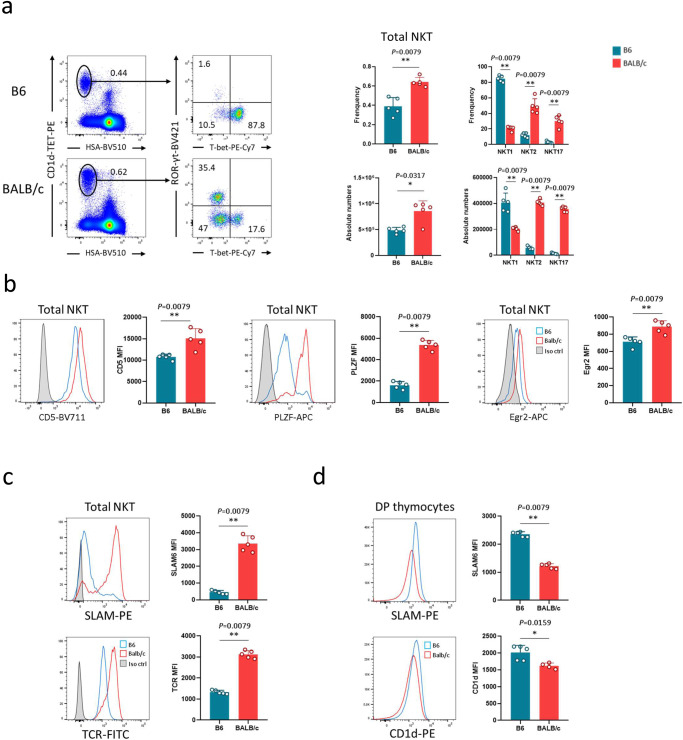
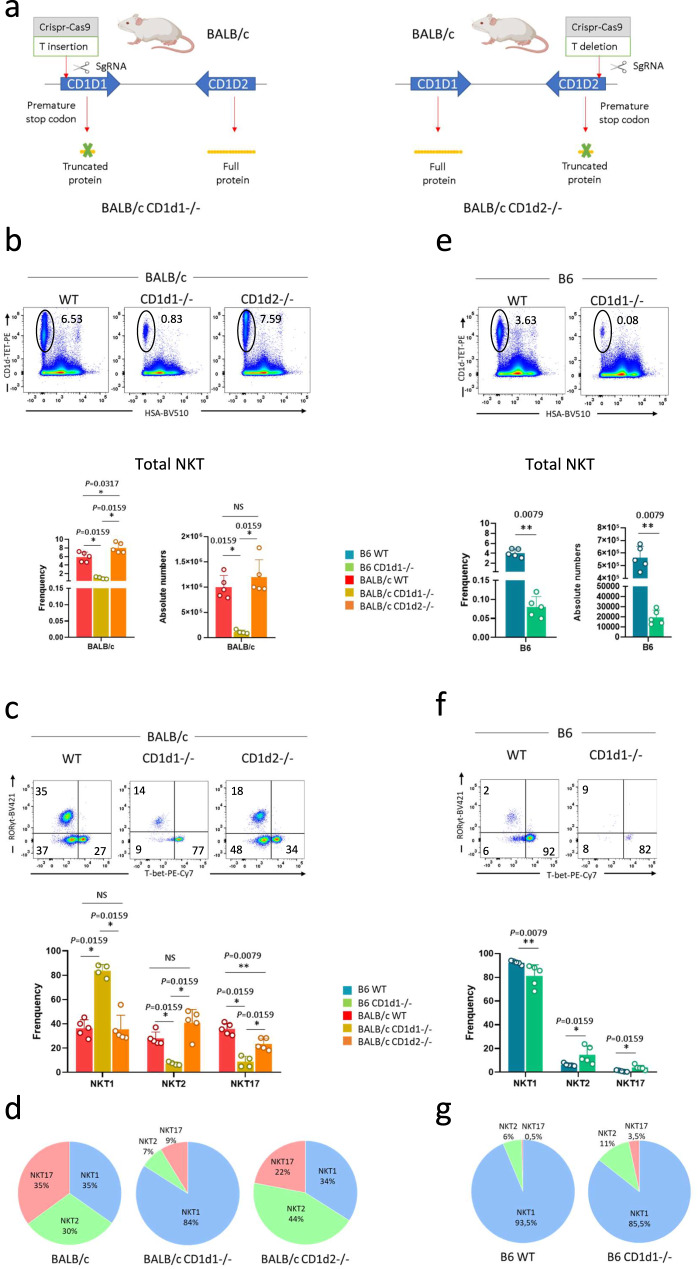
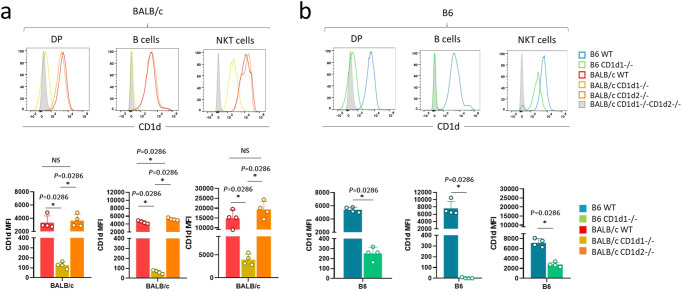
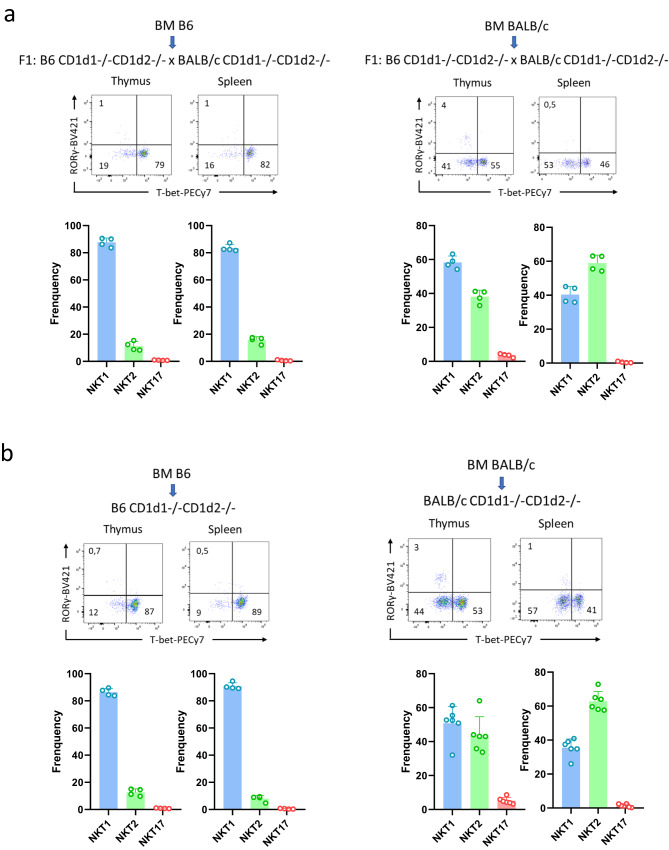
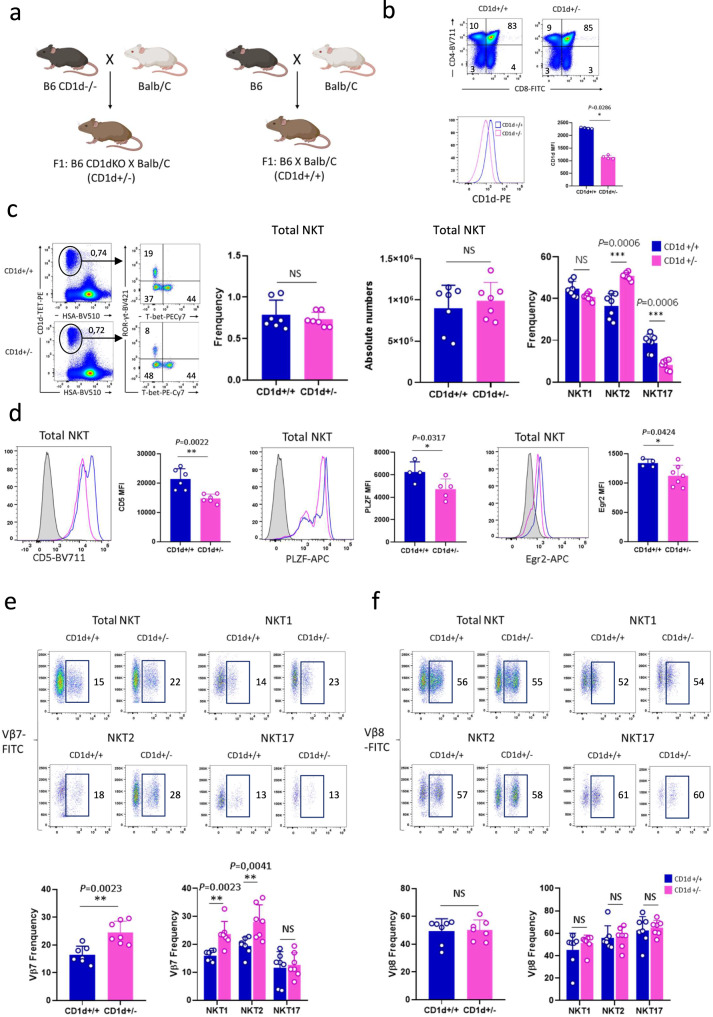
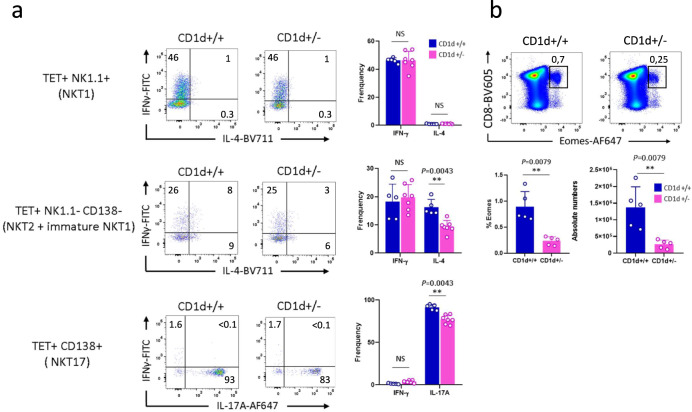
Invariant natural killer T (NKT) cell subsets are defined based on their cytokine-production profiles and transcription factors. Their distribution is different in C57BL/6 (B6) and BALB/c mice, with a bias for NKT1 and NKT2/NKT17 subsets, respectively. Here, we show that the non-classical class I-like major histocompatibility complex CD1 molecules CD1d2, expressed in BALB/c and not in B6 mice, could not account for this difference. We find however that NKT cell subset distribution is intrinsic to bone marrow derived NKT cells, regardless of syngeneic CD1d-ligand recognition, and that multiple intrinsic factors are likely involved. Finally, we find that CD1d expression levels in combination with T cell antigen receptor signal strength could also influence NKT cell distribution and function. Overall, this study indicates that CD1d-mediated TCR signals and other intrinsic signals integrate to influence strain-specific NKT cell differentiation programs and subset distributions.


Conflict of interest statement

The authors declare no competing interests.

Figures

Fig. 1
Fig. 1. TCR signal strength differs between B6 and BALB/c NKT cells.
a Representative staining for NKT1 (T-bet+), NKT2 (T-betRORγt), and NKT17 (RORγt+) subsets among thymic NKT cells from B6 (n = 5) and BALB/c (n = 5) mice. Numbers on dot plots correspond to frequencies. Individual/mean + SEM of mean frequency and absolute numbers for total NKT cells and each NKT cell subset are shown in the right panel. Statistics were calculated with the nonparametric Mann-Whitney test, two-sided, frequency B6 vs. BALB/c: **P = 0.0079; absolute numbers B6 vs. BALB/c:  *P = 0.0317; frequency NKT1, NKT2, and NKT17 B6 vs. BALB/c: **P = 0.0079 for all subsets; absolute numbers NKT1, NKT2, and NKT17 B6 vs. BALB/c: **P = 0.0079 for all subsets. b Representative staining for CD5, PLZF, and Egr2, in total thymic NKT cells from B6 (n = 5) and BALB/c (n = 5) mice. Individual/mean + SEM of mean MFI of these markers are shown to the right of each histogram plot. Statistics were calculated with the nonparametric Mann-Whitney test, two-sided, frequency CD5, PLZF, and Egr2 MFI B6 vs. BALB/c: **P = 0.0079 for all markers. c Representative staining for SLAM6 and TCR in total thymic NKT cells from B6 (n = 5) and BALB/c (n = 5) mice. Individual/mean + SEM of mean MFI of these markers are shown in the right panel. Statistics were calculated with the nonparametric Mann-Whitney test, two-sided, frequency SLAM6 MFI B6 vs. BALB/c: **P = 0.0079; TCR MFI B6 vs. BALB/c: **P = 0.0079. d. Representative staining for SLAM6 and CD1d on cortical DP thymocytes from B6 (n = 5) and BALB/c (n = 5) mice. Individual/mean + SEM of mean MFI of these markers are shown in the right panel. Statistics were calculated with the nonparametric Mann-Whitney test, two-sided, frequency SLAM6 MFI B6 vs. BALB/c: **P = 0.0079; CD1d MFI B6 vs. BALB/c: *P = 0.0159. Data are representative of 7, 5, 4, and 4 experiments in ad, respectively, with 7-8-week-old mice. Source data are provided as a Source Data file.
Fig. 2
Fig. 2. CD1d1 and CD1d2 influence on NKT cell selection and distribution.
a Schematic of Cd1d1 and Cd1d2 status in the mouse strains indicated. bd Representative staining of total NKT cells (CD1d-tet+HSA-) b or of NKT1 (T-bet+), NKT2 (T-betRORγt), and NKT17 (RORγt+) subsets among thymic NKT cells from BALB/c WT (n = 5), BALB/c CD1d−/− (n = 4), and BALB/c CD1d2−/− (n = 5) mice c. Values indicated on dot plots represent frequencies. Individual/mean + SEM of mean frequency and absolute numbers for total NKT cells b, and individual/mean + SEM of mean frequency for NKT cell subsets c are shown below. The latter results are also shown in pie chart for clarity d. eg As in b-d for B6 WT (n = 5) and CD1d−/− (n = 5) mice. Data are representative of four experiments in b-d, and three experiments in e-g with 7-8-week-old mice. Statistics were calculated with the nonparametric Mann-Whitney test, two-sided, *P < 0.05, **P < 0.01. NS not significant (P > 0.05). Source data are provided as a Source Data file.
Fig. 3
Fig. 3. CD1d expression in CD1d1 and CD1d2 deficient mice.
ab Representative staining for CD1d expression on cortical thymocytes (DP), B cells, and NKT cells from BALB/c WT (n = 4), BALB/c CD1d1−/− (n = 4), and BALB/c CD1d2−/− (n = 4) a or B6 WT (n = 4), and B6 CD1d1−/− (n = 4) b mice. Individual/mean + SEM of mean MFI for these markers are shown below. Data are representative of three experiments with 7-8-week-old mice. Statistics were calculated with the nonparametric Mann-Whitney test, two-sided, *P < 0.05. NS not significant (P > 0.05). Source data are provided as a Source Data file.
Fig. 4
Fig. 4. Factors intrinsic to hematopoietic cells contribute to the differential NKT cell subset distribution profile.
a Representative staining of NKT1 (T-bet+), NKT2 (T-betRORγt), and NKT17 (RORγt+) subsets among thymic and splenic NKT cells from the indicated left (n = 4) and right (n = 4) bone marrow chimeras. Numbers on dot plots represent frequencies. Individual/mean + SEM of mean frequency for each thymic and splenic NKT cell subset are shown below. b Representative thymic and splenic staining as in a. with n = 4 and n = 6 for the indicated left and right chimeras, respectively. Data are representative of three experiments in a. and five experiments in b. with 7-8-week-old mice. Source data are provided as a Source Data file.
Fig. 5
Fig. 5. CD1d-mediated ligand recognition does not influence NKT cell specification.
a Schematic of chimeric mice generation. b Representative staining for NKT1 (T-bet+), NKT2 (T-betRORγt), and NKT17 (RORγt+) subsets among thymic and splenic NKT cells in B6 (H-2Kb) and BALB/c (H-2Kd) compartments from the B6 + BALB/c (n = 9), B6 + BALB/c CD1d1−/−CD1d2−/− (n = 4), and BALB/c + B6 CD1d1−/−CD1d2−/− (n = 6), mixed bone marrow chimeras. Individual/mean + SEM of mean MFI for these markers are shown below. Statistics were calculated with the nonparametric Mann-Whitney test, two-sided, frequency thymus NKT1, NKT2 and NKT17 H-2Kb (B6) vs. H2-Kd (BALB/c) in B6 + BALB/c chimeras: ****P < 0.0001, ****P < 0.0001, *P = 0.0142; frequency thymus NKT1, NKT2 and NKT17 H-2Kb (B6) vs. H2-Kd (BALB/c) in B6 + BALB/c CD1d1−/−CD1d2−/− chimeras: *P = 0.0286 for all subsets; frequency thymus NKT1, NKT2 and NKT17 H-2Kb (B6) vs. H2-Kd (BALB/c) in BALB/c + B6 CD1d1−/−CD1d2−/− chimeras: **P = 0.0022, **P = 0.0043, **P = 0.0087. frequency spleen NKT1, NKT2 and NKT17 H-2Kb (B6) vs. H2-Kd (BALB/c) in B6 + BALB/c chimeras: ****P < 0.0001, ****P < 0.0001, *P = 0.0195; frequency spleen NKT1, NKT2 and NKT17 H-2Kb (B6) vs. H2-Kd (BALB/c) in B6 + BALB/c CD1d1−/−CD1d2−/− chimeras: *P = 0.0286, *P = 0.0286, NS: not significant (P > 0.05); frequency spleen NKT1, NKT2 and NKT17 H-2Kb (B6) vs. H2-Kd (BALB/c) in BALB/c + B6 CD1d1−/−CD1d2−/− chimeras: **P = 0.0022, **P = 0.0022, NS: not significant (P > 0.05). Data are representative of four experiments (B6 + BALB/c chimeras), and five experiments (B6 + BALB/c CD1d1−/−CD1d2−/− and BALB/c + B6 CD1d1−/−CD1d2−/− chimeras) with 7-8-week-old mice. Source data are provided as a Source Data file.
Fig. 6
Fig. 6. Differential expression levels of key intrinsic factors involved in NKT cell subset development and/or function in B6 vs BALB/c mice.
a GATA3 expression. Individual/mean + SEM of mean MFI for GATA3 in the indicated NKT cell subsets and mouse strain. b EZH2 mRNA expression profiles in the indicated subsets and mouse strains. Chip-based transcriptome analysis was performed as described in Georgiev et al. (ref. ). RU (RNA units) represents an arbitrary indicator of expression strength. Data are from two independently-performed transcriptome analyses for each strain: BALB/c and B6 (n = 2). c H3K27me3 expression. Individual/mean + SEM of mean MFI for H3K27me3 in the indicated NKT cell subsets and mouse strains. d NRP2 mRNA expression profiles. Same as in b. Statistics were calculated with the nonparametric Mann-Whitney test, two-sided, *P < 0.05. NS not significant (P > 0.05). e Thymic sections from B6 (top) and BALB/c (bottom) 4get mice, showing detection of NKT2 cells (GFP+), stained with anti-Nrp2 antibody and counterstained with DAPI. Scale bar: 20 µm. The histogram shows the mean fluorescence intensity level for Nrp2 above background. n = 21 and 7 cells for BALB/c and B6 tissues, respectively. Data in a and c are representative of three experiments on 7-8-week-old mice, n = 4 per strain in each experiment. Data in e are representative of two independent experiments. Statistics were calculated with the nonparametric Mann-Whitney test, two-sided, fluorescence intensity (a.u.) B6 vs. BALB/c: ****P < 0.0001. NS not significant (P > 0.05). Source data are provided as a Source Data file.
Fig. 7
Fig. 7. CD1d expression levels affect NKT cell subset composition.
a Crossing strategy used to obtain the indicated mice. b Upper panel: representative staining for CD4 and CD8 expression in thymocytes from CD1+/+ (n = 4) and CD1d+/− (n = 4) mice. Numbers on dot plots correspond to frequencies. Lower panel: Representative staining for CD1d expression on DP cortical thymocytes from CD1+/+ (n = 4) and CD1d+/− (n = 4) mice. Individual/mean + SEM of mean MFI are shown on the right. c Representative staining for NKT1 (T-bet+), NKT2 (T-betRORγt), and NKT17 (RORγt+) subsets among thymic NKT cells from CD1d+/+ (n = 7) and CD1d+/− (n = 7) mice. Numbers on dot plots represent frequencies. Individual/mean + SEM of mean frequency and absolute numbers of total NKT cells and frequency in each NKT cell subset are shown in the right panel. d Representative staining for CD5, PLZF, and Egr2 in total thymic NKT cells from CD1d+/+ (n = 6, 4, and 4 for CD5, PLZF, and Egr2, respectively) and CD1d+/− (n = 6, 5, and 7 for CD5, PLZF, and Egr2, respectively) mice. Individual/mean + SEM of mean MFI for these markers are shown in the right panel. e, f Representative staining for Vβ7 e and Vβ8 f expression on NKT cells and NKT cell subsets from CD1+/+ (n = 7) and CD1d+/− (n = 7) mice. Numbers on dot plots correspond to frequencies. Individual/mean + SEM of mean frequency of total NKT cells and of each NKT cell subset are shown below. Data are representative of four experiments with 7-8-week-old mice. Statistics were calculated with the nonparametric Mann-Whitney test, two-sided, *P < 0.05, **P < 0.01, ***P < 0.001. NS not significant (P > 0.05). Source data are provided as a Source Data file.
Fig. 8
Fig. 8. CD1d-expression levels affect acquisition of NKT cell function.
a Representative staining for IL-4, IFN-γ, and IL-17 among thymic NKT cell subsets from CD1d+/+ (n = 5 for NKT1, n = 5 for NKT2 + immature NKT1, and n = 5 for NKT17) and CD1d+/− (n = 7 for NKT1, n = 7 for NKT2 + immature NKT1, and n = 7 for NKT17) mice. Values indicated on dot plots represent frequencies. Individual/mean + SEM of mean frequency of cytokine-positive NKT cells are shown on the right. b Representative Eomes staining pattern among thymic CD8-positive cells from CD1d+/+ (n = 5) and CD1d+/− (n = 5) mice. Numbers on dot plots represent frequencies. Individual/mean + SEM of mean frequency and absolute numbers are shown below. Data are representative of three experiments on 7-8-week-old mice. Statistics were calculated with the nonparametric Mann-Whitney test, two-sided, *P < 0.05, **P < 0.01. NS not significant (P > 0.05). Source data are provided as a Source Data file.

Similar articles

Cited by

References

    1. Gapin L, Matsuda JL, Surh CD, Kronenberg M. NKT cells derive from double-positive thymocytes that are positively selected by CD1d. Nat. Immunol. 2001;2:971–978. doi: 10.1038/ni710. - DOI - PubMed
    1. Lantz O, Bendelac A. An invariant T cell receptor alpha chain is used by a unique subset of major histocompatibility complex class I-specific CD4+ and CD4-8- T cells in mice and humans. J. Exp. Med. 1994;180:1097–1106. doi: 10.1084/jem.180.3.1097. - DOI - PMC - PubMed
    1. Alonzo ES, et al. Development of promyelocytic zinc finger and ThPOK-expressing innate gamma delta T cells is controlled by strength of TCR signaling and Id3. J. Immunol. 2010;184:1268–1279. doi: 10.4049/jimmunol.0903218. - DOI - PMC - PubMed
    1. Kovalovsky D, et al. The BTB-zinc finger transcriptional regulator PLZF controls the development of invariant natural killer T cell effector functions. Nat. Immunol. 2008;9:1055–1064. doi: 10.1038/ni.1641. - DOI - PMC - PubMed
    1. Savage AK, et al. The transcription factor PLZF directs the effector program of the NKT cell lineage. Immunity. 2008;29:391–403. doi: 10.1016/j.immuni.2008.07.011. - DOI - PMC - PubMed

LinkOut - more resources