

Endogenous H2O2 Self-Replenishment and Sustainable Cascades Enhance the Efficacy of Sonodynamic Therapy
- PMID: 38026520
- PMCID: PMC10656771
- DOI: 10.2147/IJN.S431221
Endogenous H2O2 Self-Replenishment and Sustainable Cascades Enhance the Efficacy of Sonodynamic Therapy
Abstract
Purpose: Sonodynamic therapy (SDT), with its high tissue penetration and noninvasive advantages, represents an emerging approach to eradicating solid tumors. However, the outcomes of SDT are typically hampered by the low oxygen content and immunosuppression in the tumor microenvironment (TME). Accordingly, we constructed a cascade nanoplatform to regulate the TME and improve the anti-tumor efficiency of SDT.
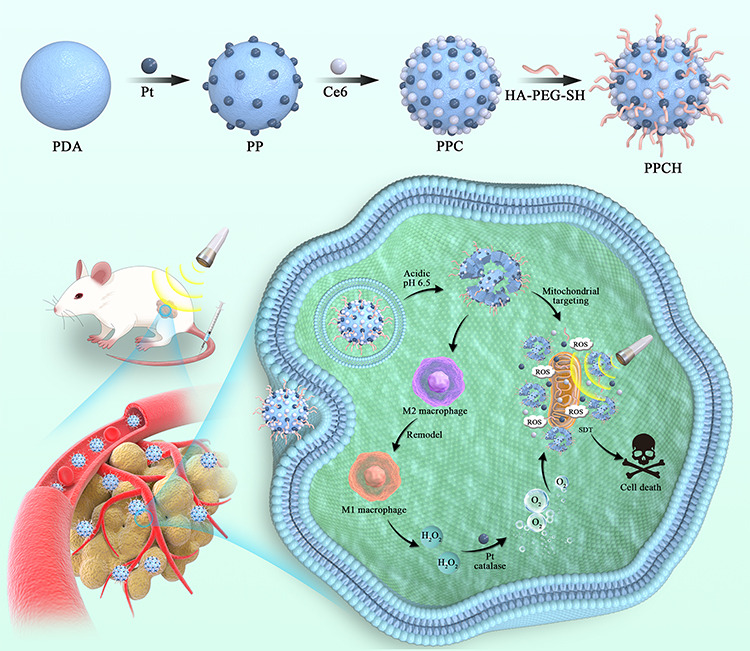
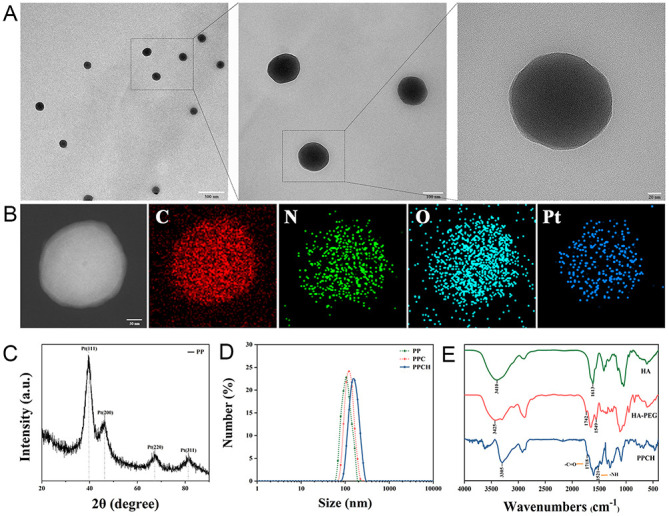
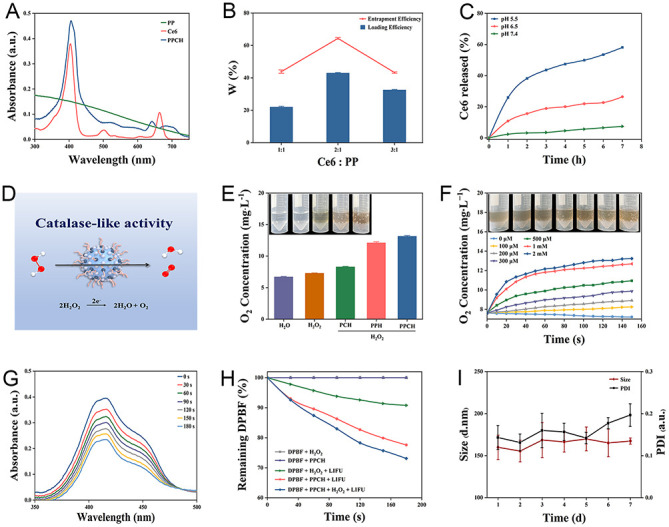
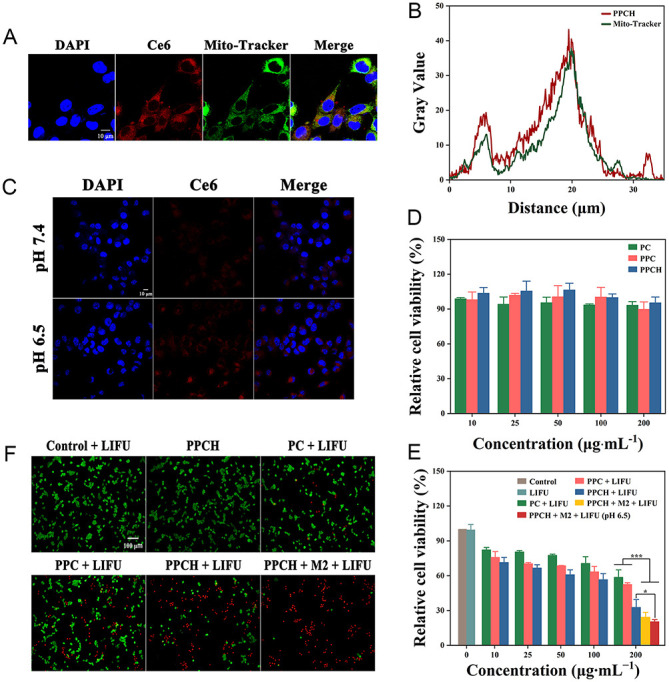
Methods: In this study, we rationally design cascade nanoplatform by incorporating immunostimulant hyaluronic acid (HA) and sonosensitizer chlorin e6 (Ce6) on the polydopamine nanocarrier that is pre-doped with platinum nanozymes (designated Ce6/Pt@PDA-HA, PPCH).
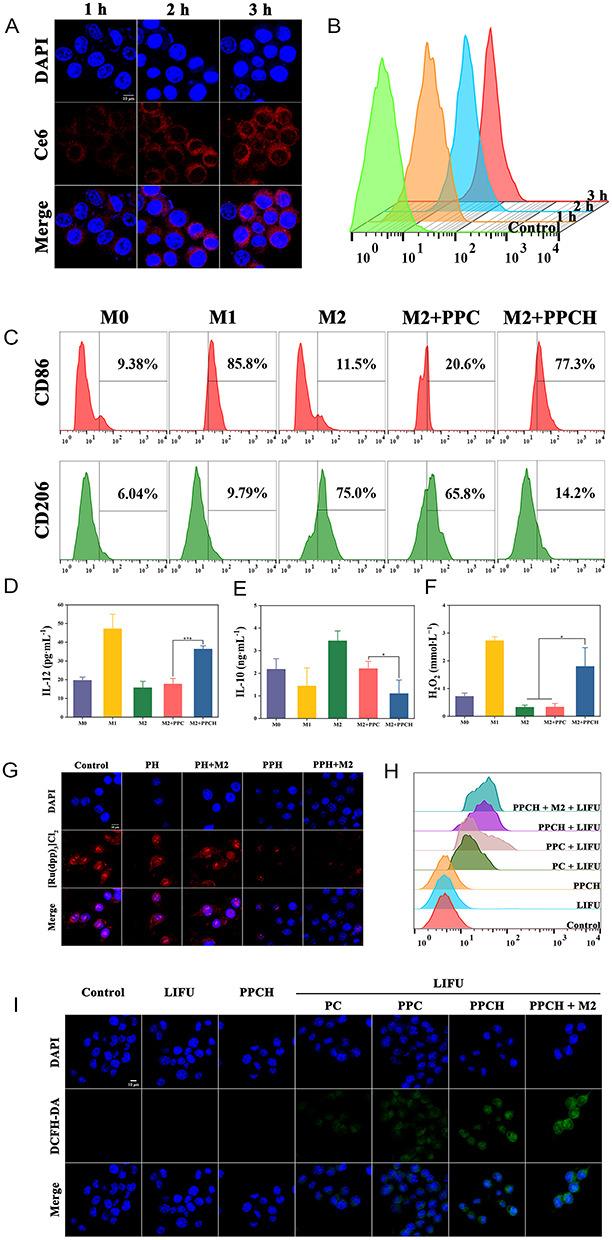
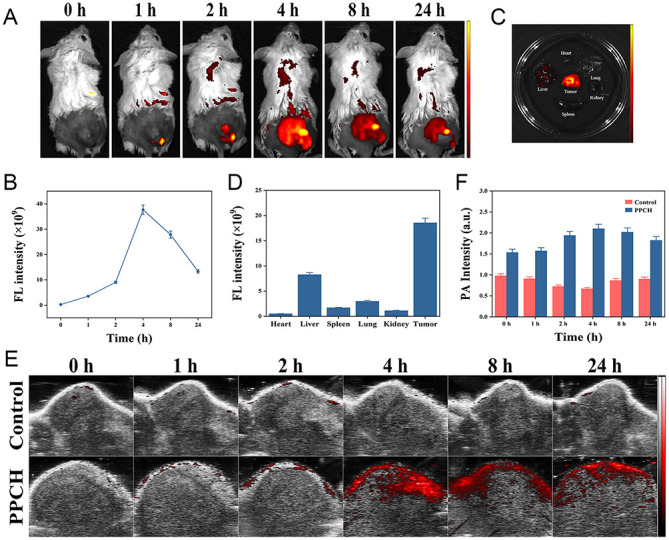
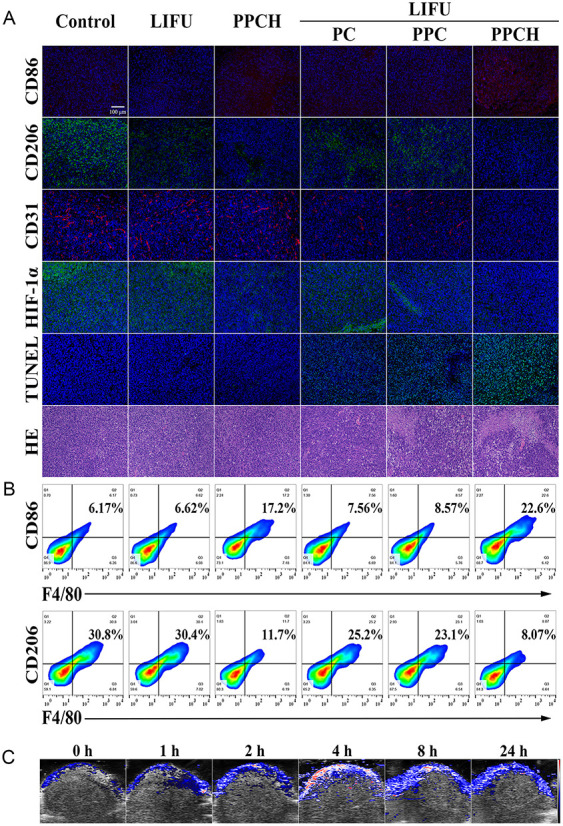
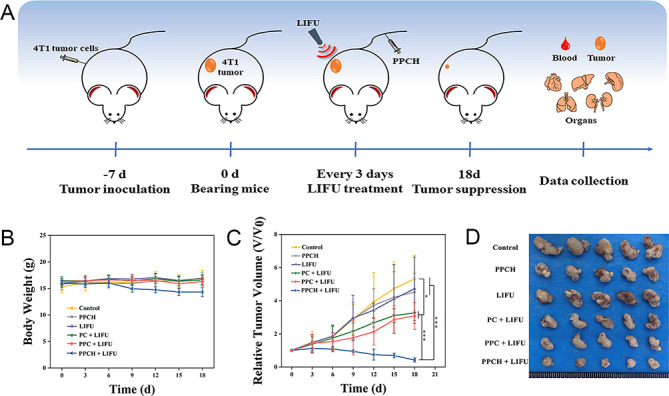
Results: The cascade reactions of PPCH are evidenced by the results that HA exhibits reversing immunosuppressive that converts M2 macrophages into M1 macrophages in situ, while producing H2O2, and then platinum nanozymes further catalyze the H2O2 to produce O2, and O2 produces abundant singlet oxygen (1O2) under the action of Ce6 and low-intensity focused ultrasound (LIFU), resulting in a domino effect and further amplifying the efficacy of SDT. Due to its pH responsiveness and mitochondrial targeting, PPCH effectively accumulates in tumor cells. Under LIFU irradiation, PPCH effectively reverses immunosuppression, alleviates hypoxia in the TME, enhances reactive oxygen species (ROS) generation, and enhances SDT efficacy for eliminating tumor cells in vivo and in vitro. Meanwhile, an in vivo dual-modal imaging including fluorescence and photoacoustic imaging achieves precise tumor diagnosis.
Conclusion: This cascade nanoplatform will provide a promising strategy for enhancing SDT eradication against tumors by modulating immunosuppression and relieving hypoxia.
Keywords: cascade reactions; sonodynamic therapy; tumor hypoxia; tumor microenvironment; tumor-associated macrophages.
© 2023 Du et al.
Conflict of interest statement
The authors report no conflicts of interest in this work.
Figures
Similar articles
-
A versatile nanoplatform carrying cascade Pt nanozymes remodeling tumor microenvironment for amplified sonodynamic/chemo therapy of thyroid cancer.Biomaterials. 2025 Feb;313:122778. doi: 10.1016/j.biomaterials.2024.122778. Epub 2024 Aug 26. Biomaterials. 2025. PMID: 39213978
-
A transformable and self-oxygenated smart probe for enhanced tumor sonodynamic therapy.Acta Biomater. 2024 Aug;184:409-418. doi: 10.1016/j.actbio.2024.06.019. Epub 2024 Jun 20. Acta Biomater. 2024. PMID: 38908418
-
A hydrogen peroxide economizer for on-demand oxygen production-assisted robust sonodynamic immunotherapy.Theranostics. 2022 Jan 1;12(1):59-75. doi: 10.7150/thno.64862. eCollection 2022. Theranostics. 2022. PMID: 34987634 Free PMC article.
-
Engineering Sonosensitizer-Derived Nanotheranostics for Augmented Sonodynamic Therapy.Small. 2024 Nov;20(44):e2402669. doi: 10.1002/smll.202402669. Epub 2024 Jul 6. Small. 2024. PMID: 38970544 Review.
-
Strategies to Reverse Hypoxic Tumor Microenvironment for Enhanced Sonodynamic Therapy.Adv Healthc Mater. 2024 Jan;13(1):e2302028. doi: 10.1002/adhm.202302028. Epub 2023 Sep 17. Adv Healthc Mater. 2024. PMID: 37672732 Review.
References
-
- Fu J, Li T, Zhu Y, Hao Y. Ultrasound‐activated oxygen and ROS generation nanosystem systematically modulates tumor microenvironment and sensitizes sonodynamic therapy for hypoxic solid tumors. Adv Funct Mater. 2019;29:1906195. doi:10.1002/adfm.201906195 - DOI
MeSH terms
Substances
LinkOut - more resources
Full Text Sources
