. 2024 Feb 1;35(2):ar16.
doi: 10.1091/mbc.E23-11-0427. Epub 2023 Nov 29.

Effects of phosphorylation on Drp1 activation by its receptors, actin, and cardiolipin

Affiliations

Effects of phosphorylation on Drp1 activation by its receptors, actin, and cardiolipin

Ao Liu et al. Mol Biol Cell. .

Abstract

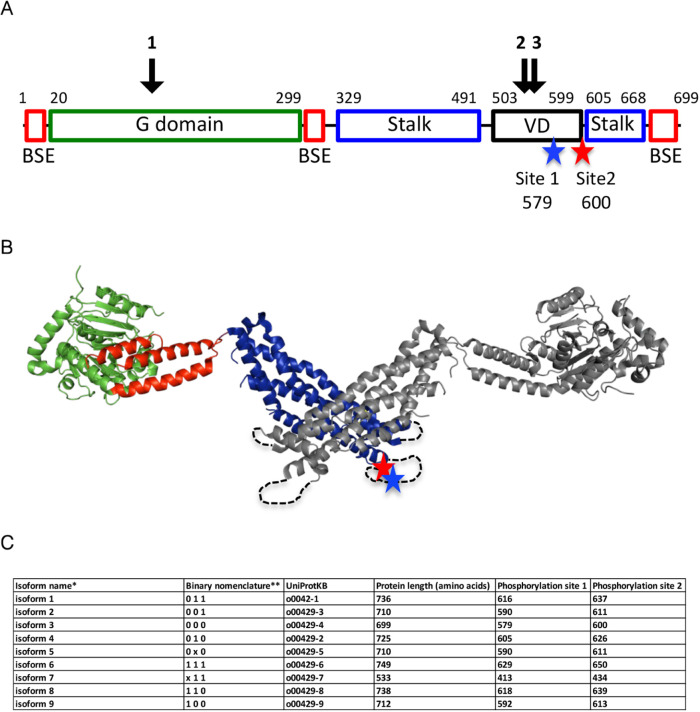
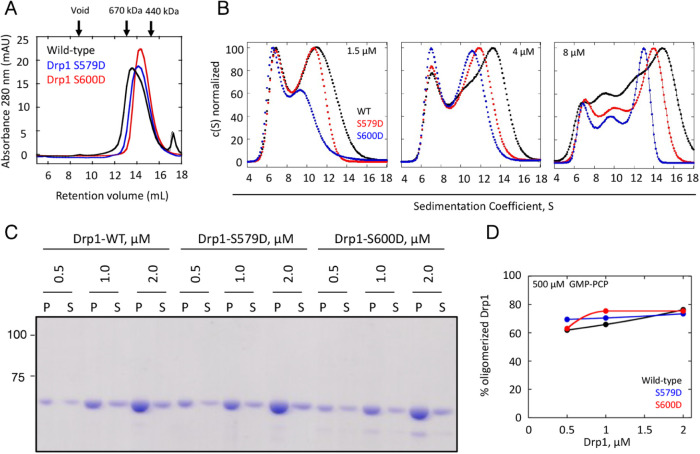
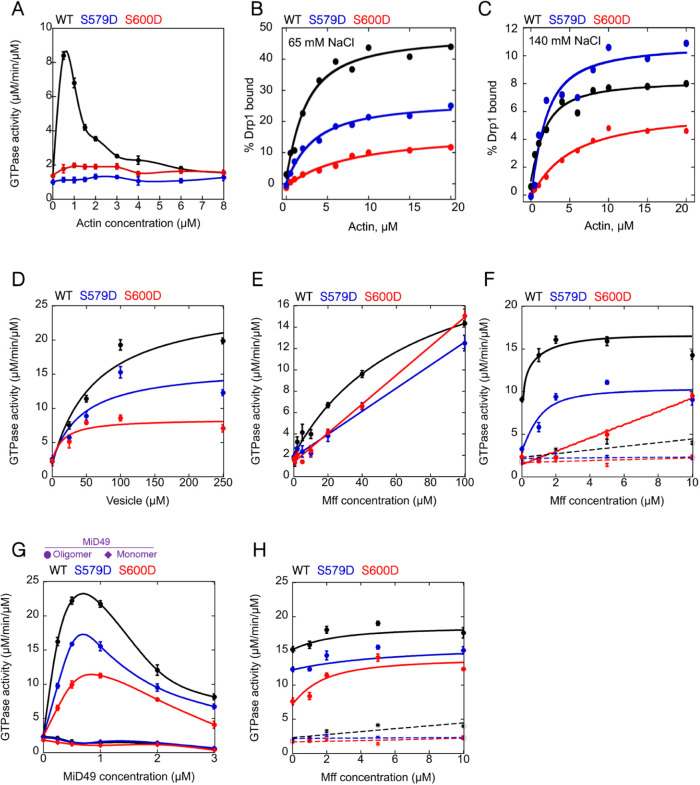
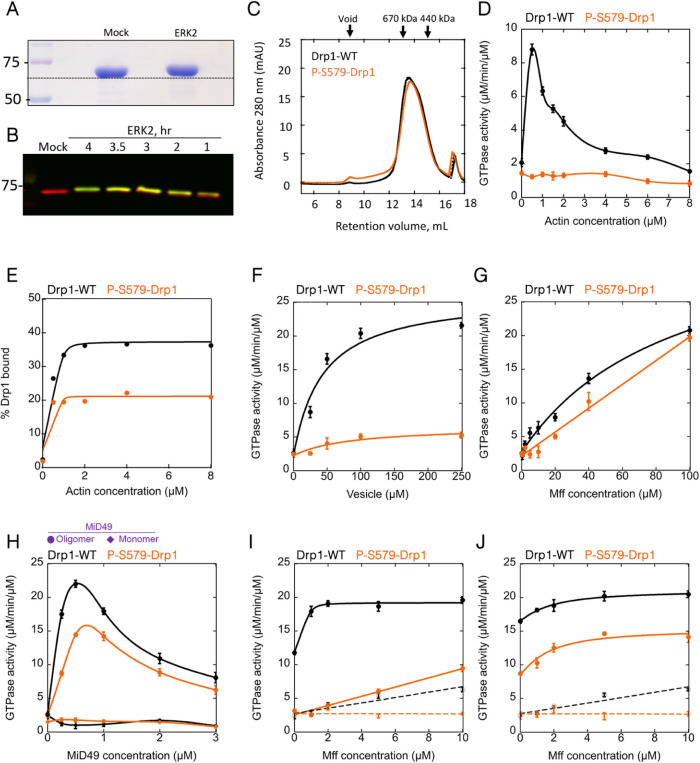
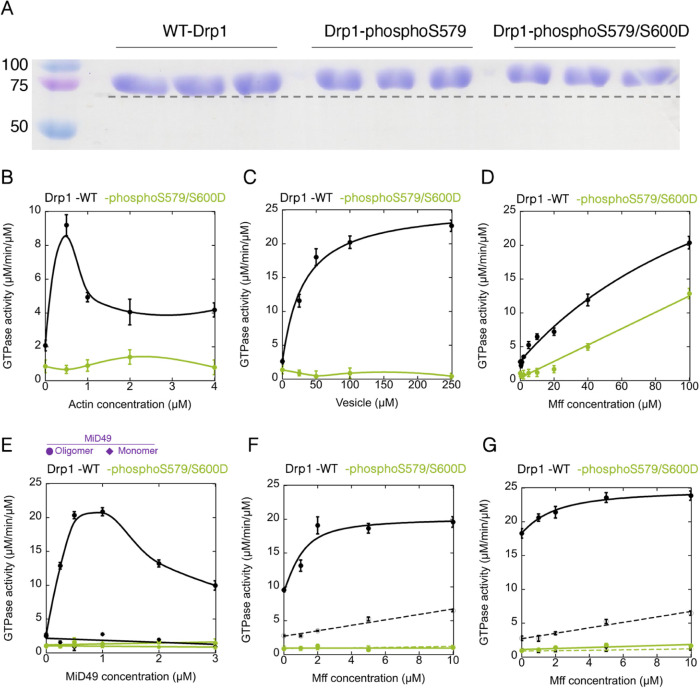
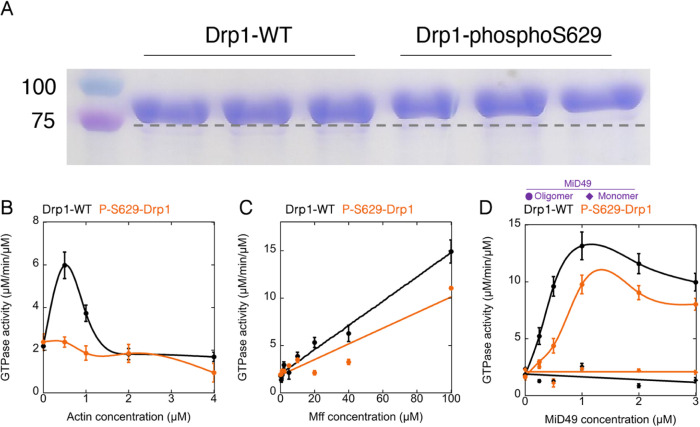
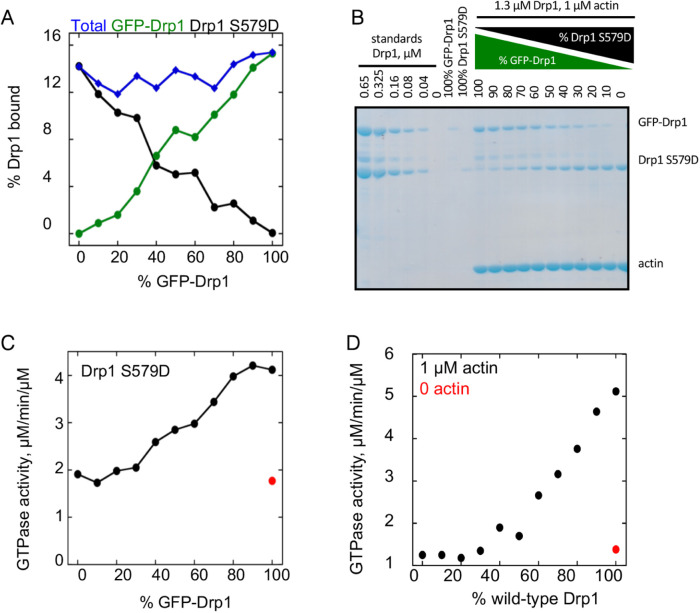
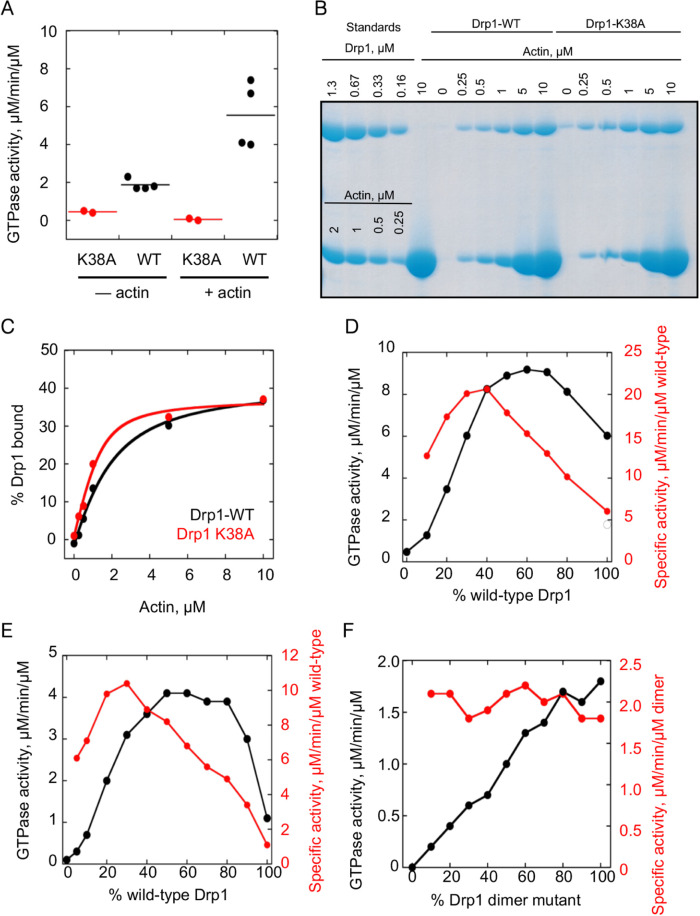
Drp1 is a dynamin family GTPase required for mitochondrial and peroxisomal division. Oligomerization increases Drp1 GTPase activity through interactions between neighboring GTPase domains. In cells, Drp1 is regulated by several factors including Drp1 receptors, actin filaments, cardiolipin, and phosphorylation at two sites: S579 and S600. Commonly, phosphorylation of S579 is considered activating, while S600 phosphorylation is considered inhibiting. However, direct effects of phosphorylation on Drp1 GTPase activity have not been investigated in detail. Here, we compare effects of S579 and S600 phosphorylation on purified Drp1, using phosphomimetic mutants and in vitro phosphorylation. Both phosphomimetic mutants are shifted toward smaller oligomers. Both phosphomimetic mutations maintain basal GTPase activity, but eliminate GTPase stimulation by actin and decrease GTPase stimulation by cardiolipin, Mff, and MiD49. Phosphorylation of S579 by Erk2 produces similar effects. When mixed with wildtype Drp1, both S579D and S600D phosphomimetic mutants reduce the actin-stimulated GTPase activity of Drp1-WT. Conversely, a Drp1 mutant (K38A) lacking GTPase activity stimulates Drp1-WT GTPase activity under both basal and actin-stimulated conditions. These results suggest that the effect of S579 phosphorylation is not to activate Drp1 directly. In addition, our results suggest that nearest neighbor interactions within the Drp1 oligomer affect catalytic activity.


Figures

FIGURE 1:
FIGURE 1:
Drp1 phosphorylation sites. (A) Domain organization of Drp1 isoform 3 (also called Drp1-000): GTPase domain (green), Bundle Signaling Element (BSE, red), stalk (blue), VD, black, also called the B-insert in some publications. Blue and red stars indicate phosphorylation sites S579 (site 1) and S600 (site 2), respectively. Black arrows indicate locations of the three alternatively spliced inserts. (B) Structural model of Drp1 dimer (PDB 4BEJ) showing positions of phosphorylation sites S579 (blue star) and S600 (red star) on one subunit (color coded similar to panel A). Dashed loops for VD denote that this was not resolved in PDB 4BEJ. (C) Table listing positions of the phosphorylation sites corresponding to S579 (Site 1) and S600 (Site 2) in this paper for the nine human Drp1 isoforms listed in UniProt, following: *isoform designation given by (Rosdah et al., 2020) and, ** binary nomenclature used by (Strack et al., 2013). Binary nomenclature based on presence (1) or absence (0) of the three alternatively spliced inserts, with “x” denoting a variation of the indicated site (described in [Rosdah et al., 2020]). Of note, additional splice variants have been identified in murine Drp1 (Itoh et al., 2018).
FIGURE 2:
FIGURE 2:
Oligomeric properties of Drp1 phosphomimetic mutants. (A) Superose 6 gel filtration profiles of 30 µM of Drp1-WT, Drp1-S579D, and Drp1-S600D. At top are peak elution positions for two standards (thyroglobulin [670 kDa] and ferritin [440 kDa]) as well as the void volume position. (B) vAUC of Drp1-WT, Drp1-S579D, and Drp1-S600D (black, red, and blue, respectively) at three concentrations: 8, 4, and 1.5 µM. (C) Coomassie-stained gel showing sedimentation assays graphed in panel C. Mass markers (in kDa) shown at left. P = pellet, S = supernatant. (D) Quantification of percent oligomerized Drp1 from sedimentation assays of Drp1-WT, Drp1-S579D, and Drp1-S600D in the presence of the nonhydrolysable GTP analogue GMP-PCP (500 µM) at 0.5, 1.0, and 2.0 µM Drp1.
FIGURE 3:
FIGURE 3:
Effects of Drp1 phosphomimetic mutants on actin binding and GTPase stimulation by actin, Mff, and MiD49. Wild-type, Drp1 S579D, Drp1 S600D shown in black, blue, and red, respectively, for all panels. All GTPase assays contain 0.75 µM Drp1. (A) GTPase assays containing 0.75 µM Drp1 that was preincubated with the indicated concentration of actin filaments for 5 min before GTP addition. Activity expressed as µM phosphate released per minute per µM Drp1. (B) and (C) Graphs of percent Drp1 bound versus actin concentration, from cosedimentation assays at 65 mM (B) and 140 mM NaCl (C), respectively (1.3 µM Drp1 in all cases). Raw data in Supplemental Figure S1. (D) GTPase assays containing Drp1 that was preincubated with the indicated concentration of CL-containing vesicles (40% DOPC, 35% DOPE, 25% CL) for 5 min before GTP addition. (E) Comparison of Drp1-WT with Drp1-S579D and Drp1-S600D GTPase activities in the presence of the indicated concentration of Mff for 5 min before GTP addition. (F) Comparison of Drp1-WT with Drp1-S579D and Drp1-S600D GTPase activities in the presence of 0.5 µM actin filaments and the indicated concentration of Mff for 5 min before GTP addition. Values for Mff alone are indicated by open circles and dashed lines, while values for Mff/actin are indicated by closed circles and solid lines. (G) Comparison of Drp1-WT with Drp1-S579D and Drp1-S600D GTPase activities in the presence of the indicated concentration of MiD49 monomer (diamonds) or MiD49 oligomer (circles) for 5 min before GTP addition. (H) Comparison of Drp1-WT with Drp1-S579D and Drp1-S600D GTPase activities in the presence of 0.25 µM MiD49 oligomer and the indicated concentration of Mff for 5 min before GTP addition. Values for Mff alone are indicated by open circles and dashed lines, while values for Mff/MiD49 are indicated by closed circles and solid lines. Error bars represent mean ± S.D. (n = 3).
FIGURE 4:
FIGURE 4:
Effects of Phospho-S579-Drp1 on actin binding and GTPase stimulation by actin, Mff, and MiD49. In all graphs, Drp1-WT and P-S579-Drp1 in black and orange, respectively. All GTPase assays contain 0.75 µM Drp1. (A) Coomassie-stained SDS–PAGE of Drp1 from either mock phosphorylation or ERK2 phosphorylation reactions (4 h). 2 µg Drp1 on gel. Positions of size standards (in kDa) on left. (B) Western blot showing anti-Drp1 (red) and anti-phospho-S579-Drp1 (green) at varying times after ERK2 treatment. (C) Superose 6 gel filtration profiles of WT and P-S579-Drp1. At top are peak elution positions for two standards (thyroglobulin [670 kDa] and ferritin [440 kDa]) as well as the void volume position. (D) GTPase assays containing Drp1 that was preincubated with the indicated concentration of actin filaments for 5 min before GTP addition. Activity expressed as µM phosphate released per min per µM Drp1. (E) Graph of % Drp1 bound versus actin concentration, from cosedimentation assays at 65 mM NaCl. Raw data in Supplemental Figure S2. (F) GTPase assays containing Drp1 that was preincubated with the indicated concentration of CL-containing vesicles (μM total lipid, vesicles contain 40% DOPC, 35% DOPE, and 25% CL) for 5 min before GTP addition. (G) Comparison of WT and P-S579-Drp1 GTPase activities in the presence of the indicated concentration of Mff for 5 min before GTP addition. (H) Comparison of WT and P-S579-Drp1 GTPase activities in the presence of the indicated concentration of MiD49 monomer (diamond) or MiD49 oligomer (circle) for 5 min before GTP addition. (I) Comparison of WT and P-S579-Drp1 GTPase activities in the presence of 0.5-µm actin filaments and the indicated concentration of Mff for 5 min before GTP addition. Values for Mff alone are indicated by open circles and dashed lines, while values for Mff/actin are indicated by closed circles and solid lines. (J) Comparison of WT and P-S579-Drp1 GTPase activities in the presence of 0.25 µM MiD49 oligomer and the indicated concentration of Mff for 5 min before GTP addition. Values for Mff alone are indicated by open circles and dashed lines, while values for Mff/MiD49 are indicated by closed circles and solid lines. Error bars represent mean ± S.D. (n = 3).
FIGURE 5:
FIGURE 5:
Effects of Drp1-phosphoS579/S600D on GTPase stimulation. In all graphs, Drp1-WT and Drp1-phosphoS579/S600D in black and green, respectively. All GTPase assays contain 0.75 µM Drp1. (A) Coomassie-stained SDS–PAGE of Drp1 from either Drp1- mock phosphorylation, Drp1- ERK2 phosphorylation, or Drp1-S600D- ERK2 phosphorylation reactions (4 h). 2 µg Drp1 on gel. Positions of size standards (in kDa) on left. (B) GTPase assays containing Drp1 that was preincubated with the indicated concentration of actin filaments for 5 min before GTP addition. Activity expressed as µM phosphate released per minute per µM Drp1. (C) GTPase assays containing Drp1 that was preincubated with the indicated concentration of CL-containing vesicles (40% DOPC, 35% DOPE, and 25% CL) for 5 min before GTP addition. (D) Comparison of Drp1-WT and Drp1-phosphoS579/S600D GTPase activities in the presence of the indicated concentration of Mff for 5 min before GTP addition. (E) Comparison of Drp1-WT and Drp1-phosphoS579/S600D activities in the presence of the indicated concentration of MiD49 monomer (diamond) or MiD49 oligomer (circle) for 5 min before GTP addition. (F) Comparison of Drp1-WT and Drp1-phosphoS579/S600D GTPase activities in the presence of 0.5 µm actin filaments and the indicated concentration of Mff for 5 min before GTP addition. Values for Mff alone are indicated by open circles and dashed lines, while values for Mff/actin are indicated by closed circles and solid lines. (G) Comparison of Drp1-WT and Drp1-phosphoS579/S600D activities in the presence of 0.25 µM MiD49 oligomer and the indicated concentration of Mff for 5 min before GTP addition. Values for Mff alone are indicated by open circles and dashed lines, while values for Mff/MiD49 are indicated by closed circles and solid lines. Error bars represent mean ± S.D. (n = 3).
FIGURE 6:
FIGURE 6:
Effects of Erk2 phosphorylation on GTPase activity of Drp1 isoform 6. In all graphs, Drp1-WT and Drp1-phosphoS629 in black and orange, respectively. All GTPase assays contain 0.75 µM Drp1. (A) Coomassie-stained SDS–PAGE of Drp1 isoform 6 from either Drp1- mock phosphorylation or Drp1- ERK2 phosphorylation (4 h). 2 µg Drp1 on gel. Positions of size standards (in kDa) on left. (B) GTPase assays containing Drp1 that was preincubated with the indicated concentration of actin filaments for 5 min before GTP addition. Activity expressed as µM phosphate released per minute per µM Drp1. (C) Comparison of Drp1-WT and P-S629-Drp1 GTPase activities in the presence of the indicated concentration of Mff for 5 min before GTP addition. (E) Comparison of Drp1-WT and P-S629-Drp1 activities in the presence of the indicated concentration of MiD49 monomer (diamonds) or MiD49 oligomer (circles) for 5 min before GTP addition. Error bars represent mean ± S.D. (n = 3).
FIGURE 7:
FIGURE 7:
Drp1 phosphomimetic mutants reduce the ability of actin filaments to activate wild-type Drp1. In all panels, the actin filament concentration is constant at 1 µM, and the total Drp1 concentration (combination of GFP-Drp1 and phosphomimetic mutant Drp1 without GFP) is constant at 1.3 µM. (A) Graph of Drp1 binding to actin filaments with varying ratios of GFP-Drp1-WT:Drp1-S579D. (B) Corresponding Coomassie gels for binding assays quantified in panel A. (C) GTPase activity of Drp1 at varying ratios of GFP-Drp1-WT:Drp1-S579D in the presence of actin filaments. Red point represents GTPase activity of GFP-Drp1-WT in the absence of actin filaments. (D) GTPase activity of Drp1 (without the GFP tag) at varying ratios of Drp1-WT:Drp1-S579D in the presence of actin filaments. Red point represents GTPase activity of Drp1-WT in the absence of actin filaments.
FIGURE 8:
FIGURE 8:
Drp1-K38A mutant stimulates the GTPase activity of Drp1-WT. (A) GTPase activity of Drp1-WT or Drp1-K38A (1.3 µM) in the presence or absence of actin filaments (1 µM). (B) Coomassie-stained SDS–PAGE of Drp1/actin cosedimentation at 65 mM NaCl, with 1.3 µM Drp1-WT or Drp1-K38A and varying actin. Standards of known µM amounts of Drp1-WT and actin on left, pellets from sedimentation assays on right. (C) Graph of percent Drp1 in the pellet for Drp1-WT and Drp1-K38A as a function of actin concentration. (D) GTPase activity of Drp1 at varying ratios of Drp1-WT:Drp1-K38A (1.3 µM total Drp1) in the presence of actin filaments (1 µM). Black line denotes total Drp1 specific activity (factoring both WT and K38A mutant) while red line denotes specific activity of Drp1-WT. (E) GTPase activity of Drp1 at varying ratios of Drp1-WT:Drp1-K38A (1.3 µM total Drp1) in the absence of actin filaments. Black line and red lines as described in panel D. (F) GTPase activity of Drp1 at varying ratios of Drp1-DM:Drp1-K38A (1.3 µM total Drp1) in the presence of actin filaments (1 µM). Black line denotes total Drp1 specific activity (factoring both Drp1-DM and K38A mutant) while red line denotes specific activity of Drp1-DM. DM, dimer mutant.

Update of

Similar articles

Cited by

References

    1. Abe Y, Wanders RJA, Waterham HR, Mandel H, Falik-Zaccai TC, Ishihara N, Fujiki Y (2023). Genetic defects in peroxisome morphogenesis (Pex11β, dynamin-like protein 1, and nucleoside diphosphate kinase 3) affect docosahexaenoic acid-phospholipid metabolism. J Inherit Metab Dis 46, 273–285. - PubMed
    1. Adachi Y, Itoh K, Yamada T, Cerveny KL, Suzuki TL, Macdonald P, Frohman MA, Ramachandran R, Iijima M, Sesaki H (2016). Coincident Phosphatidic Acid Interaction Restrains Drp1 in Mitochondrial Division. Mol Cell 63, 1034–1043. - PMC - PubMed
    1. Boissan M, Montagnac G, Shen Q, Griparic L, Guitton J, Romao M, Sauvonnet N, Lagache T, Lascu I, Raposo G, et al. (2014). Nucleoside diphosphate kinases fuel dynamin superfamily proteins with GTP for membrane remodeling. Science 344, 1510–1515. - PMC - PubMed
    1. Brand CS, Tan VP, Brown JH, Miyamoto S (2018). RhoA regulates Drp1 mediated mitochondrial fission through ROCK to protect cardiomyocytes. Cell Signal 50, 48–57. - PMC - PubMed
    1. Bui HT, Shaw JM (2013). Dynamin assembly strategies and adaptor proteins in mitochondrial fission. Curr Biol 23, 891–899. - PMC - PubMed

LinkOut - more resources