Review
. 2023 Nov 28;22(1):189.
doi: 10.1186/s12943-023-01873-0.

Exploring the promising potential of induced pluripotent stem cells in cancer research and therapy

Affiliations
Review

Exploring the promising potential of induced pluripotent stem cells in cancer research and therapy

Matin Chehelgerdi et al. Mol Cancer. .

Abstract

The advent of iPSCs has brought about a significant transformation in stem cell research, opening up promising avenues for advancing cancer treatment. The formation of cancer is a multifaceted process influenced by genetic, epigenetic, and environmental factors. iPSCs offer a distinctive platform for investigating the origin of cancer, paving the way for novel approaches to cancer treatment, drug testing, and tailored medical interventions. This review article will provide an overview of the science behind iPSCs, the current limitations and challenges in iPSC-based cancer therapy, the ethical and social implications, and the comparative analysis with other stem cell types for cancer treatment. The article will also discuss the applications of iPSCs in tumorigenesis, the future of iPSCs in tumorigenesis research, and highlight successful case studies utilizing iPSCs in tumorigenesis research. The conclusion will summarize the advancements made in iPSC-based tumorigenesis research and the importance of continued investment in iPSC research to unlock the full potential of these cells.

Keywords: Immunotherapies; Induced pluripotent stem cells; Personalized medicine; Regenerative medicine; Therapy; Tumorigenesis.


Conflict of interest statement

The authors declare no competing interests.

Figures

Fig. 1
Fig. 1
1 The genetic diversity present in genomic research and stem cell repositories. a) Advances in human genomics and stem cell research in the past two decades have allowed for the exploration of how genetic variation influences diseases through scalable in vitro models. b) Most participants in genome-wide association studies have European ancestry. To address this limitation, initiatives such as the Trans-Omics for Precision Medicine (TOPMed) program and the All of Us Research program aim to include more diverse populations. Ancestry information or self-reported race/ethnicity data from each study is grouped into super populations. c) Various global efforts have been launched to prioritize the inclusion of underrepresented participants in human genomic research. d) The majority of pluripotent stem cell lines in large-scale collections come from donors of European ancestry. The number of cell lines in each collection is specified above each bar. The data is sourced from public repositories and peer-reviewed studies. e) Additional smaller-scale collections from different organizations and institutions are also included, such as the National Stem Cell Bank of Korea, RIKEN BRC, the CiRA Foundation, and REPROCELL. The number of cell lines from independent donors in each collection is indicated above each bar. Data from these collections is categorized into supergroups. f) The breakdown of cell lines with reported race or ethnicity data, represented as percentages within each super population, is shown using data obtained and processed with the support of the human pluripotent stem cell registry (www.hpscreg.eu). 2 Two aspects: the reporting of stem cell diversity and recommendations for expanding it. On the left side, the figure presents examples of how individuals of European and Asian ancestries are currently reported in various human pluripotent stem cell (hPSC) banks, including CIRM (USA), WiCell (USA), Coriell (USA), SKiP (Japan), and HipSci (UK). The colors blue and green represent individuals of European and Asian ancestries, respectively. On the right side, the figure shows examples of how individuals of European and Asian ancestries are reported in human genomic studies. Specifically mentioned studies are Bergstrom et al. 2020 (Human Genome Diversity Project), Karczewski et al. 2020 (gnomAD), and Smedley et al. 2021 (100,000 Genomes Pilot). In panel b, the figure provides key recommendations aimed at expanding hPSC diversity. Unfortunately, the details of these recommendations are not mentioned in the description. The map used in the figure is adapted from Templates by Yourfreetemplates.com. Reprinted from [17] with permission from the Springer Nature
Fig. 2
Fig. 2
The process of chemically induced reprogramming of human somatic cells into human chemically induced pluripotent stem cells (hCiPSC). The researchers, Guan et al., have developed a well-defined reprogramming protocol consisting of four stages (stage I to stage IV) that utilizes only small molecules. By disrupting the identity and modifying the epigenetics of the somatic cells, the cells are transformed into a flexible XEN-like state with unlocked potential. To facilitate this dedifferentiation and enhance cell plasticity, it was crucial to downregulate pro-inflammatory pathways, which was achieved with the c-Jun N-terminal kinase inhibitor (JNKIN8). The acquisition of cell plasticity in the XEN-like stage enables further reprogramming into stable hCiPSCs. These hCiPSCs have various applications in basic research, such as investigating reprogramming pathways or screening for druggable targets that determine cell fate, which could lead to new therapeutic options. Additionally, the reprogramming process is compliant with Good Manufacturing Practice (GMP) standards and cost-effective, which makes it more feasible to translate iPSCs into personalized autologous cell therapies. Reprinted from [21] with permission from the Springer Nature
Fig. 3
Fig. 3
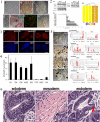
1 The process of generating piPSC colonies from PFF (pluripotent stem cells derived from preimplantation embryos). (A) The first image is a phase contrast image of PFF. (B) The second image shows granulated piPSC colonies similar to mouse and human iPSC that begin to appear approximately three weeks after viral infection. (C) The third image represents a representative piPSC colony after multiple passages, resembling hESC (human embryonic stem cells), shown at a lower magnification. (D) The fourth image is a higher magnification of the same piPSC colony shown in (C). (E) The piPSC colonies express alkaline phosphatase (AP), as depicted in the image. (F) The image shows nuclear localization of OCT4 (green) and surface SSEA1 (red) in the piPSC colonies. (G) Some piPSC colonies have a tendency to undergo spontaneous differentiation, as indicated by the area (arrow) on the right side of the colony. The differentiated cells exhibit cobblestone morphology with a relatively low nucleus to cytoplasm ratio. 2 The results of gene expression analysis conducted on piPSC (porcine-induced pluripotent stem cells) compared to PFF (porcine fetal fibroblast) and H9 hESC (human embryonic stem cells). The analysis involved different techniques, as described in the following paragraphs. In panel A, the researchers used RT-PCR (Reverse Transcription Polymerase Chain Reaction) to examine the expression of specific pluripotency genes in piPSC, PFF, and H9 hESC. The primers used were designed to target porcine genes rather than their human counterparts. However, it was observed that the primers for pc-MYC and pKLF4 also showed some level of cross-reactivity. Panel B displays the results of hierarchical clustering analysis performed on microarray data from three piPSC lines (IC1, ID4, and ID6) and two PFF cells (1 and 2). The clustering was based on Pearson-centered single-linkage rule, and it aimed to identify patterns of gene expression similarity or dissimilarity among the samples. The analysis included all genes (totaling 8,015) that exhibited a fold-change of at least 1.3 in their normalized expression between piPSC and PFF, with a significance level (P value) of 0.05 or lower. The values indicated next to the branches represent Pearson distances, which indicate the degree of dissimilarity between the gene expression profiles. In panel C, the fold differences (Log2) in gene expression between piPSC and PFF are presented. The black bars on the right-hand side of the axis represent genes that were up-regulated (showed increased expression) in piPSC compared to PFF, while the gray bars on the left side represent down-regulated (showed decreased expression) genes. The significance of the differences was assessed using P values, with '*' indicating a significance level of 0.05 or lower and '**' indicating a significance level of 0.01 or lower. 3 The results of immunofluorescence staining carried out on piPSC colonies cultured on MEF, focusing on pluripotent markers. The upper panels (A, B, and C) depict the immunofluorescence staining of OCT4, NANOG, and SOX2 respectively. The lower panels (A–C) confirm the specific localization of these markers to the nuclei, as indicated by the blue staining with DAPI. 4 The measurement of telomerase activity in different types of cells. The telomerase activities of several piPSC lines (IC1 passage 10, ID4 passage 10, ID6 passage 10, IIIB2 passage 3, and IB3 passage 8) are compared to their parental cells, including EGFP-PFF passage 10, MEF passage 4, and H9 hESC passage 41. The assay was conducted using triplicate samples, each containing 0.2 μg of total cell protein, and the TRAPESE-RT Telomerase Detection Kit (Chemicon) was utilized. The telomerase activity is represented by the value in amole, which indicates the number of extended primers containing telomeric repeats. 5 The process of differentiating piPSC (pluripotent induced pluripotent stem cells) into embryoid bodies (EB). In Part A, Day 0 shows piPSC cells plated on MEF (mouse embryonic fibroblasts). Day 1 shows an image of the resulting EB obtained on the next day, while Day 5 displays an image after 5 days of differentiation. Finally, Day 9 exhibits cells treated with 5% FBS (fetal bovine serum) for a duration of 9 days. Part B presents the results of real-time RT-PCR analysis, which measures the relative concentrations of transcript molecules of pluripotent and lineage-specific genes in various cell lines. These cell lines include piPSC lines (IC1, ID4, and ID6), PFF (pluripotent fetal fibroblasts), and piPSC that were differentiated into EB using BMP4, FBS, or retinoic acid (RA) as differentiation agents. The y-axis represents the fold change relative to the expression of GAPDH (glyceraldehyde 3-phosphate dehydrogenase), which is a reference gene commonly used in gene expression studies. 6 A microscopic image of a tumor taken from the peritoneum of a hairless mouse. The tumor, which was surgically removed, was formed by injecting cells from the piPSC line ID6 under the skin of the mouse. The tumor exhibited a high level of differentiation and consisted of various types of tissues. These tissues included neural epithelium (ectoderm) on the left side, striated muscle (mesoderm) in the middle, and epithelium with a brush border (endoderm) on the right side. The magnification used for all three tissues is the same. An inset on the right side provides a closer view of the brush border, indicated by a red arrow, and the scale bar in the image corresponds to 5 μm. Reprinted from [83] with permission from the PNAS
Fig. 4
Fig. 4
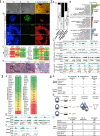
1 The characterization of neural stem/progenitor cells (NS/PCs) derived from human induced pluripotent stem cells (hiPSCs). In panel (a), the process of generating NS/PCs from feeder-free cultured hiPSCs is depicted, accompanied by representative images of cells at each stage of differentiation. The scale bar in the image is 200 μm. Panels (b) and (c) show representative immunocytochemical images (b) and quantification (c) of hiPSC-NS/PCs using specific antibodies against SOX1, SOX2, and NESTIN. The inset in panel (b) displays Hoechst nuclear staining of the same sample, and the scale bar is 50 μm. Panel (d) presents representative images of cell surface markers PSA-NCAM and CD133 on hiPSC-NS/PCs. The differentiation capacity of hiPSC-NS/PCs is demonstrated in panel (e) with representative images of neuronal differentiation for each cell line. Neuronal markers, including MAP2ab (green), NeuN (red), and βIII-tubulin (purple), are expressed after 14 days of differentiation. The scale bar in the image is 100 μm. Panel (f) shows histological evaluation of hiPSC-NS/PCs after transplantation into immunodeficient mice. Representative tissue sections of the striatum are displayed, and graft survival is assessed using the marker STEM121, which indicates human cytoplasm. The differentiation capacity of hiPSC-NS/PCs in the graft is evaluated using antibodies against Ki67, NESTIN, and human-specific GFAP (STEM123). Insets in the panel provide a closer look at the Ki67 signal in specific regions. The scale bars in the images are 500 μm. Panel (g) quantifies the number of Ki67 + cells among human-specific Lamin A + C + cells at the indicated time point. Panels (h) and (i) demonstrate neuronal differentiation of hiPSC-NS/PCs after transplantation, as indicated by the expression of the neuronal marker nELAVL in HNA + grafts. The insets in panel (h) show Hoechst nuclear staining of the same sample, and the scale bar is 20 μm. Quantification of neuronal differentiation is shown in panel (i). Statistical values are provided as means ± standard deviation, and asterisks indicate statistical significance (NS/PC-A, n = 3; NS/PC-B, n = 3; EB-NS/PC, n = 4, **p < 0.01). 2 The examination of the variability within hiPSC-NS/PCs (human induced pluripotent stem cell-derived neural stem/progenitor cells) using a single-cell-based method. a) The diagram illustrates the process of fluorescence-activated cell sorting (FACS) of NS/PC-B, followed by cell expansion for subsequent biological analyses. b) The figure displays a correlation analysis between gene expression profiles of single-cell-derived NS/PCs (scNS/PCs) obtained through microarray analysis and gene expression in NS/PCs, neural crest cells (NCCs), and MSCs from publicly available datasets. The clustering of these profiles is also presented, with the color indicating the significance of correlation (z-value). c) Principal component analysis of scNS/PCs is shown. NS/PC-like scNS/PCs are represented by red dots, NCC-like scNS/PCs by blue dots, and unclassified scNS/PCs (intermediate scNS/PCs) by light green dots. d) A comparison of gene expression related to neural (NES, SOX2, and ZBTB16) and mesodermal (SOX9 and PDGFR) lineages is demonstrated in NS/PC-like (blue), intermediate (light green), and NCC-like (red) scNS/PCs. e) The figure presents a gene ontology (GO) analysis of differentially expressed genes in NS/PC-like scNS/PCs compared to NCC-like scNS/PCs. 3 The presence of cells displaying mesodermal characteristics in grafts derived from human-induced pluripotent stem cell-derived neural stem/progenitor cells (hiPSC-NS/PCs). In panel (a), the grafts in the striatum were examined histologically using antibodies against SOX1 and SOX9, and the arrows highlight cells that are positive for SOX1 and SOX9 among the HNA-positive cells. The scale bar represents a length of 25 μm. Panel (b) provides a quantification of the SOX1-SOX9 positive cells in the grafts, with the mean values and standard deviations indicated [NS/PC-A (3M) n = 3; NS/PC-B (3M) n = 3; NS/PC-B (6M) n = 4, *p < 0.05]. In panel (c), representative images show the expression of AP2α in the NS/PC-derived grafts in the striatum, with the inset demonstrating Hoechst nuclear staining of the same field. Panel (d) quantifies the frequency of AP2α-positive cells in the grafts, with mean values and standard deviations provided [NS/PC-A (3M) n = 4; NS/PC-B (3M, 6M) n = 4, **p < 0.01]. Panel (e) displays representative images of Vimentin and SNAI1 expression in STEM121-positive grafts six months after transplantation into an injured spinal cord. The scale bar represents a length of 100 μm. Panel (f) presents a bone-like structure derived from the grafts in the injured spinal cord region. Immunohistochemical staining of Ki67 (upper panel) and H&E staining (lower panel) of serial sections corresponding to the area shown in (e) is shown. The inset provides a higher magnification of the boxed field. The scale bar represents a length of 100 μm. 4 The osteogenic differentiation capacity of neural stem/progenitor cells (NS/PCs) that have characteristics resembling neural crest cells (NCCs). Panel (a) provides detailed information about the cluster numbers within NS/PCs and NCC-like NS/PCs, with the selected cells for further analysis highlighted in red. Panel (b) shows a principal component analysis (PCA) plot of the transcriptome in the NS/PCs, with additional information about the selected NS/PCs highlighted in blue (NS/PC-like) and red (NCC-like). Panel (c) presents representative images of the selected NS/PCs, with a scale bar of 100 μm for size reference. Panel (d) displays the results of immunocytochemical analysis of the NS/PC-like and NCC-like NS/PCs using antibodies against SOX1 (green), SOX9 (red), and NESTIN (purple). The inset in this panel shows Hoechst nuclear staining of the same field, with a scale bar of 50 μm. Panel (e) provides quantification data based on the immunocytochemical analysis shown in panel (d). Finally, panel (f) shows the results of Alizarin red S staining after osteogenic differentiation of the NS/PC-like and NCC-like NS/PCs. The scale bar in this panel is 100 μm. 5 The process of identifying specific cell surface markers to determine populations that possess the ability to generate bone tissue. In part (a), a screening was conducted on a subset of hiPSC-NS/PCs (human-induced pluripotent stem cell-derived neural stem/progenitor cells) using the BD Lyoplate screening panel. The results from flow cytometry categorized the antibodies into three groups. Part (b) shows the flow cytometric analysis of cell surface markers for pluripotent stem cells (PSCs), NS/PCs, and MSCs on NS/PC-B cells. Part (c) validates the cell surface marker screening using NS/PC-like and NCC-like scNS/PCs (single-cell-derived NS/PCs and neural crest cell-like NS/PCs). Flow cytometric analysis displays the frequencies of cells expressing the antigens. Part (d) provides a representative image of coexpression analysis between NS/PC markers and NCC markers on NS/PC-like and NCC-like scNS/PCs. In part (e), the expression of NCC markers on various types of iPSC-NS/PCs is evaluated, along with representative images of Alizarin red S staining after inducing osteogenic differentiation. Part (f) involves sorting NS/PC-B cells based on CD15, CD73, and CD105 expression. The sorted cells are then subjected to further evaluation. Part (g) quantifies the sorted fractions based on SOX1 and SOX9 expression. Part (h) examines the sorted cells for their ability to differentiate into bone cells using Alizarin red S staining. Finally, part (i) presents a proposed model for the cellular heterogeneity of hiPSC-NS/PCs. 6 The transcriptome characteristics of iPSC-NS/PCs in comparison to authentic NCCs and MSCs. In panel (a), a heatmap demonstrates the expression levels of genes associated with NS/PCs (SOX1 and NES) and genes associated with NCCs (SOX9, SOX10, AP2α, and FOXD3) in parental NS/PCs, scNS/PCs, hiPSC-NCCs, and MSCs. Panel (b) displays a heatmap that shows the correlation in gene expression between parental NS/PCs and scNS/PCs with gene expression data from previously published datasets of PSA-NCAM + and PSA-NCAM- NS/PCs. The color scale represents the z-value, indicating the significance of the correlation. In panel (c), a principal component analysis is presented, comparing scNS/PCs with referenced cells such as hiPSC-NCCs, WBM, and MSCs. 7 The process of ensuring the quality of neural stem/progenitor cells (NS/PCs) through purification using CD15. In panel (a), a diagram shows the transplantation of NS/PCs derived from NS/PC-B, either sorted with an anti-CD15 antibody [sorting ( +)] or without it [sorting (-)], into the striatum of immunodeficient mice. After 10 weeks, immunohistochemical analysis was conducted to evaluate the differentiation capacity of the transplanted NS/PCs. Representative images (b) and corresponding quantification (c) demonstrate the expression of AP2α in HNA + grafts as an indicator of differentiation capacity. The insets in panel (b) display Hoechst nuclear staining of the same area. Quantitative data is presented in the right panel. The scale bar represents 50 μm. Mean values ± standard deviation (n = 3, *p < 0.05) are provided. Similarly, representative images (d) and quantification (e) show the expression of nELAVL in HNA + grafts to assess the differentiation capacity of the transplanted NS/PCs. The insets in panel (d) display Hoechst nuclear staining of the same area. Reprinted from [84] with permission from the Springer Nature
Fig. 5
Fig. 5
1 The process and characterization of CTFR-bESCs. In panel A, bright-field images and AP staining are shown, illustrating the typical colony morphologies of CTFR-bESCs. It is important to note that the feeder layer in the images is negative for AP staining. The passages shown are P3 (passage 3) and P24 (passage 24). The scale bars in the images represent a length of 50 μm. Panel B displays immunofluorescence (IF) staining for various markers, including SOX2, POU5F1, GATA6, and CDX2. The top row shows bovine blastocysts at a magnification of 20 × objective, while the middle and bottom rows show CTFR-bESCs. Panel C presents the results of expression analysis for markers specific to different lineages: ICM (inner cell mass), TE (trophectoderm), and PE (primitive endoderm). The analysis was performed using RNA-seq, and the samples include two independent CTFR-bESC lines (P10), two independent pools of whole blastocysts (10 each), and two lines of bovine fibroblasts. The color scale indicates expression levels, ranging from red (high expression) to green (low/no expression). In panel D, representative images exhibit H&E staining of histological sections obtained from teratomas generated by CTFR-bESCs. These teratomas contain tissues from all three germ lineages: ectoderm, endoderm, and mesoderm. The magnification used for these images is 10 × . 2 The pattern of histone methylation in CTFR-induced pluripotent stem cells (CTFR-bESCs). In part (A), the transcriptional status of genes containing H3K4me3, H3K27me3, or bivalent domains is depicted. Genes with an RPKM (Reads Per Kilobase Million) value of 0.4 or higher are considered expressed, while genes with an RPKM value below 0.4 are considered nonexpressed. The bar plot inside the figure shows the average RPKM values ± SEM (Standard Error of the Mean) for expressed genes, while the x-axis displays the average RPKM values ± SEM for all genes (both expressed and nonexpressed). In part (B), the functional characteristics of genes containing H3K4me3, H3K27me3, or bivalent domains are presented. The figure displays the top 10 Gene Ontology (GO) terms associated with these genes. The bar plot represents the negative logarithm (base 10) of the P-value for selected GO terms related to biological processes, as determined by DAVID (Database for Annotation, Visualization, and Integrated Discovery). In part (C), a snapshot of the genome browser is provided, showing specific genes associated with H3K4me3, H3K27me3, or bivalent domains. The genes are listed for each category, such as TGFBR1, FGF8, SALL4, TRIM8, SBDS, and TAF8 for H3K4me3; OOEP, REC8, SLITRK4, LRRC4B, ARRX, and CSNB1 for H3K27me3; and WNT2, WNT7A, MATN2, CHL1, MSX2, and ETV4 for bivalent domains. These genes are associated with three distinct GO terms. The start of each gene is indicated by a black arrow in the genome browser snapshot. 3 The molecular characteristics of CTFR-bESCs, indicating their state of primed pluripotency. In panel A, the expression levels of specific markers for naive and primed pluripotency were analyzed using RNA-seq, and the results are represented using red (expressed genes with RPKM ≥ 0.4) and green (nonexpressed genes with RPKM < 0.4) color-coding. The data shown are the means of two independent biological replicates. Panel B provides snapshots from a genome browser displaying the histone methylation profiles of markers associated with primed and naive pluripotency in CTFR-bESCs. Panel C displays genome browser snapshots of H3K4me3 and H3K27me3 marks on key pluripotency genes (POU5F1, SOX2, NANOG, SALL4) in CTFR-bESCs. 4 The potential applications of CTFR-bESCs (Chimeric Trained Functional RNA-blastocyst-derived Embryonic Stem Cells) in genomic selection. In part A, the efficiency of deriving CTFR-bESCs is evaluated using different plating methods (whole blastocyst, mechanical isolation of inner cell mass [ICM], and immunosurgery-derived ICM) and various embryo sources (in vitro maturation [IVM]-in vitro fertilization [IVF], ovum pick-up [OPU]-IVF, somatic cell nuclear transfer [SCNT], and Holstein and Jersey breeds). The derivation efficiency is measured by calculating the percentage of blastocysts that successfully produce a stable CTFR-bESC line at the third passage (P3) in relation to the total number of embryos seeded using each method. Part B presents a schematic diagram illustrating the strategy of utilizing CTFR-bESCs for genomic selection. This approach aims to produce animals with superior genetic value through a highly efficient process involving CTFR-bESC derivation and somatic cell nuclear transfer (NT). The diagram demonstrates the potential of using CTFR-bESCs to select desirable genetic traits and generate animals with enhanced genetic characteristics. Part C highlights that CTFR-bESCs generated from different sources can serve as nuclear donors for cloning. This suggests that CTFR-bESCs derived from various embryo sources can be utilized in the cloning process to produce genetically identical copies of an organism. Reprinted from with [87] permission from the PNAS
Fig. 6
Fig. 6
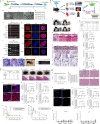
1 The process of generating cardiomyocytes from iPSCs lacking the dystrophin gene. The figure consists of two parts. In Part A, a diagram depicts the dystrophin gene and the specific mutations found in the cell lines. The UC1015.6 line has a CRISPR-induced mutation that leads to the production of a truncated dystrophin protein without the N terminus. The DMD19 and DMD16 lines are derived from patients and possess nonsense mutations. In Part B, immunostaining is performed on day 30 iPSC-derived cardiomyocytes (iPSC-CMs) to visualize the presence of cTnT (cardiac troponin T) and dystrophin. The UC lines are stained using the MANEX1A antibody, which detects the N terminus of dystrophin. On the other hand, the DMD19 and DMD16 lines are stained using the ab15277 antibody, which recognizes the C terminus of dystrophin. Nuclei are marked in blue using DAPI. The scale bar represents a length of 100 µm. 2 The observed deficiencies in cell size, nuclear size, and sarcomere density of DMD iPSC-CMs (induced pluripotent stem cell-derived cardiomyocytes) on the 30th day of the differentiation process. The figure includes images of immunostaining for cTnT (cardiac troponin T) and DAPI (4',6-diamidino-2-phenylindole) staining for nuclei, comparing UC3.4 and UC1015.6 iPSC-CMs (A), DMD19 iso and DMD19 iPSC-CMs (B), and DMD16 iso and DMD16 iPSC-CMs (C). The scale bar in the images represents a length of 50 µm. Additionally, the figure presents the cell area measurements for UC3.4 and UC1015.6 iPSC-CMs (Figure D), DMD19 iso and DMD19 iPSC-CMs (Figure E), and DMD16 iso and DMD16 iPSC-CMs (F). The nuclear size measurements are provided for UC3.4 and UC1015.6 iPSC-CMs (Figure G), DMD19 iso and DMD19 iPSC-CMs (Figure H), and DMD16 iso and DMD16 iPSC-CMs (I). Furthermore, the figure displays the sarcomere density, quantified by the cTnT signal relative to the cell area, for UC3.4 and UC1015.6 iPSC-CMs (J), DMD19 iso and DMD19 iPSC-CMs (K), and DMD16 iso and DMD16 iPSC-CMs (L). The data were collected from three differentiation experiments, involving a total of 97 to 205 cells. 3 The effect of TRF2 overexpression on rescuing telomere attrition. The shelterin complex, consisting of six subunits, includes TRF1 and TRF2, which directly bind to telomere sequences. To investigate the impact of TRF2, cardiomyocytes were differentiated from iPSCs and transduced with either an empty retroviral vector without an open reading frame (ev) or TRF2 on day 10. Assays were conducted on day 30 of differentiation. Southern blot analysis was performed on telomere restriction fragments of iPSC-derived cardiomyocytes from UC, DMD19, and DMD16. The signal distribution of telomere lengths from the Southern blots is represented in arbitrary units (AU) for UC iPSC-CMs, DMD19 iPSC-CMs, and DMD16 iPSC-CMs. 4 The impact of TRF2 on the DNA damage response and cell survival. The experiment involved transducing cells with either ev (control) or TRF2 on day 10 and assessing them on day 30. The figure presents several Western blot analyses and survival percentages for different cell types. (A) TRF2 levels were analyzed using Western blot, with glyceraldehyde-3-phosphate dehydrogenase (GAPDH) as a loading control. TRF2 signal was normalized to the GAPDH signal and measured in arbitrary units (AU). The expected sizes for TRF2 and GAPDH are 65 kDa and 35 kDa, respectively. (B) Western blot analysis of P53 levels normalized to the GAPDH signal in AU. The expected size for P53 is 50 kDa. (C) Western blot analysis of gH2AX levels normalized to the GAPDH signal in AU. The expected size for gH2AX is 17 kDa. (D) Western blot analysis of CHK2 phosphorylated at threonine 68 (phosphor-CHK2) and total CHK2. The signals were normalized to the GAPDH signal in AU. The expected size for phosphor-CHK2 is 62 kDa. (E), (F), and (G) show the percentage of cells that survived on day 40 compared to day 30 of differentiation for UC iPSC-CMs, DMD19 iPSC-CMs, and DMD16 iPSC-CMs, respectively. Survival percentages were determined based on three to five differentiation experiments, with cell numbers ranging from 375 to 12,036 on day 30. 5 The effects of TRF2 on various cellular characteristics, including cell size, nuclear size, and sarcomere density. The experiment involved transducing cells with either the control vector (ev) or TRF2 on day 10 and assessing them on day 30. The images (A), (B), and (C) show immunostaining for cTnT and DAPI staining for nuclei in UC iPSC-CMs, DMD19 iPSC-CMs, and DMD16 iPSC-CMs, respectively. The scale bar represents a length of 20 µm. The area of cells in (D), (E), and (F) represents UC iPSC-CMs, DMD19 iPSC-CMs, and DMD16 iPSC-CMs, respectively. The nuclear size in (G), (H), and (I) corresponds to UC iPSC-CMs, DMD19 iPSC-CMs, and DMD16 iPSC-CMs, respectively. The sarcomere density, indicated by the cTnT signal over the cell area, is depicted in (J), (K), and (L) for UC iPSC-CMs, DMD19 iPSC-CMs, and DMD16 iPSC-CMs, respectively. The cells were evaluated based on three differentiation experiments, with a total of 90 to 230 cells analyzed. Reprinted from [91] with permission from the PNAS
Fig. 7
Fig. 7
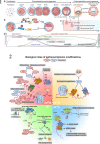
1 The progression of stem cell development, focusing on various aspects. In panel a, it depicts the morphological transformations that occur at different stages of stem cell development. Panel b highlights the molecular processes involved in the acquisition of cellular diversity. Panel c showcases the pluripotent nature of stem cells obtained at different developmental phases. Lastly, panel d provides an overview of the molecular characteristics observed throughout the course of stem cell development. 2 The control of different characteristics in pluripotent stem cells through epitranscriptomic modifications. The regulatory effects of m6A (indicated in red), m1A (in yellow), pseudouridine (in green), and m5C (in blue) modifications are linked to specific biological traits exhibited by pluripotent stem cells. Reprinted from [106] with permission from the Springer Nature
Fig. 8
Fig. 8
1 The impact of 2i culture on pluripotent cells in mice and humans. In panel A, mouse pluripotent colonies were subjected to alkaline phosphatase staining. The two plates on the left show that the addition of 2i to mEpiSC colonies leads to differentiation and a loss of alkaline phosphatase positive cells. However, the four plates on the right demonstrate that when mEpiSCs are grown in butyrate plus SAHA before introducing 2i, pluripotent colonies thrive. In panel B, human embryonic stem cells (H1) were either directed back to 2i culture through butyrate exposure or pushed forward towards differentiation without prior exposure to B/S. This indicates that 2i culture must follow B/S exposure to prevent differentiation. The scale bars in the figure represent a length of 100 μM. 2 The genomic analysis conducted on naïve human embryonic stem cells (hESCs). In panel (A), a heat map displays the RNA expression levels of target genes regulated by HIF2α (EPAS1) in H1-2iF cells compared to the parent H1 cells. The comparison was performed using quadruplicate samples and the cells were cultured in TeSR2. Panel (B) presents a principal component analysis (PCA) plot comparing mouse whole genome Agilent array data. The left side of the plot shows embryo data from Hunter et al. (8), while the right side shows mouse embryonic stem cell (mESC) equivalents, including R1p22 (mESC-2iL, naïve), mEpiSC7p24AF (mEpiSC-AF, primed), and mEpiSC7p55(AF7,B/S1)2iL20 (mEpiSC-2iL, toggled to naïve). The expression data of naïve (3iL, green squares) and primed (AF, blue squares) Elf1 cells are also compared with in vivo mouse embryo data in the plot on the left. In panel (C), a comparison is shown between in-house Elf1 expression array data and data generated by Hanna et al. (5). The comparison includes naïve and primed cell lines, represented by dark blue dots and orange dots, respectively. The lines tested on the left side of the graph are grouped identically on the Elf1 primed side. Panel (D) displays DNase I hypersensitivity analysis of the enhancer regions for the POU5F1 gene in Elf1 and H1 cells. The lower black line represents Elf1, and the blue line above represents H1. The first exon of POU5F1 is shown above the H1 data, along with a 2-kb size bar indicating the proximal enhancer (PE) and distal enhancer (DE). In panel (E), a comparison of ChIP-seq H3K27me3 data is presented. The orange line represents primed hESCs (data from Gafni et al., 6), while the blue line represents naïve Elf1-2iL cells. The comparison focuses on the subset of genes from panel (C) that are associated with Gene Ontology “developmental genes” (n = 648). 3 The analysis of different stages of pluripotency in human embryonic stem cells (hESCs). Panel (A) shows the results of microRNA analysis related to pluripotency. Panel (B) demonstrates the labeling of XIST (X-inactive specific transcript) using a technique called fluorescence in situ hybridization (FISH). In the left image, Elf1-3iLs cells do not show a cloud-like XIST signal, whereas Elf1s primed cells exhibit two XIST signals. Furthermore, cells differentiated for 10 days display a single XIST signal (represented by a red dot) within the nucleus. When the nucleus is highlighted using DAPI staining and the field is magnified, XIST remains undetectable in naïve Elf1 cells (lower left). However, upon differentiation, the XIST signal becomes detectable on one or both X chromosomes (red dots, white arrows, lower right). Panel (C) presents the results of bisulfite sequencing of the XIST promoter using different primer sets. The figure shows that XIST remains methylated throughout the naïve and primed stages. However, using specific primers, methylation appears to decrease in naïve cells compared to primed cells. This decrease is also observed in in vitro-differentiated cells and in a teratoma at day 98. The circles represent CpG sites, where open circles indicate unmethylated and filled circles indicate methylated CpGs. Panel (D) consists of graphs representing the cloning efficiency (percentage) and doubling times (hours) of Elf1 naive, Elf1 primed, H1 naive, and H1 primed cells. Panel (E) displays electron microscopy images of mitochondria. The left panels highlight the difference in mitochondrial shape between Elf1-3iL and Elf1-AF cells. This difference is quantified in the graph on the right, where an increased ratio indicates a rounder population of mitochondria. The error bars represent the standard error of the mean (SEM). 4 The developmental capacity of teratomas derived from different types of cells. Panel A displays sections of teratomas labeled with H&E staining. Specifically, it shows sections from Elf1p17-2iL10 teratoma (naïve; 42 days) and Elf1p15T8 teratoma (primed, 67 days). Panel B focuses on endoderm-specific labeling of the Elf1 teratomas shown in Panel A. The upper two panels of both tumors represent sequential sections. The upper panel highlights liver development using red (albumin), green (α-fetoprotein), and blue (E-cadherin) labeling. The second set of panels highlights pancreatic development using red (PDX1), green (SOX9), and blue (E-cadherin) labeling. The next three panels (descending) in both tumors are different sequential sections. The first set represents liver development, the second set represents pancreatic development, and the third set represents liver development using alternative markers (labeled as above and red, CYP3A and green, HNF4A). The lower panel of Elf1p17-2iL10 (naïve) is included to emphasize the level of organization of endodermal development within these tumors, labeled with red (FOXA2), green (SOX9), and blue (E-cadherin). The bottom right panel (Elf1p15T8) serves as a negative control. Panel C displays H&E sections of an H1 naïve teratoma (44 days). The graph below the H&E sections quantifies the areas stained for E-cadherin (epithelial cells) or PDX1 (pancreatic progenitors) in primed (H1p44-AF9), naïve [H1p49(B/S3)2iF10], and naïve reverted to primed [H1p49(B/S3, 2iF4)AF5] H1 generated teratomas. The graph indicates that both the overall epithelial developmental potential and the pancreatic subset are enhanced in the naïve state compared to the primed state. Panel D shows the top three panels with H&E sections of an mESC teratoma (naïve, 13 days). The lower panels display immunofluorescent labeling of sections from this mESC teratoma. The scale bars in panels A and D define the scale for all H&E-stained sections and are set at 100 μM. Reprinted from [477] with permission from the PNAS
Fig. 9
Fig. 9
1 The comparison between the growth of undifferentiated human pluripotent stem cells on chemically optimized substrates and feeder-containing substrates. The figure includes multiple panels showing different aspects of the experiment. Panel A depicts a schematic diagram of the UV treatment process, while panels B and C display XPS spectra indicating the surface chemical functionality of a polystyrene culture dish before and after UV treatment. Phase-contrast and fluorescence images of transgenic Oct4-GFP hESCs on these surfaces are shown, with bright green fluorescence indicating strong expression of the pluripotency marker Oct4. Panel D presents the relative number of hESC colonies on UVPS (UV-treated polystyrene) compared to conventional TCPS (standard tissue culture polystyrene) on the seventh day after cell seeding. Panel E demonstrates colony formation on virgin polystyrene treated with various UV doses, and the inset shows the prediction of colony numbers based on a PLS model. In panel F, the PLS model is used to identify surface ions that either support or inhibit hESC colony formation based on ToF–SIMS data. Panel G presents the number of adhered cells after 24 h of culture on UVPS coated with either human serum or recombinant human vitronectin, along with integrin-blocking antibodies. The results show that blocking αvβ5 integrin reduces adhesion, while blocking β1 integrin has minimal effect. Finally, panel H compares the number of undifferentiated Oct4-GFP-positive hESCs per well on UVPS and standard mouse embryonic feeder (mEF)-containing substrates after seven days of culture. UVPS coated with vitronectin is represented by the red bar, while the gray bar represents the mEF-containing substrates. The error bars in all panels indicate 95% confidence intervals, and the experiments were conducted with a sample size of three. 2 The optimization of polystyrene substrates through chemical and geometrical modifications. Panel A provides a schematic representation of the UV treatment process, which can be controlled spatially by inserting a photomask between the UV source and the dish. An overlay of phase-contrast and fluorescent images shows transgenic Oct4-GFP hESC cultures on a UV-patterned polystyrene substrate. The substrate, referred to as UV-Pattern, was coated with FBS (fetal bovine serum). Panel B presents a Time-of-Flight Secondary Ion Mass Spectrometry (ToF–SIMS) scan of the UVPS (UV-patterned polystyrene) surface after patterning with a photomask. The scan reveals the intensity of all positive ions, with different colors indicating varying intensities. The profile demonstrates a resolution of 30 μm between the points where the ion intensity changes from 20 to 80%. The abbreviation “Max.” stands for maximum. Panel C shows immunostaining of pluripotency markers in cells cultured on the UV-Pattern described in Panel A. Panel D demonstrates the possibility of patterning human embryonic stem cells (hESCs) or human-induced pluripotent stem cells (hiPSCs) using different geometries, suggesting versatility in the patterning process. Panel E presents the results of the experiment, showing the number of undifferentiated Oct4-GFP-positive cells in each well after 7 days of culture. The measurement was performed using flow cytometry on constant area patterns. Each well initially contained 15,000 cells, and the cumulative UV-treated area per well remained the same across all patterns. Error bars represent the 95% confidence intervals, and the surfaces were precoated with 20% bovine serum. The cells were seeded in the presence of a ROCK inhibitor for the first 8–12 h. 3 The results of simulating cell behavior on substrates patterned with UV light. In the first part (A), snapshots of human embryonic stem cells (hESCs) or hiPSCs are shown on spots with diameters of 300 and 1,400 μm. These snapshots were taken during the simulation and demonstrate that the majority of cells aggregate within 3 h, which is consistent with observations made during live imaging. The second part (B) presents the distribution of cells within each aggregate as predicted by the cell migration model. This prediction is shown for two different patterned spot diameters: 300 μm and 1,400 μm. It is important to note that no ROCK inhibitor was present in the media during these simulations. Lastly, part (C) provides information about the percentage of cells that exist as single cells, not paired or in colonies, as a function of cell density. When cells are seeded at a typical density used in routine cell culture (60,000 cells per well in a 6-well plate), the data indicates that less than 0.01% of cells remain as single cells. 4 The use of a UV-patterned substrate to facilitate long-term culture of cells. Panel A shows an overlay of phase-contrast and fluorescent images of transgenic Oct4-GFP BG01 hESC cultures on the UV-patterned substrate after 10 passages using collagenase dissociation. Panel B presents flow cytometry data of cells after two consecutive passages on the UV-patterned substrate, indicating the relative fluorescent units (RFU) and maximum (Max) values. The passage number (p) is also mentioned. Panel C displays immunostaining results for pluripotency markers in cells grown on the UV-patterned substrate. Panel D exhibits the formation of teratomas in immunodeficient mice by cells cultured on the UV-patterned substrate. Hematoxylin and eosin (H&E) staining of the teratoma reveals the presence of tissues representing all three germ layers. Panel E depicts the number of undifferentiated Oct4-GFP-positive hESCs over three passages using accutase on the UV-patterned substrate (red) compared to standard mouse embryonic feeder (mEF)-containing substrates (gray) when seeded with 24,000 cells per well of a six-well plate. The error bars indicate 95% confidence intervals, and the high R2 coefficient of determination suggests a good fit to the exponential growth model. Panel F shows flow cytometry data for pluripotency markers SSEA-4 and Tra-1–60 after more than 10 consecutive passages on the UV-patterned substrate for two different hiPSC lines, P237.1 and P237.5. Collagenase passaging (Col) is mentioned. In the case of transgenic Oct4-GFP BG01 hESCs passaged on MEFs, only GFP-positive cells were analyzed for Tra-1–60 and SSEA-4 expression, excluding MEFs from the analysis. 5 The utilization of UV-patterned substrates to facilitate the reprogramming and gene modification of human pluripotent stem cells. In panel A, phase-contrast images display BG01 human embryonic stem cells (hESCs) on UV-patterned substrates with specific dimensions. These cells were subjected to electroporation with CAAGS-GFP targeting and ZFN plasmids. Following electroporation, the cells were initially cultured in the presence of ROCK inhibitor. A successful targeted clone was then transferred to mouse embryonic fibroblasts (mEFs) and exhibited a high level of green fluorescent protein (GFP) expression after more than two months of culture. Panel B includes phase-contrast and immunostained images of “patient-237” fibroblasts on UV-patterned polystyrene. These fibroblasts were infected with a modified version of the pHAGE-STEMCCA vector, which contains loxP sites for Cre-mediated excision. The patterned surface was coated with human serum, enabling fibroblasts to adhere to the untreated areas of the dish. Over a period of four weeks, the fibroblasts underwent morphological changes and formed colonies of hiPSCs on the UV-patterned substrates. Panel C depicts the immunostaining of pluripotency markers in the patient-237 hiPSC line grown on the UV-patterned substrate. In panel D, Southern blot analysis of genomic DNA from various patient-237 hiPSC lines is shown, focusing on the Klf4 gene. The analysis reveals different bands representing the presence or absence of the reprogramming vector. The red-labeled cell lines indicate successful excision of the reprogramming vector upon Cre-recombinase expression. The loss of specific viral KLF4 bands indicates the isolation of vector-free hiPSCs through clonal selection. The accompanying bar graph illustrates the percentage of cells positive for pluripotency markers SSEA-4, TRA-1–60, and TRA-1–81, as determined by flow cytometry in a vector-free patient-237 hiPSC line after two passages on the UV-patterned substrate. Error bars represent the 95% confidence intervals based on three replicates. “Pos” denotes positive. Panel E showcases teratoma formation in immunodeficient mice resulting from the injection of vector-free hiPSCs that were reprogrammed and cultured on the UV-patterned substrate. Hematoxylin and eosin (H&E) staining of the teratoma reveals the presence of tissues representative of all three germ layers. 6 The use of a UV-patterned substrate to facilitate the transfer of individual human pluripotent stem cells. In panel A, images show BG01 human embryonic stem cells (hESCs) cultured on the “UV-Pattern” substrate after 7 and 27 passages using single-cell accutase dissociation. The image at passage 7 contains a fluorescent overlay indicating high expression of the Oct4-GFP marker. Panel B displays patient-237 hiPSCs at passage 27, with immunostaining indicating expression of the pluripotency marker Nanog (green) in all cell nuclei and high expression of SSEA-4 (red). The surfaces of the substrates were coated with 20% bovine serum, and cells were seeded in the presence of a ROCK inhibitor for the initial 8–12 h. Panel C presents flow cytometry results of BG01 hESCs with the Oct4-GFP reporter after three consecutive passages on the UV-Pattern substrate using accutase. Panel D shows flow cytometry results for pluripotency markers SSEA-4 and Tra-1–60 in cells from five different cell lines after more than 10 consecutive passages on the UV-Pattern substrate. The letter “A” denotes accutase-mediated passaging. In the case of transgenic Oct4-GFP BG01 cells passaged on mouse embryonic fibroblasts (mEFs), only GFP-positive cells were analyzed for Tra-1–60 and SSEA-4 expression, excluding mEFs from the analysis. Panel E demonstrates that patient-237 hiPSCs propagated on the UV-Pattern substrate for over 5 months (27 passages) maintained a normal 46XY karyotype. Lastly, panel F provides the design parameters used to develop the UV-treated culture system for human pluripotent stem cells. Reprinted from [527] with permission from the PNAS
Fig. 10
Fig. 10
1 The process of differentiating human iPSCs, nuclear transfer embryonic stem cells (nt-ESCs), and in vitro fertilization embryonic stem cells (IVF-ESCs) into cardiac cells. Panel (A) presents an overview of the experimental design used in the study. Panel (B) illustrates a monolayer cardiac differentiation protocol facilitated by small molecules. Panel (C) shows the sarcomere structures of pluripotent stem cell-derived cardiac cells (PSC-CMs) and rat adult cardiac cells, stained for cardiac troponin T (green), α-actinin (red), and the nuclei counterstained with DAPI (blue). The scale bars represent 25 μm, and the magnification is 600 × . Panel (D) quantifies the efficiency of cardiac differentiation by calculating the percentage of cells positive for TNNT2 (cardiac troponin T) using flow cytometry. Panel (E) compares the expression of TNNT2 in iPSC-derived cardiac cells (iPSC-CMs), nt-ESC-derived cardiac cells (nt-ESC-CMs), and IVF-ESC-derived cardiac cells (IVF-ESC-CMs). Panels (F–H) depict the heterogeneity of cardiac cells derived from different types of pluripotent stem cells using single-cell quantitative polymerase chain reaction (qPCR) analysis. Blue, red, and green colors represent iPSC-CMs, nt-ESC-CMs, and IVF-ESC-CMs, respectively. Heavy and light colors indicate two different cell lines within each category. Each row represents a single cell, while each column represents a single gene. The color key applies to panels F–H. Statistical analysis using one-way ANOVA was performed, and the error bars represent the standard error of the mean (SEM). 2 The generation of endothelial cells (ECs) from various types of pluripotent stem cells (PSCs) using different methods. In (A), a protocol involving small molecules is shown for inducing endothelial differentiation. The effectiveness of the differentiation process is evaluated in (B) by determining the percentage of CD31 + cells at day 12 of differentiation. Representative immunofluorescence staining of PSC-derived ECs using CD31 and CD144 antibodies is presented in (C), with the nuclei counterstained using DAPI. (D) compares the maintenance of endothelial characteristics among induced pluripotent stem cell-derived ECs (iPSC-ECs), nuclear transfer embryonic stem cell-derived ECs (nt-ESC–ECs), and in vitro fertilization-derived ECs (IVF-ESC-ECs) by measuring the percentage of CD144 + cells. No significant differences were observed among these cell types. The expression levels of EC-specific marker genes, PECAM1 (E), CDH5 (F), and NOS3 (G), were similar in iPSC-ECs, nt-ESC–ECs, and IVF-ESC-ECs. The production of nitric oxide by PSC-ECs and human umbilical vein endothelial cells (HUVECs) is shown in (H), while (I) presents the average number of branches in tubes formed by PSC-ECs. 3 The results obtained from analyzing the global gene-expression profiles of pluripotent stem cells (PSCs), PSC-derived cardiomyocytes (PSC-CMs), and PSC-derived endothelial cells (PSC-ECs) using RNA sequencing (RNA-seq). A) The differentially expressed genes (DEGs) between PSCs, PSC-CMs, and PSC-ECs were clustered using unsupervised hierarchical clustering (with a statistical significance threshold of q < 0.1). B) PSC-ECs were grouped together based on the specific reprogramming approaches used to generate the iPSCs (i12C, i12J), non-transgenic embryonic stem cells (nt-ESCs) (NT1, NT2), and in vitro fertilization-derived embryonic stem cells (IVF-ESCs) (ESO7, ESO8) (with a statistical significance threshold of q < 0.1). C) The number of DEGs identified in PSCs, PSC-CMs, and PSC-ECs due to the different reprogramming approaches is shown, with overlapping regions indicating the number of consistent DEGs shared among the different cell types. D) Gene ontology (GO) analysis was performed to identify enriched functional terms for the DEGs between iPSC-CMs, nt-ESC-CMs, and IVF-ESC-CMs (with a statistical significance threshold of P < 0.05). E) GO terms associated with the DEGs in ECs derived from iPSCs, nt-ESCs, and IVF-ESCs were identified using GO analysis (with a statistical significance threshold of P < 0.05). 4 The results obtained from analyzing the global DNA methylome of pluripotent stem cells (PSCs), PSC-derived cardiomyocytes (PSC-CMs), and PSC-derived endothelial cells (PSC-ECs) using a technique called RRBS-seq. A) This part shows the percentages of different types of methylated cytosines (mCG, mCHG, and mCHH) among all observed 5-methylcytosines in PSCs, PSC-CMs, and PSC-ECs.B) An unsupervised hierarchical clustering analysis is performed based on the global CpG methylation levels of PSCs, PSC-CMs, and PSC-ECs. The clustering groups include iPSCs, non-transgenic embryonic stem cells (nt-ESCs), in vitro fertilization-derived ESCs (IVF-ESCs), and their respective differentiated cells (CMs and ECs). The height of the cluster trees represents the similarity or dissimilarity between different objects and groups. C) The number of differentially methylated cytosines (DMCs) identified through pairwise comparisons is depicted in this section. The identified DMCs have a statistical significance (q < 0.01) and a methylation difference of at least 25%. D) Another unsupervised hierarchical clustering analysis is conducted, but this time for differentially methylated regions (DMRs) in CpG islands (CGIs) across the genome in PSCs, PSC-CMs, and PSC-ECs. The DMRs shown here have a statistical significance (q < 0.01) and amount to a total of 3,452. E) Lastly, an unsupervised hierarchical clustering analysis is presented for 2,324 DMRs located in CGI shores (regions adjacent to CGIs) in PSCs, PSC-CMs, and PSC-ECs. These DMRs also have a statistical significance (q < 0.01). 5 The identification of consistent differentially methylated regions (DMRs) in undifferentiated pluripotent stem cells (PSCs) and fully differentiated cells. In panel A, 42 consistent DMRs within CpG islands (CGIs) were found in both PSCs and differentiated cells. Panel B shows 40 consistent DMRs located in CGI shores, which were either hypermethylated or hypomethylated in in vitro fertilization (IVF) samples. Panel C provides the numbers of IVF-specific hypermethylated, IVF-specific hypomethylated, and inter-individual DMRs persistently present in PSCs, PSC-derived cardiomyocytes (PSC-CMs), and PSC-derived endothelial cells (PSC-ECs). The consistent DMRs specific to iPSCs were not found in CGI shores. Panels D and E represent IVF-specific consistent CGI-DMRs identified in undifferentiated PSCs and differentiated cells. Panels F and G demonstrate that the methylation levels of iPSC-specific consistent CGI-DMRs in iPSCs were higher compared to those in non-transgenic embryonic stem cells (nt-ESCs) and IVF-ESCs. Panel H shows the results of Spearman's correlation analysis, indicating a significant correlation between consistent promoter DMRs and the mRNA abundance of the associated genes (P < 2.2e − 16). 6 The results of a study examining the toxic effects of doxorubicin on cardiomyocytes (CMs) derived from iPSCs, non-transgenic embryonic stem cells (nt-ESCs), and in vitro fertilization-derived ESCs (IVF-ESCs). Panel (A) shows the dose-dependent impact of doxorubicin on the viability of PSC-CMs. The viability was measured using a Prestoblue cell viability assay, and the results indicate that as the dose of doxorubicin increases, the viability of PSC-CMs decreases. The values were normalized to the viability at 0 μM doxorubicin. Panel (B) displays the effect of doxorubicin treatment on the production of ATP in PSC-CMs. ATP production was measured using a CellTiter-Glo assay, and the data suggests that doxorubicin treatment negatively affects ATP production in PSC-CMs. Panel (C) demonstrates the assessment of cellular apoptosis in PSC-CMs after doxorubicin treatment. A luminescent Caspase 3/7 assay was used to measure apoptosis, and the results indicate that doxorubicin treatment leads to increased cellular apoptosis in PSC-CMs. Panel (D) reveals that the viability of PSC-CMs is not significantly affected after 24 h of doxorubicin treatment. Panel (E) presents the detection of whole-cell reactive oxygen species (ROS), specifically hydrogen peroxide (H2O2), in PSC-CMs after different doses of doxorubicin treatment for 24 h. The data suggests that doxorubicin administration leads to an increase in ROS levels in PSC-CMs. Panel (F) shows the acute influence of doxorubicin treatment on the mitochondrial glutathione (GSH) concentration in PSC-CMs. The GSH concentration was measured using a GSH-Glo Glutathione kit, and the results indicate that doxorubicin treatment has an impact on the mitochondrial GSH concentration in PSC-CMs. Reprinted from [547] with permission from the PNAS
Fig. 11
Fig. 11
1 The process of deriving iPSCs with characteristics similar to naïve mouse embryonic stem cells (mESCs). Panel A shows the overall strategy and representative images of C1 cultures and a subcloned cell line called C1.2 at various reprogramming stages. The passage number (p) is indicated. Additionally, images of NOD mESCs (mouse ESCs) and C1.2 hiPSCs (human iPSCs derived from C1) after withdrawal of doxycycline (DOX) are presented. Panel B demonstrates the maintenance of the C1 hiPSC line in a conventional growth condition for human embryonic stem cells (hESCs) supplemented with basic fibroblast growth factor (bFGF) and serum. The C1 line is transferred to a medium called N2B27 PD/CH/LIF + DOX, and emerging colonies are subcloned. A representative clone called C1.10 hiPSC is shown. Panel C explores the signaling dependence of pluripotent cell lines. Pluripotent cells are divided equally and plated on feeders in different growth media that are typically used for maintaining these cell lines. After 36 h, the wells are treated with specific inhibitors or growth factors. After 6 days, the wells are fixed and stained for a pluripotency marker called Nanog to determine the relative percentage of pluripotent colonies. Colony formation is normalized to an internal control growth medium without inhibitors. Panel D focuses on the reprogramming process of the C1.2 hiPSC line. The cells are electroporated with mammalian expression vectors expressing specific reprogramming factors and subjected to puromycin selection. The cells are then passaged in a medium called PD/CH/LIF without DOX. The values indicate the relative percentage of SSEA4 + colonies obtained compared to control cells that were transfected with a polycistronic construct encoding Oct4, Klf4, and Sox2. Panel E investigates the screening of factors that enable the propagation of transgene-independent C1 hiPSCs, meaning these cells no longer require DOX for stabilization. The effects of removing individual factors from a pool of 13 small molecules or cytokines are examined on the survival and pluripotency maintenance of C1 hiPSCs. C1 cells are plated on feeders in N2B27 media with the indicated factors. The P values obtained using Student’s t-test indicate significant changes compared to cells grown in DOX/PD/CH/LIF conditions, which are defined as the control with 100% survival. 2 The characteristics of naïve human embryonic stem cell (hESC) lines. In panel A, a diagram outlines the process of reverting hESCs to generate naïve hESCs. Representative images of WIBR3 hESCs at different stages of the reversion process in the presence of PD (small molecule), CH (chemical), LIF (leukemia inhibitory factor), and FK (forskolin) are shown. The passage number (p) and magnifications of the captured images are indicated. Panel B presents the single-cell cloning efficiency of various pluripotent stem cell lines. This efficiency is determined by counting the number of wells containing colonies positive for Nanog (a pluripotency marker) after 7 days. Panel C displays the estimated cell doubling time. Plated cells were counted at 1, 4, and 7 days after plating in triplicates, and the increase in cell number was used to calculate the average doubling time. The error bars represent the standard deviation (SD), and the P values, determined using Student's t-test, indicate significant differences between the average values of hESC/hiPSC lines compared to the average values of naïve hESC/hiPSC lines. 3 The similarities in signaling and epigenetic characteristics between naïve human embryonic stem cells (hESCs) and mouse embryonic stem cells (mESCs). In panel A, the dependence of pluripotent cell lines on specific signaling pathways was assessed. After a 7-day period, the wells were fixed and stained to determine the percentage of colonies positive for pluripotency markers. Mouse stem cells were stained with SSEA1. The colony formation was normalized to a control growth medium without inhibitors, which was represented in the first left column. Normalized percentages below 5% were categorized as “sensitivity” to the presence of the supplemented inhibitor. Panel B shows the expression of early germ-cell markers through RT-PCR in the presence or absence of BMP4/7/8 cytokines. Lastly, in panel C, a representative analysis using fluorescence in situ hybridization (FISH) was conducted to examine the presence of XIST RNA (red) and Cot1 nuclear RNA (green). The Pri-WIBR3.2 cell line was analyzed after being passaged in conventional bFGF/serum-containing human ESC growth conditions. The numbers provided in the figure indicate the average percentage of XIST-positive nuclei counted. 4 The similarities in gene expression between naive human embryonic stem cells (hESCs) and naive human-hiPSCs with mouse embryonic stem cells (mESCs). (A) a bar chart comparing the expression levels of pluripotency and lineage-specific marker genes in hESCs and naive hESCs, with asterisks indicating genes that showed significant differences between the two groups of samples; (B) a fluorescence-activated cell sorting (FACS) analysis measuring the surface expression of human and mouse major histocompatibility complex (MHC) class I alleles, with a black graph representing the control isotype match; (C) a cross-species gene expression clustering depicting the grouping of mESCs and naive hESCs as distinct from mEpiSCs (mouse epiblast stem cells) and hESCs. The legend on the right explains that yellow and blue colors represent positive and negative correlations, respectively. The gene expression levels were clustered based on Spearman correlation and average linkage, with mouse samples labeled in purple and human samples labeled in brown. Reprinted from [628] with permission from the PNAS
Fig. 12
Fig. 12
1 The process of deriving and utilizing human induced pluripotent stem (iPS) cells. It shows that adult somatic cells, which are specialized cells in the body, can be reprogrammed into iPS cells capable of differentiating into various cell types. These iPS cells have several applications. a) One application is disease modeling, where human iPS cells are used to investigate the molecular mechanisms behind disease phenotypes. For example, they can be employed to study the molecular causes of arrhythmia in cardiomyocytes or defects in neurogenic differentiation. b) Human iPS cells can also be utilized in drug screening and discovery. They help determine the effects of candidate drugs and new compounds and identify target pathways. c) Another valuable application of human iPS cells is in conducting toxicity tests for cardiac, neural, and liver cells. These tests assess the toxic responses of cells to drugs and substances. Combining drug screening and toxicity tests allows for human preclinical trials in a controlled laboratory setting, enabling early involvement of “the patient” in the drug discovery process. 2 The use of human induced pluripotent stem (iPS) cells for modeling cardiac and neural diseases and the improvement of disease symptoms. In the first scenario (a), skin fibroblasts taken from a patient with type 1 long QT syndrome (LQT1), which is caused by a mutation in the KCNQ1 potassium channel gene, were reprogrammed into iPS cells using retroviral transduction of four specific genes. These iPS cells were then transformed into clusters called embryoid bodies and subsequently differentiated into cardiomyocytes. The presence of spontaneous contraction in these cells indicated the existence of functioning heart muscle cells. By applying isoprenaline, a substance that mimics β-adrenergic stress, arrhythmic events similar to those observed in LQT1 patients' hearts were induced in the cardiomyocytes. However, when the β-blocker propranolol was administered, the arrhythmia was suppressed. In the second scenario (b), skin fibroblasts were obtained from a patient with Rett syndrome (RTT), which is caused by a mutation in the MECP2 gene responsible for regulating epigenetic processes. These fibroblasts were reprogrammed into human iPS cells using retroviral transduction of the same four genes mentioned earlier. The iPS cells were then differentiated into embryoid bodies, and the appearance of rosette structures indicated the presence of neural precursors. Further differentiation of these precursors resulted in the formation of glutamatergic neurons. These neurons exhibited reduced numbers of glutamatergic synapses (represented by red dots) and a decrease in soma size (the cell body of the neuron). However, treatment with insulin-like growth factor 1 (IGF1) caused an increase in both the number of glutamatergic synapses and the size of the neuron's soma. Reprinted from [726] with permission from the Springer Nature
Fig. 13
Fig. 13
1 The similarity in appearance between induced pluripotent stem (iPS) clones and human embryonic stem cells (HESC). In panel A', the figure shows colonies of NHDF1 (normal human dermal fibroblast) cells infected with different viruses. These viruses include an empty virus, a GFP-containing virus, or a combination of six viruses, each carrying one of five specific transcription factors or GFP. The colonies are observed under phase contrast microscopy, revealing their diverse morphologies. Panels B-B” provide phase-contrast images of specific colonies from the cultures transduced with the combination of five transcription factors and GFP. These images are merged with live TRA-1–81 staining (shown in red) and GFP fluorescence (shown in green) derived from the pMX-GFP virus. The upper images show the merged view, while the lower images display only the TRA-1–81 channel. It is noteworthy that only a small fraction of colonies exhibit TRA-1–81 positivity, as indicated in panels B and B'. Importantly, the TRA-1–81 staining in these positive colonies closely resembles that of HESC. Panels C–C” display phase-contrast images of iPS clones at different passages, highlighting their morphological characteristics. Finally, panels D-D”' present “live” TRA-1–81 staining merged with the phase-contrast appearance of specific iPS clones at passage 5. 2 The induced pluripotent stem (iPS) clones exhibit important markers found in human embryonic stem cells (HESC). In panel A and A', polymerase chain reaction (PCR) was performed on genomic DNA obtained from various sources: iPS clones, “early” OCT4/C-MYC clones, NHDF1 (normal human dermal fibroblast) cells infected with control or defined factor viruses, and HSF1 or H9 HESC. The PCR targeted specific regions of integrated viruses, with a loading control PCR for a genomic region on the X chromosome within the XIST locus. Additionally, iPS clones 24 and 29 were included in panel A' as a positive control for the PCR conditions. In panel B, reverse transcription PCR (RT-PCR) was conducted to analyze pMX retroviral transcription and the expression of endogenous counterparts of the defined factors, as well as other genes specific to HESC (TDGF1 through REX1), in iPS clones, NHDF1 cells, HSF1 HESC, and OCT4/CMYC clones. It is worth noting that iPS clones 24 and 29, as well as the OCT4/CMYC clones, displayed limited suppression of expression from the viruses they received. 3 The comparison of the transcriptome (gene expression profile) between induced pluripotent stem (iPS) clones and human embryonic stem cells (HESC). In panel A, the expression values of various cell types are presented on a scatter plot using genome-wide microarray expression data. The cell types include fibroblasts infected with control viruses or viruses carrying specific factors, iPS clones 2 and 5, and the HSF1 HESC line. It is observed that iPS clones 2 and 5 exhibit a high similarity to the HSF1 HESC, while iPS lines 1 and 7 show slightly less similarity. Panel B represents the global Pearson correlation analysis of the entire expression data between the different cell types, indicating the degree of similarity in gene expression. Panel C displays the hierarchical clustering of gene-expression data using the indicated cell types. The analysis involved normalization and expression analysis with DNA-chip analyzer (dChip), filtering genes based on a 20% presence call, and removing redundant probe sets. In panel D, the 2,000 most up- and down-regulated genes in HSF1 versus NHDF (normal human dermal fibroblast) were identified from genome-wide expression datasets. The expression of these genes was further analyzed to determine if they were up-regulated, down-regulated, or showed no change in expression between iPS clones (or infected fibroblast pools) and NHDF. The terms “MI” and “MD” represent statistically marginal increase and decrease, respectively. 4 The formation of embryoid bodies (EBs) by induced pluripotent stem (iPS) cells, which is comparable to human embryonic stem cells (HESCs). Panel A displays phase-contrast images of EBs created from iPS clones 2 and 5. Panel B demonstrates the growth of iPS-derived EBs when placed on adherent tissue culture dishes using three distinct media conditions. One of the media conditions includes the presence of bone morphogenetic protein 4 (BMP). 5 The pluripotency of induced pluripotent stem (iPS) cells and the increased expression of markers associated with ectoderm, endoderm, and mesoderm. In panel A, a real-time RT-PCR analysis compares the expression of pluripotency genes in iPS cells and control human embryonic stem cells (HESC) after inducing differentiation through embryoid body (EB) formation and subsequent plating under specific conditions (BMP4, FBS, and retinoic acid). The analysis measures the fold change in gene expression relative to the reference gene GAPDH. Notably, the down-regulation of pluripotency markers like OCT4 and NANOG is observed during EB differentiation. In panel B, a similar analysis is conducted, but this time the expression of marker genes associated with different germ layers is examined. Each marker is specific to a particular germ layer, as indicated. The y-axis represents the fold induction of gene expression compared to undifferentiated cells. While the extent of induction of lineage markers may vary between HESC and iPS clones, the overall pattern remains consistent. Reprinted from [728]with permission from the PNAS
Fig. 14
Fig. 14
1 The process of creating 4n complementation mice using iPSCs without the need for integration. Panel (a) shows the method used to generate integration-free iPSCs. Panel (b) displays the morphology and alkaline phosphatase staining of these iPSCs. Panel (c) presents PCR analysis results, indicating the absence of integration of the reprogramming vector in the iPSC lines tested. The reprogramming plasmid serves as a positive control. Panel (d) demonstrates the normal karyotypes of the iPSCs through G-banding chromosomal analysis. Panel (e) exhibits immunofluorescence staining of pluripotent markers (Nanog, Oct3/4, Sox2, and SSEA-1) in iPSCs. Panel (f) displays the results of RT-PCR analysis, indicating successful differentiation of iPSCs into three germ layers. Panel (g) shows the formation of teratomas containing all three embryonic germ layers when iPSCs are injected into severe-combined-immune-deficiency mice. Panel (h) represents iPSC mice generated through 4n complementation. Finally, panel (i) presents the results of SSLP analysis, which distinguishes mice derived from different iPSC lines. 2 The successful transplantation of skins derived from iPSCs, which were well-tolerated by the host and effectively repaired skin wounds. In (a), a schematic diagram demonstrates the transplantation of skin, islets, and hearts derived from iPSC mice onto different locations of recipient mice. T-cell proliferation or interferon (INF)-γ release assays were used to detect primed T cells. (b) showcases the wound repair achieved through the transplantation of iPSC-derived skin. The transplanted iPSC skin, similar to embryonic stem cell (ESm) and genetically identical skin (syngeneic), survived successfully for over 100 days in recipient mice. Allogeneic skin transplants, serving as negative controls, were rejected within three weeks. Representative images in (b) depict the grafts 20 weeks after transplantation. (c) provides a summary of the survival rates of explanted iPSC skin 20 weeks post-transplantation. ESm and syngeneic skin transplants are shown as positive controls, while allogeneic skin transplants are negative controls. (d) displays histological staining (H&E staining) of iPSC skin isolated from recipient mice eight weeks after transplantation. Allografts were stained one week after transplantation and served as a negative control. iPSC skin explants exhibited normal structures similar to ESm and syngeneic mice, while extensive tissue necrosis was observed in allografts. (e) demonstrates that T-cell infiltration was minimal in iPSC skin explants eight weeks after transplantation. T cells were identified through immunostaining using anti-CD3, anti-CD4, and anti-CD8 antibodies. Sections from the spleen and allogeneic skin grafts (one week after transplantation) were used as positive controls. (f) quantifies the percentage of proliferating cells, while (g) presents an interferon (IFN)-γ release assay to detect primed T cells in recipients of iPSC-derived skin. The quantified results are shown as mean ± s.e.m. of triplicates for each group (syngeneic: n = 3; ESm: n = 6; iPSC: n = 6; allogeneic: n = 3). 3 The effectiveness of iPSC-derived islets in reducing high glucose levels in diabetic mice. In panel (a), the survival of iPSm islets in C57BL/6 hosts is summarized after 8 weeks of transplantation. Panel (b) displays representative images of iPSm islets that were transplanted under kidney capsules, with dot circles indicating the location of the grafted islets. Panel (c) shows the detection of T-cell infiltration in iPSm islets using an anti-CD3 antibody (shown in green). Engrafted islets are labeled with anti-insulin staining (shown in red). In panel (d), the quantification of T-cell proliferation induced by different stimulators is presented, with the mean and standard error of the mean (s.e.m.) shown for each group (syngeneic, ESm, iPSm, and allogeneic). Panel (e) presents the quantification of interferon (IFN)-γ release, again with the mean and s.e.m. shown for each group (syngeneic, ESm, iPSm, and allogeneic). Panel (f) displays the monitoring of blood glucose levels in diabetic mice that were engrafted with allogeneic, syngeneic, and iPSm islets. The different groups are represented by different colors (iPSm in yellow, syngeneic in green, and allogeneic in purple). Finally, in panel (g), the glucose tolerance test conducted 8 weeks after islet transplantation is shown. Diabetic mice engrafted with iPSm islets (represented in green) exhibited efficient response to high-glucose injection similar to mice transplanted with syngeneic islets (represented in purple). 4 Heart transplantation using iPSC-derived cells. (a) Survival rates of mouse hearts derived from iPSCs (iPSm), embryonic stem cells (ESm), syngeneic (genetically identical), and allogeneic (genetically different) transplants in recipient mice. (b) iPSm hearts beat at similar rates to ESm and syngeneic hearts. (c) Transplanted hearts were examined using H&E staining. (d) T-cell infiltration was assessed by staining heart sections with anti-CD3 antibodies (green). No significant T-cell infiltration was observed in iPSm, ESm, and syngeneic mouse hearts from genetically identical recipients, while allografts showed extensive T-cell infiltration (positive controls). Scale bars represent 50 μm. (e) T-cell proliferation and (f) interferon (INF)-γ release were measured to detect activated T cells in mice with iPSm, ESm, syngeneic, and allogeneic heart transplants. (g) Expression of the Zg16 and Hormad1 genes in transplanted skin, islets, and hearts eight weeks after transplantation. Reprinted from [734] with permission from the Springer Nature

Similar articles

Cited by

References

    1. Rowe RG, Daley GQ. Induced pluripotent stem cells in disease modelling and drug discovery. Nat Rev Genet. 2019;20:377–388. doi: 10.1038/s41576-019-0100-z. - DOI - PMC - PubMed
    1. Li L, Papadopoulos V. Advances in stem cell research for the treatment of primary hypogonadism. Nat Rev Urol. 2021;18:487–507. doi: 10.1038/s41585-021-00480-2. - DOI - PubMed
    1. Lawrence M, Evans A, Moreau T, Bagnati M, Smart M, Hassan E, et al. Process analysis of pluripotent stem cell differentiation to megakaryocytes to make platelets applying European GMP. NPJ Regen Med. 2021;6:27. doi: 10.1038/s41536-021-00138-y. - DOI - PMC - PubMed
    1. Chandrasekaran V, Carta G, da Costa PD, Gupta R, Murphy C, Feifel E, et al. Generation and characterization of iPSC-derived renal proximal tubule-like cells with extended stability. Sci Rep. 2021;11:11575. doi: 10.1038/s41598-021-89550-4. - DOI - PMC - PubMed
    1. Shi Y, Inoue H, Wu JC, Yamanaka S. Induced pluripotent stem cell technology: a decade of progress. Nat Rev Drug Discov. 2017;16:115–130. doi: 10.1038/nrd.2016.245. - DOI - PMC - PubMed

MeSH terms

LinkOut - more resources