. 2024 May;8(5):628-649.
doi: 10.1038/s41551-023-01139-6. Epub 2023 Nov 27.

Engaging natural antibody responses for the treatment of inflammatory bowel disease via phosphorylcholine-presenting nanofibres

Affiliations

Engaging natural antibody responses for the treatment of inflammatory bowel disease via phosphorylcholine-presenting nanofibres

Elizabeth J Curvino et al. Nat Biomed Eng. 2024 May.

Abstract

Inflammatory bowel disease lacks a long-lasting and broadly effective therapy. Here, by taking advantage of the anti-infection and anti-inflammatory properties of natural antibodies against the small-molecule epitope phosphorylcholine (PC), we show in multiple mouse models of colitis that immunization of the animals with self-assembling supramolecular peptide nanofibres bearing PC epitopes induced sustained levels of anti-PC antibodies that were both protective and therapeutic. The strength and type of immune responses elicited by the nanofibres could be controlled through the relative valency of PC epitopes and exogenous T-cell epitopes on the nanofibres and via the addition of the adjuvant CpG. The nanomaterial-assisted induction of the production of therapeutic antibodies may represent a durable therapy for inflammatory bowel disease.


Conflict of interest statement

Competing Interests Statement

E.J.C and J.H.C are listed as inventors on a pending patent application (PCT/US2023/019876) for the described technology. All other authors declare they have no competing interests.

Figures

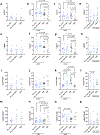
ED Figure 1.
ED Figure 1.
Mice were immunized either i.p. or s.c. at weeks 0, 2, and 4 with PC-Q11 coassembled with PADRE-Q11 and with or without CpG adjuvant. a, Serum total anti-PC IgG responses showed that i.p. immunization raised the greatest responses and that these responses were vastly improved with the addition of CpG. b, Serum anti-PC IgM responses showed significantly greater IgM for mice immunized i.p. with CpG. c, Week 5 ELISpot of splenocytes restimulated with PADRE peptide showed heightened T-cell responses after immunizations containing CpG with biasing towards IFNγ for i.p. immunized mice. SFC = spot forming cell. AUC = area under the curve. Mean + or ± SEM are shown. Statistical significance determined by two-way RM ANOVA with Tukey’s multiple comparison test for a and b, two-way ANOVA with Šídák’s multiple comparisons test for c. n = 5 mice.
ED Figure 2.
ED Figure 2.
Negative-stained TEMs of (a) PC-Q11 (1 mM PC-Q11 coassembled with 0.2 mM Cys4-Q11, 0.05 mM PADRE-Q11, and 0.75 mM Q11) and (b) PCM-Q11 (0.2 mM PCM-Q11 coassembled with 0.2 mM Cys4-Q11, 0.05 mM PADRE-Q11, and 1.55 mM Q11) both coassembled with 10% Cys4-Q11 showed that the addition of excess free cysteines did not inhibit nanofiber formation. c, Mice were immunized i.p. at weeks 0, 2, and 4 with PC-Q11 or PCM-Q11 coassembled with PADRE-Q11 and with or without Cys4-Q11. Serum total anti-PC IgG responses indicated that the addition of Cys4-Q11 did not significantly enhance anti-PC IgG antibody levels for PC-Q11 or PCM-Q11. Mean + SEM are shown. AUC = area under the curve. ns = not significant via two-way RM ANOVA with Tukey’s multiple comparison test. n = 5 mice.
ED Figure 3.
ED Figure 3.
Mice were immunized i.p. at weeks 0, 2, 4, and 9 with 10% PCM-Q11 as used in other experiments (0.2 mM PCM-Q11, 1.75 mM Q11, and 0.05 mM PADRE-Q11) or 25% PCM-Q11 with 2.5x the amount of PC epitope (0.5 mM PCM-Q11, 1.45 mM Q11, and 0.05 mM PADRE-Q11) with CpG adjuvant. Serum total anti-PC IgG responses showed that both 10% PCM-Q11 and 25% PCM-Q11 raised robust anti-PC IgG responses that were not statistically different from each other via two-way RM ANOVA. AUC = area under the curve. Mean ± SEM are shown. n = 5 mice.
ED Figure 4.
ED Figure 4.
a, Timeline of CD4+ T-cell depletion experiment. Mice were injected i.p. with 200 μg of either anti-CD4 or isotype control antibody on days −3, 1, 3, 7, 11, 15, and 19 and immunized i.p. on day 0 and 14 with PC-Q11 or PCM-Q11 coassembled with PADRE-Q11 and CpG adjuvant. b,c, Representative flow plots verifying CD4+ T cell depletion in unimmunized mice at (b) day 0 and (c) day 22 in the spleen, draining lymph nodes (axial, brachial, and inguinal), and mesenteric lymph nodes. d,e, Representative histograms of the CD4+ population in naïve or depleted mice at (d) day 0 and (e) day 22. n = 2 mice per group per timepoint.
ED Figure 5.
ED Figure 5.
a, Spleen CFUs, an indication of bacterial spread from colon damage, were not different among groups. b, Measures of FITC-dextran in serum after oral gavage were not different among groups. Data from chronic colitis experiment 2. Mean ± SEM are shown. Lack of statistical significance determined by one-way ANOVA with Tukey’s multiple comparison test. n = 10 mice.
ED Figure 6.
ED Figure 6.
a, Timeline of Il10−/− colitis model where mice were immunized i.p. on days −35, −21, and −7 with PCM-Q11 coassembled with PADRE-Q11 and CpG adjuvant or PBS (disease control) followed by piroxicam administration in food fines for 7 days to trigger colitis and then 16 additional days of symptom monitoring. b,c, Robust anti-PC IgG (b) and IgM (c) antibody responses were generated in Il10−/− mice. d, IgG subclasses elicited showed the same biasing as in wild-type C57BL/6 mice immunized with PCM-Q11/CpG. e,f, There was no significant difference in weight loss (e) or fecal consistency (f) scores between piroxicam-administered groups. g, PCM-Q11/CpG immunization significantly improved bleeding scores compared to disease controls. h, Both PCM-Q11/CpG and PBS-administered mice given piroxicam developed moderate colitis levels as indicated by total histology scores. i-k, Hematoxylin and eosin-stained sections showed similar colon mucosal hyperplasia and inflammation in Il10−/− mice exposed to piroxicam, whether immunized with PCM-Q11/CpG (i) or with PBS alone (j). Mice immunized with PCM-Q11/CpG but not exposed to piroxicam had minimal to no colitis (k). Distal colon is shown for all mice. Scale bar indicates 200 µm. Mean +, - or ± SEM are shown. Statistical significance determined by mixed-effects analysis with Tukey’s multiple comparison test for b,c and e-g, two-way ANOVA with Tukey’s multiple comparison test for d, and one-way ANOVA with Tukey’s multiple comparison test for h. n = 10 mice for PCM-Q11/CpG with piroxicam group or n = 9 mice for other groups.
ED Figure 7.
ED Figure 7.
a-d, CD19+ B cells isolated from the colon after: (a) immunization, (b) therapeutic DSS colitis (c) chronic DSS colitis, and (d) Il10−/− piroxicam-induced colitis. e-h, B220+ B cells isolated from the colon after: (e) immunization, (f) therapeutic DSS colitis (g) chronic DSS colitis, and (h) Il10−/− piroxicam-induced colitis. i-l, CD19+CD5+ B1a cells isolated from the colon after: (i) immunization, (j) therapeutic DSS colitis (k) chronic DSS colitis, and (l) Il10−/− piroxicam-induced colitis. m-p, B220+CD138+ plasma cells isolated from the colon after: (m) immunization, (n) therapeutic DSS colitis (o) chronic DSS colitis, and (p) Il10−/− piroxicam-induced colitis. Percentages are reported as the percent of the parent population. Mean ± SEM are shown. Statistical significance determined by one-way ANOVA with Tukey’s multiple comparison test. For immunization group, n = 5 mice, for chronic DSS colitis, n = 10 mice except for the PBS with DSS group where n = 9 mice, for therapeutic colitis, n = 10 mice, and for Il10−/− piroxicam-induced colitis, n = 9 mice except for the PCM-Q11/CpG with piroxicam group where n = 10 mice.
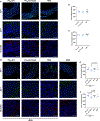
ED Figure 8.
ED Figure 8.
a-c, Immunization with PCM-Q11 coassembled with PADRE-Q11 and with or without CpG adjuvant at weeks 0, 2, and 4, does not significantly alter ZO-1 or occludin levels in the colon at week 5. a, Representative images showing colon section overviews (top row, scale bar = 500 μm) and region of interest ZO-1 and occludin staining (bottom two rows, scale bar = 50 μm). b,c, ZO-1 (b) and occludin (c) levels are not significantly different in immunized mice versus healthy controls. d-f, ZO-1 and occludin levels in the colon after chronic colitis experiment 2. d, Representative images showing colon section overviews (top row, scale bar = 500 μm) and region of interest ZO-1 and occludin staining (bottom two rows, scale bar = 50 μm). e,f, ZO-1 (e) and occludin (f) levels varied slightly among groups with PCM-Q11/CpG administered mice have significantly less ZO-1 and occludin than some other groups. Mean ± SEM are shown. Statistical significance determined by one-way ANOVA with Tukey’s multiple comparison test. n = 5 mice. DAPI = blue, ZO-1 = green, and occludin = red.
Fig. 1 |
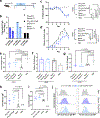
Fig. 1 |. Nanofiber design and influence of PC conjugation chemistry and multivalency.
a, Schematic representation of PC-bearing nanofibers shown with a coassembled T-helper epitope. b, Schematic of nanofiber components. c, Structures of pa-PC-Q11 (phosphoramidate linkage) versus PC-Q11 (phosphodiester linkage). d, Negative-stained TEMs showing nanofiber morphology of pa-PC-Q11 (1 mM pa-PC-Q11 coassembled with 1 mM Q11) and PC-Q11 (1 mM PC-Q11 coassembled with 1 mM Q11), both diluted 10-fold before imaging. e, Zeta potential of nanofibers (formulations as in D) indicates the zwitterionic surface charge expected of PC only for PC-Q11, n = 3 technical replicates. f, Serum total anti-PC IgG responses of mice immunized s.c and i.p. at weeks 0, 3, and 11 with either pa-PC-Q11 or PC-Q11 (both coassembled with PADRE-Q11), n = 5 mice. g, Schematic representation of PCM-Q11 nanofibers shown with a coassembled T-cell epitope. h,i, Schematic and structure of PCM-Q11 nanofiber component showing 4 cysteines with attachment sites for PC. j, Negative-stained TEMs showing nanofiber morphology of PCM-Q11 (0.2 mM PCM-Q11 coassembled with 1.8 mM Q11), diluted 10-fold before imaging. k, ThT assay illustrating β-sheet structure, n = 3 technical replicates. l, Serum total anti-PC IgG responses of mice immunized i.p. at weeks 0, 2, and 4 with PC-Q11 or PCM-Q11 (both coassembled with PADRE-Q11), n = 5 mice. AUC = area under the curve. Mean ± SEM are shown for e, k, and l. Mean + SEM are shown for f. Statistical significance was determined by two-way RM ANOVA with Tukey’s multiple comparison test at week 12 for f (for i.p. PC-Q11, P = 0.0003 for i.p. pa-PC-Q11 and P = 0.0002 for s.c pa-PC-Q11) and two-way RM ANOVA for l.
Fig. 2 |
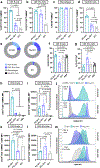
Fig. 2 |. PCM-Q11 is taken up more selectively by B1a cells over all other B cells.
Cells were isolated from i.p. lavage fluid 4 hours after i.p. injection of TAMRA-labeled nanofibers or PBS and analyzed via flow cytometry. a-d, Nanofiber uptake in non-B1a (CD5-) B cells (a), B1a (CD5+) cells (b), macrophages (c), and DCs (d) indicated that macrophages acquired all three nanofibers, large percentages of the other three cell types all acquired PC-Q11, yet B1a cells acquired PCM-Q11 to a greater extent than DCs or non-B1a B cells. e, Average percentage of each cell type among total TAMRA+ cells. f,g, PCM-Q11 led to fewer non-B1a B cells in the peritoneal cavity than PC-Q11 and controls (f) and recruited almost three times as many B1a cells as PC-Q11 (g). h,i, TAMRA MFI of B cells (h) and B1a cells (i). j, Representative histograms showing TAMRA MFI plotted against mode-normalized cell counts for B cells and B1a cells further indicated more selective uptake of PCM-Q11 by B1a cells. k,l, CD86 MFI of TAMRA+ B cells (k) and B1a cells (l). m, Representative histograms showing CD86 MFI plotted against mode-normalized cell counts for TAMRA+ B cells and B1a cells shows that PCM-Q11 more selectively activates B1a cells. Percentages are reported as the percent of the parent population. Mean ± SEM are shown. Statistical significance determined by one-way ANOVA with Tukey’s multiple comparison test. Results combined from two experiments. n = 10 mice except for Q11 where n = 9 mice and k and l where n = 6 mice.
Fig. 3 |
Fig. 3 |. Addition of the T-cell epitope, PADRE, and CpG adjuvant to PC immunizations broadens the antibody subclasses produced and enhances T-cell responses.
a-c, Mice were immunized i.p. at weeks 0, 2, and 4 with PC-Q11 or PCM-Q11 with or without coassembled PADRE-Q11. a, Serum total anti-PC IgG responses. b, Serum anti-PC IgM and IgG subclass responses at week 5. c, ELISpot of splenocytes stimulated with PADRE peptide indicated no significant T-cell response after i.p. immunization at week 5. d-f, Mice were immunized i.p. at weeks 0, 2, and 4 with CpG-adjuvanted PC-Q11 or PCM-Q11 with or without coassembled PADRE-Q11. d, Serum total anti-PC IgG responses. e, Serum anti-PC IgM and IgG subclass responses at week 5. f, ELISpot of splenocytes stimulated with PADRE peptide showed significant T-cell response after i.p. immunization for PADRE-containing immunizations at week 5. g-m, Mice were injected i.p. with either an anti-CD4 depletion or isotype control antibody at days −1, −3, 3, 7, 11, 15, and 19 and immunized i.p. at weeks 0 (day 0) and 2 (day 14) with CpG-adjuvanted PC-Q11 or PCM-Q11 coassembled with PADRE-Q11. g,h, Serum anti-PC IgM was produced regardless of CD4+ T-cell presence. i,j, Serum total anti-PC IgG production was significantly dependent on CD4+ T cells. k,l, Serum anti-PC IgG subclass responses at week 3 show that IgG3 is the main subclass produced in CD4-depleted mice. m, PADRE-specific T-cell responses are present in isotype control antibody administered mice at week 3. AUC = area under the curve. SFC = spot forming cell. Mean + or ± SEM are shown. Statistical significance was determined by two-way RM ANOVA with Tukey’s multiple comparison test for a and d, two-way ANOVA with Tukey’s multiple comparison test for b, e, k, and l, two-way ANOVA with Šídák’s multiple comparison test for c, f, and m, and two-way RM ANOVA for g-j. n = 10 mice for a, b, d, and e, n = 5 mice for c, f, and g-m.
Fig. 4 |
Fig. 4 |. Immunization with PCM-Q11 is protective in a model of chronic colitis.
a, Timeline of chronic colitis experiment. Mice were immunized i.p. at days −35, −21, and −7 with either PCM-Q11 (coassembled with PADRE-Q11) with or without CpG adjuvant. Control mice received PBS immunizations. Chronic colitis was induced on day 1 via administration of 2% DSS (w/v) for 5 days followed by 5 days of normal drinking water for 3 cycles at which point mice were euthanized. b, Serum total anti-PC IgG responses. c, Serum anti-PC IgM. d, Serum anti-PC IgG subclass responses at week 5, before beginning DSS administration. e, Daily mouse body weights as a percentage of their day 0 weight. f, Daily disease activity index (DAI) scores as a combination of weight loss, fecal score, and occult blood, with high scores indicating more severe disease. g, Colon lengths were significantly longer for immunized groups compared to DSS disease controls. h, IL-10 levels of colon homogenates measured via ELISA. Results combined from two experiments except for IL-10 data (h), which is from chronic colitis experiment 1. Mean +, - or ± SEM are shown. Statistical significance determined by two-way RM ANOVA for b and c, two-way ANOVA with Tukey’s multiple comparison test for d, mixed-effects analysis with Tukey’s multiple comparison test for e and f, and one-way ANOVA with Tukey’s multiple comparison test for g and h. n = 20 mice except for h where n = 10 mice, ns = not significant.
Fig. 5 |
Fig. 5 |. Protective effects of PCM-Q11 immunization repeat through one cycle of DSS colitis in males and females, reduce bacterial spread after colon damage, and are not attributed to CpG alone.
a, Timeline of one cycle of DSS colitis experiment. Mice were immunized i.p. at days −35, −21, and −7 with either PCM-Q11 (coassembled with PADRE-Q11) with or without CpG, CpG alone, or PBS (control mice). Colitis was induced on day 1 via administration of 2% DSS (w/v) for 5 days followed by 5 days of normal drinking water, concluding at day 10. b, Serum total anti-PC IgG responses. c, Daily mouse weights as a percentage of their original weight, with statistical comparisons shown below. d, DAI scores as a combination of weight loss, fecal score, and occult blood, with statistical comparisons shown below. e, Colon lengths were significantly longer for immunized groups compared to CpG alone and DSS disease controls. f, Spleen CFUs indicate that immunizations prevented colon damage-associated bacterial spread to the spleen, although this effect was more pronounced in female mice. g, IL-10 levels of colon homogenates showed no significant difference among disease groups; however, PCM-Q11 immunized IL-10 colon levels in males were also not significantly different from healthy controls. Mean +, - or ± SEM are shown. PBS without DSS control groups in Fig. 5 female mice (c-g) and Fig. 8 (c-g) are the same data, as these experiments were run in parallel. Female and male experiments were conducted separately. P values for c and d are shown in Supplementary Tables 3–6. Statistical significance determined by two-way RM ANOVA with Tukey’s multiple comparison test for b and c female, mixed-effects analysis with Tukey’s multiple comparison test for c male and d, and one-way ANOVA with Tukey’s (e,g) or Dunnett’s (to PBS with DSS disease control) (f) multiple comparison test for e-g. n = 5 for female mice. n = 5 for male mice except in f as 1 mouse each in the PBS with DSS and PCM-Q11 groups reached humane endpoint before the experimental endpoint making n = 4 for those groups, ns = not significant.
Fig. 6 |
Fig. 6 |. PCM-Q11 immunizations reduce disease severity when administered therapeutically between DSS-colitis cycles.
a, Timeline of therapeutic DSS colitis experiment. Colitis was induced by administering one cycle of DSS colitis achieved by 5 days of 2% DSS in water followed by normal drinking water. Mice were monitored daily until they on average regained their original body weight on day 20. Mice were immunized i.p. with PCM-Q11 co-assembled with PADRE-Q11 and with or without CpG on days 20, 32, and 45; colitis symptoms were monitored twice weekly. An additional cycle of colitis was then induced on day 51 via 5 days of 2% DSS in water followed by 5 days of normal drinking water for a total of 10 days with daily monitoring until the experimental endpoint on day 60. b-d, Serum total anti-PC IgG (b), IgM (c), and IgG subclass (d) responses. e, Daily mouse weights as a percentage of their original weight. f, DAI scores as a combination of weight loss, fecal score, and occult blood (* on day 26 indicates significantly higher DAI scores in the PBS with DSS group, with P = 0.0039 to PCM-Q11, P = 0.0157 to PCM-Q11/CpG, and P = 0.0003 to PBS without DSS). g, Colon lengths were significantly longer for immunized groups compared to DSS disease controls. h, Spleen CFUs indicate that immunizations prevented colon damage-associated bacterial spread and were similar to healthy controls. i, FITC-dextran serum measurements taken 3 hours after oral gavage of 3-5kDa m.w. FITC-dextran on day 60. Mean +, - or ± SEM are shown. Statistical significance determined by two-way RM ANOVA for b and c, two-way ANOVA with Tukey’s multiple comparison test for d, two-way RM ANOVA with Tukey’s multiple comparison test at day 60 for e, two-way RM ANOVA from day 50–60 with Tukey’s multiple comparison test for f, and one-way ANOVA with Tukey’s (g,i) or Dunnett’s (to PBS with DSS disease control) (h) multiple comparison test for g-i. n = 10 mice.
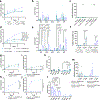
Fig. 7 |
Fig. 7 |. Gut microbiome diversity is decreased by both PCM-Q11 immunization and DSS administration.
Fecal samples from 5 mice in each group from the chronic DSS model experiment 1 were collected either at week 0 (naïve), week 5 (pre-DSS), or week 9 (post-DSS) and analyzed by sequencing the V4 variable region of the 16S rRNA gene. a,b, Family-level taxonomic histogram illustrating relative abundance of gut microbiome (a) before and after PCM-Q11 (coassembled with PADRE-Q11) immunization with and without CpG and (b) after DSS administration. c, Phylum and family names of bacteria in taxonomic histogram in order of decreasing abundance. d, Jaccard Emperor plot showing clustering of groups based on beta diversity. e-f, Measures of alpha diversity including (e) observed OTUs and (f) Shannon diversity index for immunized groups before and after immunization and after DSS. g,h, Measures of alpha diversity including (g) observed OTUs and (h) Shannon diversity index comparing healthy water control mice and immunized or disease control mice after DSS administration. Mean ± SEM are shown. Statistical significance determined by two-way ANOVA with Tukey’s multiple comparison test for e and f, one-way ANOVA with Tukey’s multiple comparison test for g and h. n = 5 mice.
Fig. 8 |
Fig. 8 |. PC-immunized serum significantly reduces DAI scores, increases colon length when passively transferred, and binds late apoptotic cells.
a, Timeline of serum passive transfer (PT) with one cycle of DSS colitis. Sera from mice immunized i.p. with either PCM-Q11 (coassembled with PADRE-Q11) with or without CpG adjuvant or PBS (naïve) was transferred i.v. at day 0 and colitis was induced on day 1. b, Serum total anti-PC IgG responses collected immediately before DSS administration and at the endpoint. c, Daily weight loss showed no difference among disease groups. d, Daily DAI scores indicated reduced scores for immunized serum PT groups compared to naïve serum PT. e, Colon lengths were longer for immunized serum PT groups compared to the naïve serum PT control. f, Spleen CFUs. g, Colon IL-10 levels. h-j Caco2 colon epithelial cells were given DSS for 24 hours to induce apoptosis and then treated with PBS or pooled serum from mice immunized with either PCM-Q11 (coassembled with PADRE-Q11) with or without CpG adjuvant or PBS (naïve serum). Anti-mouse IgM or IgG binding to apoptotic cells was then determined via flow cytometry. h, There was significantly more anti-mouse IgM detected on apoptotic cells treated with serum from PCM-Q11/CpG immunized mice than naïve serum or PBS controls. i, There was significantly more anti-mouse IgG detected on apoptotic cells treated with serum from PCM-Q11 and PCM-Q11/CpG immunized mice compared to naïve serum or PBS controls. j, Representative histograms showing either anti-mouse IgM or IgG MFI in live versus late apoptotic cells. Mean +, - or ± SEM are shown. PBS without DSS control groups in Fig. 5 female mice (c-g) and Fig. 8 (c-g) are the same data, as these experiments were run in parallel. Statistical significance was determined by two-way RM ANOVA with Tukey’s multiple comparison test for c, mixed-effects analysis with Tukey’s multiple comparison test for d, and one-way ANOVA with Tukey’s (e and g-i) or Dunnett’s (to PBS with DSS disease control) (f) multiple comparison test for e-i. ns = not significant. n = 5 mice for a-g or cell samples for h,i.

Similar articles

Cited by

References

    1. Collaborators, G. B. D. I. B. D. The global, regional, and national burden of inflammatory bowel disease in 195 countries and territories, 1990–2017: a systematic analysis for the Global Burden of Disease Study 2017. Lancet Gastroenterol Hepatol 5, 17–30, doi:10.1016/S2468-1253(19)30333-4 (2020). - DOI - PMC - PubMed
    1. Guan Q A Comprehensive Review and Update on the Pathogenesis of Inflammatory Bowel Disease. J Immunol Res 2019, 7247238, doi:10.1155/2019/7247238 (2019). - DOI - PMC - PubMed
    1. Chang JT Pathophysiology of Inflammatory Bowel Diseases. N Engl J Med 383, 2652–2664, doi:10.1056/NEJMra2002697 (2020). - DOI - PubMed
    1. Huber W et al. [Life-threatening complications of Crohn’s disease and ulcerative colitis: a systematic analysis of admissions to an ICU during 18 years]. Dtsch Med Wochenschr 135, 668–674, doi:10.1055/s-0030-1251915 (2010). - DOI - PubMed
    1. Papamichael K et al. Infliximab in inflammatory bowel disease. Ther Adv Chronic Dis 10, 2040622319838443, doi:10.1177/2040622319838443 (2019). - DOI - PMC - PubMed

LinkOut - more resources